HAL Id: hal-03147119
https://hal-amu.archives-ouvertes.fr/hal-03147119
Submitted on 22 Mar 2021
HAL is a multi-disciplinary open access
archive for the deposit and dissemination of
sci-entific research documents, whether they are
pub-lished or not. The documents may come from
teaching and research institutions in France or
abroad, or from public or private research centers.
L’archive ouverte pluridisciplinaire HAL, est
destinée au dépôt et à la diffusion de documents
scientifiques de niveau recherche, publiés ou non,
émanant des établissements d’enseignement et de
recherche français ou étrangers, des laboratoires
publics ou privés.
Distributed under a Creative Commons Attribution - NonCommercial - NoDerivatives| 4.0
International License
Correlations between microbial population dynamics,
bamA gene abundance and performance of anaerobic
sequencing batch reactor (ASBR) treating increasing
concentrations of phenol
Oscar Franchi, Léa Cabrol, Rolando Chamy, Francisca Rosenkranz
To cite this version:
Oscar Franchi, Léa Cabrol, Rolando Chamy, Francisca Rosenkranz. Correlations between microbial
population dynamics, bamA gene abundance and performance of anaerobic sequencing batch reactor
(ASBR) treating increasing concentrations of phenol. Journal of Biotechnology, Elsevier, 2020, 310,
pp.40-48. �10.1016/j.jbiotec.2020.01.010�. �hal-03147119�
Correlations between microbial population dynamics, bamA gene abundance
and performance of anaerobic sequencing batch reactor (ASBR) treating
increasing concentrations of phenol
Oscar Franchi
a,*
, Léa Cabrol
b, Rolando Chamy
a,c, Francisca Rosenkranz
caEscuela de Ingeniería Bioquímica, Pontificia Universidad Católica de Valparaíso, Avenida Brasil 2085, Valparaíso, Chile bAix Marseille Univ, Univ Toulon, CNRS, IRD - Mediterranean Institute of Oceanography (MIO - UM 110), Marseille, France cNúcleo Biotecnología Curauma, Pontificia Universidad Católica de Valparaíso, Avenida Universidad 330, Valparaíso, Chile
A R T I C L E I N F O Keywords: Anaerobic digestion bamA gene Illumina sequencing Microbial community Phenol A B S T R A C T
The relevant microorganims driving efficiency changes in anaerobic digestion of phenol remains uncertain. In this study correlations were established between microbial population and the process performance in an anaerobic sequencing batch reactor (ASBR) treating increasing concentrations of phenol (from 120 to 1200 mg L−1). Sludge samples were taken at different operational stages and microbial community dynamics was ana-lyzed by 16S rRNA sequencing. In addition, bamA gene was quantified in order to evaluate the dynamics of anaerobic aromatic degraders. The microbial community was dominated by Anaerolineae, Bacteroidia, Clostridia, and Methanobacteria classes. Correlation analysis between bamA gene copy number and phenol concentration were highly significant, suggesting that the increase of aromatic degraders targeted by bamA assay was due to an increase in the amount of phenol degraded over time. The incremental phenol concentration affected hydro-genotrophic archaea triggering a linear decrease of Methanobacterium and the growth of Methanobrevibacter. The best performance in the reactor was at 800 mg L−1of phenol. At this stage, the highest relative abundances of Syntrophorhabdus, Chloroflexus, Smithella, Methanolinea and Methanosaeta were observed and correlated posi-tively with initial degradation rate, suggesting that these microorganisms are relevant players to maintain a good performance in the ASBR.
1. Introduction
Phenol is a widespread compound present in many industrial ef-fluents such as coal conversion processes, petroleum refineries, herbi-cide manufacturing and petrochemicals. The concentration of phenolic compounds in this kind of effluents varies from 10 to 17,000 mg L−1
contributing to 40–80 % of its total chemical oxygen demand (COD) (Veeresh et al., 2005).
To treat effluents containing phenol, several physicochemical and biological treatments are available. Among biological processes, dif-ferent anaerobic technologies that work with biomass retention such as upflow anaerobic sludge blanket reactor (UASB), expanded granular sludge bed reactor (EGSB) and anaerobic sequencing batch reactor (ASBR) have been implemented to cope with the presence of phenol. The advantages that these anaerobic systems offer compared to other biological technologies are: high organic loading rates capacity; me-thane production; low sludge generation and the capability of retaining
microbes with special functions (e.g. phenolic compounds degradation) (Almendariz et al., 2005;Veeresh et al., 2005;Rosenkranz et al., 2013). Due to the antimicrobial properties of phenol, this compound is toxic and inhibitory for most microorganisms (Chen et al., 2008a). In anaerobic sludge, half-maximal effective concentrations (EC50) are
re-ported to be between 120 and 225 mg gVS−1(Hernandez and Edyvean, 2008;Wirth et al., 2015). Either in a phenol-acclimated and non-ac-climated sludge, increasing concentrations of this compound affects the anaerobic digestion performance, deteriorating both the removal effi-ciency and methane production rate (Fang et al., 2004;Chapleur et al., 2016). According to this, the identification of the microbial populations resistant to high phenol concentrations is relevant to design and es-tablish operational strategies capable to maintain such microbial members in order to improve the system´s stability. In line with this, one of thefinal goals of the microbial community studies in anaerobic digestion systems is to find the relationship between specific micro-organims dynamics and system´s performance in order to determine if
⁎Corresponding author.
E-mail address: oscar.franchi.m@mail.pucv.cl(O. Franchi).
this relationship could be useful to establish performance biomarkers that serves as early warning indicators of process failure or performance enhancement (Carballa et al., 2015).
Molecular approaches such as DNAfingerprinting and sequencing methods have been used to unravel relationships between microbial community dynamics and performance changes under variable phenol concentrations (Fang et al., 2004;Rosenkranz et al., 2013;Wirth et al., 2015;Chapleur et al., 2016;Madigou et al., 2016). In all these studies, the results show that Clostridiales is a highly abundant order during anaerobic digestion of this compound, together with -in some cases-Anaerolinaceae and Syntrophaceae (Rosenkranz et al., 2013;Wirth et al., 2015), suggesting that they play an important role in the process. However, the identification of high abundant microorganisms in the process not necessarily implies high activity from them (De Vrieze et al., 2016) and low abundance populations could even be more active than the most abundant ones, as demonstrated by metatranscriptomic and metaproteomic methods (Zakrzewski et al., 2012;Hanreich et al., 2013).
For this reason, a robust statistical analysis of the microbial com-munity abundance dynamics must be done to establish which micro-organisms are significantly correlated with a particular performance parameter of the process. Pearson correlation analysis tests have been used to identify key microbial players driving the performance/effi-ciency of anaerobic digesters (Regueiro et al., 2015;Shin et al., 2016). Regarding anaerobic digestion process of phenol, a correlation analysis between changes in the abundance of certain microorganisms and the performance of the reactor is still lacking.
Even though the sequencing analysis of microbial communities by 16S rRNA gene display more accurate results than fingerprinting methods (for example, DGGE band sequencing) (Pylro et al., 2016) this analysis also has some limitations due that the identity of micro-organisms depends on reported sequences within databases. Because of that, it is recomendable to complement this information by studying functional genes (Oka et al., 2011).
In the anaerobic degradation pathway of phenol this compound is first oxidized to benzoate, which is then activated and converted to benzoyl-coA by benzoyl-CoA ligase. This intermediate compound is dearomatized by the benzoyl-CoA reductase to form cyclohex-1,5-diene-1-carbonyl-CoA. The oxidation of this product follows a kind of beta-oxidation, which includes a hydrolytic opening of the alicyclic ring which is mediated by the 6-oxocyclohex-1-ene-1-carbonyl-CoA hydro-lase. The product of this cleavage follows β-oxidation reactions to produce acetate (Levén et al., 2012;Fuchs, 2008). The bamA gene for example codifies the hydrolase which catalyse the ring cleavage step of 6-oxocylcohex-1-ene-1-carbonyl-CoA during the anaerobic degradation of phenol via the 4-hydroxybenzoate to benzoyl-CoA pathway (Kuntze et al., 2008,2011;Laempe et al., 1999). This gene has been used as a biomarker of aromatic-degrading anaerobes and has been correlated positively with the amount of degraded mono aromatic compounds (Sun et al., 2014). Therefore, the study of the bamA gene dynamics in the anaerobic digestion process of phenol is an interesting approach to estimate the abundance of anaerobes effectively involved in the de-gradation of this compound.
In this context, the present work aims at studying the microbial community dynamics of an anaerobic sequencing batch reactor (ASBR) treating increasing phenol concentrations, and to assess the potential
correlations between reactor performance parameters and abundances of specific phylotypes within the sludge community in order to find potential performance biomarkers within the process. The microbial community was analyzed both at the total diversity level by a taxo-nomic approach (through next-generation sequencing of 16S rRNA gene by Illumina MiSeq) and at the functional population level by targeting anaerobic phenol-degraders (through bamA gene quantifica-tion).
2. Material and methods 2.1. Experimental set-up
A 5 L laboratory-scale ASBR was operated using a granular sludge inoculum from a tobacco waste water treatment plant at 12 g of volatile suspended solids per liter (VSS L−1), as previously described in
Rosenkranz et al. (2013). Biomass concentration was kept approxi-mately constant by doing sludge purges, every two weeks. The reactor was operated at 37 °C and fed with synthetic wastewater containing phenol (Sigma-Aldrich, 99%) as the sole carbon source and 21.4 mg L−1of KH2PO4, 4.3 mg L−1of NH4Cl and NaHCO3to maintain
alka-linity in a range of 2.5–3.0 g CaCO3L−1. Each cycle of ASBR operation
is constituted of 4 steps: feeding (20 min), reaction (the time needed to degrade at least 90% of phenol), biomass settling (1 h) and effluent discharge (20 min). The volume exchange ratio was 60%. After an in-itial acclimation to phenol at 120−240 mg L−1that lasted 80 days (22
cycles), the inlet phenol concentration was progressively increased from 120 to 1200 mg L−1duringfive operational stages (I to V), as described inTable 1.
2.2. Analytical methods
Volatile suspended solids were measured according to Standard Methods (APHA, 1995). Phenol was detected and quantified by a gas
chromatograph GC-8A (Shimadzu, Kyoto, Japan), equipped with a 30″x4 mm ID packed column GP 60/80 Carbopack C/0.3% Carbowax 20 M/ 0.1% H3PO4(Sigma Aldrich, St Louis, MO, US). The analysis was
carried out at 120 °C, using nitrogen as carrier gas (50 mL/min) and a flame ionization detector at 200 °C.
2.3. Performance evaluation
All the following performance indicators excepting the elimination capacity (EC) were calculated during the last cycle of operation at each stage, once the degradation time got stabilized thus indicating the adaptation of the process to each concentration step. The EC was cal-culated as the total degraded phenol amount divided by the total de-gradation time over the entire stage, relative to the biomass content (mg phenol g−1VSS−1L−1 D-1). The initial phenol degradation rate (IDR) was calculated as the slope of thefirst linear region of the de-gradation profiles and dede-gradation time (DT) was defined as the time required to degrade at least 90 % of inlet phenol during the last cycle of the stage.
Stage I II III IV V
Inlet phenol concentration [mg L−1] 120 ± 60 240 ± 4 500 ± 50 800 ± 7 1200 ± 43 Initial degradation rate (mg phenol · VSS−1· d−1) 10 11 13 15 13 Elimination capacity (mg phenol · VSS−1·d−1) 26 28 19 31 11 Degradation time of last cycle (h) 13 20 45 50 215 Operational time (d) /number of cycles 39/22 18/7 21/6 33/7 85/6 Table 1
−80 °C for the 16S rRNA gene sequencing analysis and quantitative PCR assay (for this study). Briefly, in each stage of operation, sludge samples were collected at the end of the last cycle of operation, once phenol degradation efficiency reached at least 90%. Sludge samples were centrifuged at 10,000 g for 10 min and 0.5 g of pellet obtained were used for DNA extraction using the Powersoil DNA Isolation Kit (MO BIO Laboratories) following the manufacturer´s instructions. The integrity of DNA extracts was checked by 2% agarose gel electrophor-esis. DNA concentration and purity were tested by UV spectro-photometric analysis at 260, 280 and 230 nm using a Nanodrop (Shi-madzu Bio Spec-nano).
2.5. Quantitative PCR (qPCR)
The quantification assays were conducted in an AriaMX real-time PCR cycler (Agilent). Total bacteria and archaea abundances were as-sayed using the protocol described byYu et al. (2006). The bamA gene quantification was performed using the primer set sp9 and Bam-asp1 targeting a 300 bp fragment (Kuntze et al., 2008). Each 20 u L PCR reaction contained 10 u L of Takyon Rox SYBR MasterMix dTTP Blue (Eurogentec, Köln, Germany), 0.9 u M of each primer and 2 u L of ten fold diluted DNA template. The thermal program consisted of an initial denaturation (95 °C, 3 min) and 44 amplification cycles (95 °C for 3 s; 60 °C for 40 s). Melting curves were constructed from 65 °C to 95 °C, read every 0.5 °C for 5 s. Calibration curves of bamA gene (10°-106gene
copies/uL) were prepared using genomic DNA from the anaerobic phenol-degrader Thauera aromatica (DSM 6984) assuming a genome size of 4.6 Mb (Kazy et al., 2010) and one copy number of this gene per genome. Quantification was carried out on triplicate samples. The qPCR efficiencies for all reactions were between 90–100 %. The results were expressed in gene copy number per gram of wet weight of sludge. 2.6. 16S rRNA amplicon gene sequencing
DNA samples were sequenced targeting the V4-V5 hyper variable region of the 16S rRNA gene with primers 515 F and 909R targeting both bacterial and archaeal communities (Wang and Qian, 2009). Se-quencing was performed at MR DNA laboratory (Shallowater, TX, USA) on a MiSeq Illumina sequencer following the manufacturer's guidelines. Sequence data were processed using a proprietary analysis pipeline (MR DNA, Shallowater, TX, USA). In summary, sequences were joined, de-pleted of barcodes then sequences < 150 bp removed, sequences with ambiguous base calls removed. Sequences were denoised, OTUs gen-erated and chimeras removed. Operational taxonomic units (OTUs) were defined by clustering at 3% divergence (97% similarity). Final OTUs (Online Resource 1) were taxonomically classified using BLASTn against a curated GreenGenes database (DeSantis et al., 2006). 2.7. Statistical analysis of microbial community
Microbial community structure and correlation analysis between microbial populations and performance parameters at different stages of the reactor were computed with XLSTAT version 2014 (Addin soft). Beta diversity analysis of microbial community at different operational stages of reactor was carry out using the agglomerative hierarchical clustering (AHC) method, based on the relative abundances profiles of microorganisms at genus level (Eichorst et al., 2013). A dendrogram resulting from the AHC analysis was constructed using the mean link agglomeration method and the Bray-Curtis dissimilarity distance which quantifies how dissimilar a pair of samples is, based on specimen counts (Wong et al., 2016). Heat-map of genus dynamics over the different
operational stages was performed within the Heat-map tool. Principal component analysis (PCA) was performed using the data analysis tool using the option Pearson correlation type and was constructed in order to visualize community structure distribution under different phenol concentrations and its effects on 3 performance parameters: initial de-gradation rate (IDR), elimination capacity (EC) and dede-gradation time (DT). BamA gene abundance was also included as a biological variable in the PCA plot. Significant correlations between genus abundances, environmental and performance parameters together with bamA gene abundance were determined by Pearson correlation test analysis. The results from a Pearson correlation test having a p-value≤ 0.05 were considered as significant.
3. Results and discussion
3.1. Effect of increasing phenol concentrations on process performance After an acclimation period of 80 days, phenol concentration feeding in the ASBR was increased stepwise from 120 ± 60 up to 1200 ± 43 mg L−1in a total process that was divided infive opera-tional stages (Table 1). The detailed analysis of process performance in response to phenol increase was described previously (Rosenkranz et al., 2013) and the most relevant indicators of the process were used in this study to enlighten relationships with the microbial community structure and composition revealed by the 16S rRNA gene sequencing analysis. Briefly, the total degradation time (DT) necessary to degrade 90 % of the compound increased continuously as a result of higher substrate load. DT increase was linear during the first three stages (Table 1), got rather stable during Stage IV, and drastically increased during stage V (more than four times compared to the previous stage). As a result, the Elimination Capacity (EC) remained relatively constant (around 26 mgphenol. VSS−1. d−1) from Stage I to IV, and dropped
down to 11 mgphenol·VSS-1· d-1in Stage V. Within each degradation
profile, the Initial Degradation Rate (IDR) is indicative of the capacity of the community to withstand a new charge load. It increased pro-gressively during thefirst four stages, and then decreased in the last stage. All together, these indicators show a maximal degradation e ffi-ciency at 800 mg L−1of phenol (Stage IV) and suggest the existence of a threshold concentration between 800 and 1200 mg L−1after which the reaction rate slowdowned, evidencing a deterioration of the reactor performance and possible partial inhibition.
Other studies performed in batch assays under methanogenic con-ditions reported a complete inhibition of phenol degradation at 2000 mg L−1(Poirier et al., 2016; Chapleur et al., 2016). In our case, the maximal concentration applied (1200 mg L−1) was below the complete inhibition limit: the degradation rate of the reactor is impaired but the adapted anaerobic biomass due to reactor configuration (ASBR) could tolerate and metabolize this load.
3.2. Total bacterial and archaeal abundances
As can be seen inFig. 1A, the Bacteria and Archaea in this system represent on average 70% and 30%, respectively of the total commu-nity during the whole period, which is consistent with the operating conditions favoring favouring methanogenic activity. Despite reactor performance was negatively affected at the highest phenol concentra-tion there was only a small decrease in total bacteria and archaea abundances only at Stage II (which was rapidly recovered at the sub-sequent stage), total microbial abundance stayed rather constant along the operation, independently of the phenol concentration, suggesting that the toxic phenol threshold implying mortality was not reached and that performance impairement was due to a change in microbial structure configuration rather than biomass losses.
2.4. DNA extraction
The DNA extracts for this research were obtained from a previous study from our lab (Rosenkranz et al., 2013). At that moment the ex-tracts were aliquoted in sterile DNAse free microtubes and stored at
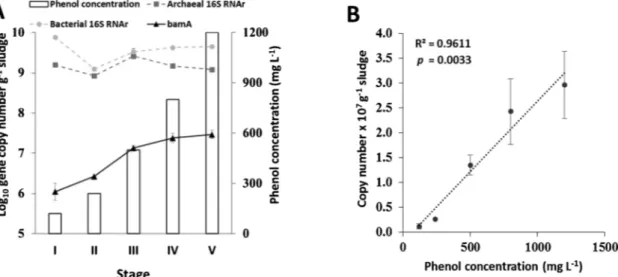
3.3. Evolution of bamA gene abundance at different ASBR stages During the ASBR process the bamA gene levels had an incremental trend as phenol concentration increase (Fig. 1A), suggesting that mi-croorganisms with the capacity to degrade phenol accumulated throughout the process. In our work, phenol is removed through the process and bamA levels increased in a significant positive linear cor-relation (p < 0.01) with phenol concentration (Fig. 1B). Inlet phenol concentration is therefore a strong and direct selective pressure/driving force stimulating the growth of phenol-degraders.
The bamA gene copy number was 2–4 orders of magnitude lower than the total bacterial and archaeal 16SrRNA gene copy number, confirming that the functional community effectively involved in phenol degradation via the benzoyl-CoA pathway represents only a minor fraction (0.3% maximum) of the total community. Variations in 16S rRNA gene copy number per genome between microorganisms also could originate an underestimation of the relative abundance of bamA gene harbouring populations. This result demonstrates the importance to consider the rare biosphere in anaerobic digestion ecosystems, where subdominant species can act as keystones and impact the overall function despite their low abundance, as highlighted in fermentative ecosystems (Rafrafi et al., 2013).
There is only one study that employed bamA gene quantification to enumerate anaerobic aromatic degraders under methanogenic con-ditionns and that suggest a correlation between the increase of bamA gene levels and the removal percentage of an aromatic compound (to-luene) (Sun et al., 2014). Based on this, our result confirms that
quantification of bamA gene could be useful as a monitoring variable capable of describe the progression of degradation process of mono aromatic compounds.
3.4. Microbial community analysis
3.4.1. Effect of phenol concentration at overall microbial community structure in ASBR
Within Bacteria, Miseq amplicon sequencing analysis shows that Anaerolineae, Bacteroidia, Clostridia and Deltaproteobacteria were the dominant bacterial classes in almost all operational stages, except for Stage I (Fig. 2), where Alphaproteobacteria and Bacilli were dominant at the expense of Deltaproteobacteria abundance. The Bacteroidia and Clostridia classes have been reported as dominant in anaerobic batch reactors treating phenol as the sole carbon source at different con-centrations (Wirth et al., 2015). The Deltaproteobacteria class has been
found dominant in mesophilic methanogenic phenol degrading en-richments at 500 mg L−1(Chen et al., 2008b). Anaerolineae, on the other hand, is regarded as an important class from the Chloroflexi phylum, which is part of the“core group” of organisms always found in anaerobic digesters independently of substrate nature (Cabezas et al., 2015).
Within the archaeal domain, Methanobacteria was the dominant class in all operational stages followed by Methanomicrobia. According to these results, it is likely that anaerobic digestion of phenol in this system was carried out mainly via the hydrogenotrophic methanogen-esis pathway.
3.4.2. Structural changes at genus level during ASBR operation
Fig. 3B shows the AHC analysis of microbial community profiles at the genus level (only those with abundances equal or over 0.5% in at
Fig. 1. BamA gene dynamics in ASBR. In A, the abundance of bamA gene, total bacteria and total archaea at different operational stages in ASBR. In B, correlation between phenol concentration applied to inlet feeding in ASBR and bamA gene abundance. The dotted line correspond to the linear model describing the significant correlation between variables. Error bars represents one standard deviation arround the mean.
Fig. 2. Relative abundance at class level of microbial communities in the ASBR at the last cycle of each operational stage. Only classes having abundance≥ 1% in at least one sample are represented otherwise were considered as“others”.
least one sample) and the relative abundances of each genus at different operational stages in ASBR. The dendrogram (Fig. 3A) shows the strongest differentiation between community from stage I (corre-sponding to the lowest phenol concentration at 120 mg L−1) and the other stages, highlighting the sludge acclimatation process to new en-vironmental conditions imposed by phenol feeding. This differentiation was caused mainly by the highest relative abundance of Mycoplana which dominated the bacterial community (33% of total bacteria), as well as the presence of Clostridium (4%) and Sporosarcina (4%), while they were all almost negligible in the following stages (Fig. 4B). As far as we know, this is thefirst report of Mycoplana presence in an anae-robic digester treating phenol. The capacity of Mycoplana to degrade aromatic compounds has been reported previously in pure culture ex-periments (Lakshmi et al., 2013) and was found at low abundance le-vels in a microcosm treating nonylphenol at 100 ppm under nitrate reducing conditions (Wang et al., 2015). Thus, Mycoplana was pre-sumably the main phenol degrader at this stage, followed by Clostridium and Sporosarcina, which have been reported at high abundance in me-thanogenic reactors treating phenolic compounds (Tartakovsky et al., 2001;Hernandez et al., 2013). The drastical decrease of Mycoplana at the following stages suggest that this genus is not adapted to growth efficiently at higher phenol concentrations under methanogenic con-ditions.
Regarding dominant archaeal genera, Methanobacterium (an hy-drogenotrophic methanogen) was the most abundant followed by Methanosaeta (acetotrophic) and Methanolinea (hydrogenotrophic). Methanobacterium dominance, in anaerobic digestion of phenol, has been reported previously (Madigou et al., 2016), but its high abundance is not a necessary requirement to carry out the process efficiently, since other studies involving phenol degradation reported that Methanosaeta, Methanosarcina and Methanoculleus can be dominant too (Poirier et al., 2016;Zhang et al., 2005).
After Stage I, the community structure followed a clear progressive evolution along the phenol concentration gradient applied (between 240 and 1200 mg L−1), as evidenced in the dendrogram representation, where the successive stages cluster together. Within this group, the medium-concentration samples (between 240 and 800 mg L−1) clus-tered together (at ∼70% of similarity), clearly apart from stage V sample, in which the highest concentration of phenol was applied. This
last stage is characterized by the highest abundance of Melioribacter (18%) (which dominated the community), and the presence of Spirochaeta, Methyloversatilis and Methanobrevibacter, in contrast with the previous stages where they were almost negligible, suggesting that these genera were able to tolerate phenol concentration as high as 1200 mg L−1. Within these genera, Methyloversatilis is the only micro-organism capable of metabolizing phenol (Smalley et al., 2015). Me-lioribacter and Spirochaeta on the other hand, were reported to be pre-sent in methanogenic systems treating aromatic compounds but their effective role in phenol degradation is not clear (Li et al., 2014;Xiong et al., 2015). Within all archaeal members, Methanobrevibacter was the only genus that had its maximum abundance at this stage indicating that this hydrogenotrophic methanogen can growth better than other methanogens under this environmental condition.
At stage IV, in which performance of ASBR was better, Methanosaeta and Methanolinea were the methanogens that showed their highest abundance (19 and 4%, respectively) in comparison to other stages as can been seen in the heat-map (Fig. 5). Methanosaeta is a well-known microorganism that produces methane via the acetotrophic pathway (Smith and Ingram-Smith, 2007). This genus probably uses the acetate generated from phenol conversion by direct phenol or benzoate de-graders. Regarding bacterial members, the genera that had their highest abundance value at this stage (compared to the other stages) were Smithella, Syntrophorhabbdus and Chloroflexus (0.9, 2.7 and 4.6%, re-spectively) as can be seen in the heat-map (Fig. 5). From those, Syn-trophorhabdus is the only known phenol degrader that acts in syntrophy with a hydrogen scavenger microorganism to grow (Qiu et al., 2008). Based on this, the highest abundance of the syntrophic phenol degrader Syntrophorhabdus coupled to a greater abundance of the hydro-genotrophic methanogen Methanolinea could be the reason of the in-crease in phenol degradation performance at this stage. An inin-crease in phenol degradation must lead to an increment on acetate production rate, which would explain the greater abundance of Methanosaeta.
3.4.3. Identification and dynamics of core community
The analysis of the microbial populations also allowed us to estab-lish a group of genera that maintained relative abundances of at least 2% in all operational stages, which implies that they can be of great importance to carry out the process successfully. This group was formed
Fig. 3. Microbial community structure at the genus level in ASBR operating at different feeding phenol concentrations (I = 120, II = 240, III = 500, IV = 800 and V = 1200 mg L-1). In A, community clustering analysis based on Bray-Curtis dissimilarity between samples. In B, relative abundance of genera at each stage. Only genera having abundance≥0.5% in at least one sample are represented other-wise were considered as“others”.
by the genera Bellilinea (3.7–7.4%), Longilinea (2.5–14.3%), Anaerophaga (2.1–22.7%) and Methanobacterium (16–29%). Bellilinea and Longilinea are filamentous fermenters that produce volatile fatty acids. They lack the ability to use phenol as carbon source (Yamada et al., 2007) and it is suggested that they may be relevant to maintain the structure of granules in the anaerobic sludge (Yamada et al., 2005), an essential feature needed to work properly in SBR type reactors. On the other hand Anaerophaga is a strict anaerobe fermenter and its pre-sence has been reported previously in microcosms enriched with benzoate (Herrmann et al., 2008) an intermediate compound produced in the anaerobic phenol degradation (Ju and Zhang, 2014), thus Anaerophaga could be using (at least) part of the benzoate generated as
carbon source during the phenol degradation process.
As can be seen inFig. 4, the increase of phenol concentration ne-gatively affected the abundances of Dethiobacter, Longilinea and Me-thanobacterium. All these three genera reducted their abundances to the minimum at the highest phenol concentration. A drop in members be-longing to the core group could be one of the causes for performance impairment at this operational stage. As can be noted in the heat-map, the abatement in Methanobacterium abundance was compensated by a raise of Methanolinea and Methanobrevibacter, both hydrogenotrophic methanogens that share the same ecological function as Methano-bacterium (i.e. hydrogenotrophic methanogenesis) and have been found in the same ecological niches (Yu et al., 2015;Martin Vincent et al., 2018; Prajapat et al., 2019). Abundance changes of co-ocurring ar-chaeal members sharing the same function is caused by an environ-mental condition that favors the growth of one archaeal member over another. In this case, phenol concentration increase fauvored the growth of Methanolinea and Methanobrevibacter over Methanobacterium.
Martin Vincent et al. (2018)reported that during an increase in organic loading in a methanogenic digester Methanobrevibacter increased its relative abundance over Methanobacterium. The latter suggests that the increase in organic load caused by a phenol concentration increment in the ASBR promoted the growth of Methanobrevibacter as well as Me-thanolinea.
3.5. Correlations between microorganisms, bamA gene and performance parameters
A principal component analysis was performed in order to visualize how changes in feeding phenol concentration affects the microbial community structure variability during the different operational stages in ASBR (Fig. 5). In the PCA plot each sample point has an specific
position based on its particular genera abundance profile. This position was represented as circles whose size was proportional to the inlet phenol concentration applied to each operational stage. As can be noted, PC1 (X axis) and PC2 (Y axis) explains a great part of the samples variability (47 % and 33 %, respectively). In addition, performance and environmental variables were represented as arrows, whose direction and length indicate to which sample the increase of this variable is explaining the microbial abundance patterns and the magnitude of that variable in explaining the microbial profiles variation, respectively. Based on the aforementioned, it is possible to observe that phenol concentration (PC) is related with the X axis principal component which means that microbial community structure was shaped at a great extent by the change of phenol feeding concentration. Genera corre-lated significantly with a specific variable is presented inTable 2and were also plotted in the PCA. Significant positive correlations between the abundance of bamA gene with abundances of Cytophaga and Smi-thella were observed. These could mean that (i) they are directly in-volved in phenol degradation (either through bamA pathway, or an-other gene not targeted in our assay) or (ii) they are indirectly related for example through consumption of by-products of phenol degrada-tion. Althought there is no information reported regarding the meta-bolic capacity of Smithella to degrade aromatic compounds, this genus is capable of syntrophically oxidize butyrate and propionate to acetate (Zhang et al., 2017) supporting the hypothesis (ii) of indirect re-lationship with phenol degraders. On the other hand, Cytophaga have been found in anaerobic reactors treating trichlorophenol (Collins et al., 2005) and clones belonging to this genus have been reported to be involved in polyaromatic hydrocarbon degradation under methano-genic conditions (Braun et al., 2015). Based on this and knowing that Cytophaga members harbour the bamA gene (by consulting Kyoto En-cyclopedia of Genes and Genome) (Kanehisa and Goto (2000)), we infer that Cytophaga might be a direct phenol degrader.
Analysis between reactor parameters and microorganisms reveals that there are six genera that correlated positively with phenol con-centration and ten with degradation time (Table 2). Of these,
Fig. 4. Heat map of abundance dynamics for each genera at different ASBR operational.
stages. Only genera having a relative abundance≥ 0.5% in at least one op-erational stage are represented.
Flavobacterium, Ignavibacterium, Spirochaeta and Methanobrevibacter had positive correlations with both parameters. Ignavibacterium was found to be a dominant aniline-degrader in methanogenic microcosm (Sun et al., 2015). Accordingly, this genus has the metabolic machinery to degrade monoaromatic compounds and, based on these results, the capability to tolerate high phenol concentrations. No aromatic de-grading capacity was reported for the other genera. However, spir-ochaetal organisms were found in granular sludge of an EGSB-AF re-actor treating 50 mg L−1 of trichlorophenol and were capable to tolerate the presence of this highly toxic compound (Collins et al., 2005) thus, it is expected that members of Spirochaeta genus are also able to cope with high phenol concentrations. On the other hand, higher degradation time in ASBR observed in stage V indicate that
microbial members positively correlated with these variables were able to maintain the anaerobic digestion process stable (due to their capacity to tolerate high phenol concentration) but less efficiently either because a partial inhibition phenomenon or lower total degradation activity of the microorganisms which leads to display a higher degradation time. Correlation tests also showed that the genera Syntrophorhabdus, Chlor-oflexus and Smithella (maximum abundances at stage IV) have a sig-nificant positive correlation with the initial degradation rate. Syn-trophorhabdus was widely reported in methanogenic systems treating phenolic compounds like phenol and p-cresol (Chen et al., 2009;Levén and Schnürer, 2010;Ju and Zhang, 2014;Na et al., 2016;Franchi et al., 2018a).Ju and Zhang (2014)reported the presence of Syntrophorhabdus in two methanogenic batch reactors treating phenol concentrations between 400 and 1000 mg L-1displaying different degradation rates
and suggested that a higher proportion of this microorganism could explain the higher rate of one reactor. At archaeal level, Methano-bacterium showed a significant negative correlation with phenol con-centration while Methanobrevibacter had a positive correlation with that parameter. Therefore, the concentration of this compound has a nega-tive linear effect on the growth of Methanobacterium and, conversely, promotes in a linear manner the abundance of Methanobrevibacter. One possible explanation of this result, could be the presence of a compe-tition relationship between these archaeal members, a phenomenon which offen occurs in closely related OTUs (both genus belongs to Methanobacteriaceae family) requiring similar resources for growth (i.e. carbon dioxide and hydrogen) (Wu et al., 2016). According to this, the phenol concentration increment, could be a relevant environmental variable in promoting the competition strength of Methanobrevibacter to the detriment of Methanobacterium. On the other hand, although Me-thanolinea and Methanosaeta had positives correlations with initial de-gradation rate of ASBR the p-values of these correlations were just above the significance threshold (0.052 and 0.054, respectively). De-spite this, our results show that the abundance increase of these ar-chaeal members tends to improve the phenol degradation performance in a linear manner. The theorical reason of this trend could be explained first by an increase of the hydrogen scavenging capacity of the system due to a higher abundance of Methanolinea thus favouring Syn-trophorhabdus degrading activity and secondly by an increase in the acetate consumer Methanosaeta which would be contributing to prevent
Fig. 5. Principal component analysis of the microbial structure distribution at genus level and correlations with bamA gene abundance, phenol concentration (PC) and the performance parameters; Elimination capacity (EC), Initial degradation rate (IDR) and degradation time (DT). For each operational stage, the circle size is proportional to feeding phenol concentration. Genera that correlated significantly with one or more variables were presented in the plot together with their specific positions denoted by diamonds.
Table 2
Pearson correlation coefficients (r) between significant correlated genera and Initial degradation rate (IDR), degradation time (DT) (performance variables), phenol concentration (PC) (environmental variable) and bamA gene (biological variable). The p-value is indicated: * < 0.05, ** < 0.01.
Variables
Performance Environmental Biological
Genus IDR DT PC bamA
Chloroflexus 0.957* 0.458 0.771 0.844 Cytophaga 0.782 0.802 0.955* 0.953* Flavobacterium 0.413 0.992** 0.941* 0.862 Halochromatium 0.113 0.982** 0.802 0.678 Ignavibacterium 0.297 1.000** 0.897* 0.799 Melioribacter 0.198 0.995** 0.845 0.732 Methanobacterium −0.596 −0.875 −0.962** −0.946* Methanobrevibacter 0.411 0.960** 0.919* 0.826 Methyloversatilis 0.241 0.995** 0.873 0.769 Pedomicrobium 0.187 0.994** 0.841 0.725 Planctomyces 0.107 0.960** 0.786 0.650 Smithella 0.885* 0.625 0.902* 0.956* Spirochaeta 0.295 0.994** 0.899* 0.804 Syntrophorhabdus 0.983** 0.118 0.541 0.683 Treponema 0.212 0.992** 0.858 0.750 DT 0.296 – 0.896* 0.798 PC 0.683 0.896* – 0.980** bamA 0.799 0.798 0.980** –
4. Conclusions
The increase of phenol concentration at more than 800 mg L−1in ASBR system triggered a performance impairment on degradation process that was associated with an abundance reduction of a core group of microorganisms. At 800 mg L−1of phenol, the degradation performance of ASBR reached its maximum in correspondence with highest abundances of Syntrophorhabdus, Chloroflexus, Smithella, Methanolinea and Methanosaeta which in turn were positively correlated with the initial degradation rate, indicating that the synergistic growth of these microorganisms promoted a better performance of the anae-robic degradation of phenol in the system. On the other hand, bamA gene dynamics showed that aromatic degraders targeted by the qPCR assay were accumulating through the process and correlated possitively with inlet feeding phenol concentration, suggesting that bamA gene quantification could be a useful monitoring variable capable to describe the growth progression of phenol degrading bacteria.
5. Author contributions Author 1: Oscar Franchi Collected the data Performed the analysis Wrote the paper
Author 2: Rolando Chamy
Conceived and designed the analysis Author 3: Léa Cabrol
Performed the analysis
Author 4: Francisca Rosenkranz Conceived and designed the analysis Collected the data
Contributed data or analysis tools Declaration of Competing Interest
The authors declare that they have no known competing financial interests or personal relationships that could have appeared to influ-ence the work reported in this paper.
Acknowledgements
This research was funded by CONICYT Project 781302010 and FONDECYT Project 1151161 from CONICYT−CHILE.
References
Almendariz, F.J., Meraz, M., Olmos, A.D., Monroy, O., 2005. Phenolic refinery waste-water biodegradation by an expanded granular sludge bed reactor. Water Sci. Technol. 52 (1–2), 391–396.
APHA, 1995. Methods for Examination of Water and Wastewater, nineteenthed.
American Public Health Association/American Water Works Association/Water Environment Federation, Washington, DC, USA.
Braun, F., Hamelin, J., Bonnafous, A., Delgenès, N., Steyer, J.P., Patureau, D., 2015. Similar PAH fate in anaerobic digesters inoculated with three microbial communities
accumulating either volatile fatty acids or methane. PLoS One 10 (4), e0125552.
Cabezas, A., de Araujo, J.C., Callejas, C., Galès, A., Hamelin, J., Marone, A., Etchebehere, C., 2015. How to use molecular biology tools for the study of the anaerobic digestion process? Rev. Environ. Sci. Biotechnol. 14 (4), 555–593.
Carballa, M., Regueiro, L., Lema, J.M., 2015. Microbial management of anaerobic di-gestion: exploiting the microbiome-functionality nexus. Curr. Opin. Biotechnol. 33, 103–111.
Chapleur, O., Madigou, C., Civade, R., Rodolphe, Y., Mazéas, L., Bouchez, T., 2016. Increasing concentrations of phenol progressively affect anaerobic digestion of cel-lulose and associated microbial communities. Biodegradation 27 (1), 15–27.
Chen, C.L., Wu, J.H., Liu, W.T., 2008a. Identification of important microbial populations in the mesophilic and thermophilic phenol-degrading methanogenic consortia. Water Res. 42 (8), 1963–1976.
Chen, Y., Cheng, J.J., Creamer, K.S., 2008b. Inhibition of anaerobic digestion process: a review. Bioresour. Technol. 99 (10), 4044–4064.
Chen, C.L., Wu, J.H., Tseng, I.C., Liang, T.M., Liu, W.T., 2009. Characterization of active microbes in a full-scale anaerobicfluidized bed reactor treating phenolic wastewater. Microbes Environ. 24 (2), 144–153.
Collins, G., Foy, C., McHugh, S., O’Flaherty, V., 2005. Anaerobic treatment of 2, 4, 6-trichlorophenol in an expanded granular sludge bed-anaerobicfilter (EGSB-AF) bioreactor at 15 C. FEMS Microbiol. Ecol. 53 (1), 167–178.
De Vrieze, J., Regueiro, L., Props, R., Vilchez-Vargas, R., Jáuregui, R., Pieper, D.H., Carballa, M., 2016. Presence does not imply activity: DNA and RNA patterns differ in response to salt perturbation in anaerobic digestion. Biotechnol. Biofuels 9 (1), 244.
DeSantis, T.Z., Hugenholtz, P., Larsen, N., Rojas, M., Brodie, E.L., Keller, K., Andersen, G.L., 2006. Greengenes, a chimera-checked 16S rRNA gene database and workbench compatible with ARB. Appl. Environ. Microbiol. 72 (7), 5069–5072.
Eichorst, S.A., Varanasi, P., Stavila, V., Zemla, M., Auer, M., Singh, S., Singer, S.W., 2013. Community dynamics of cellulose‐adapted thermophilic bacterial consortia. Environ. Microbiol. 15 (9), 2573–2587.
Fang, H.H.P., Liu, Y., Ke, S.Z., Zhang, T., 2004. Anaerobic degradation of phenol in wastewater at ambient temperature. Trends in Sustain. Prod. 49 (1), 95–102.
Franchi, O., Rosenkranz, F., Chamy, R., 2018a. Key microbial populations involved in anaerobic degradation of phenol and p-cresol using different inocula. Electron. J. Biotechnol. 35, 33–38.
Franchi, O., Bovio, P., Ortega-Martínez, E., Rosenkranz, F., Chamy, R., 2018b. Active and total microbial community dynamics and the role of functional genes bamA and mcrA during anaerobic digestion of phenol and p-cresol. Bioresour. Technol. 264, 290–297.
Fuchs, G., 2008. Anaerobic metabolism of aromatic compounds. Ann. N. Y. Acad. Sci. 1125 (1), 82–99.
Hanreich, A., Schimpf, U., Zakrzewski, M., Schluter, A., Benndorf, D., Heyer, R., Rapp, E., Puhler, A., Reichl, U., Klocke, M., 2013. Metagenome and metaproteome analyses of 610 microbial communities in mesophilic biogas-producing anaerobic batch fer-mentations 611 indicate concerted plant carbohydrate degradation. Syst. Appl. Microbiol. 36 (5), 330–338.
Hernandez, J.E., Edyvean, R.G.J., 2008. Inhibition of biogas production and biodegrad-ability by substituted phenolic compounds in anaerobic sludge. J. Hazard. Mater. 160 (1), 20–28.
Hernandez, C.H., Limam, I., Desmond, E., Bouchez, T., Mazeas, L., 2013. Anaerobic biodegradation of 13C6-phenol: analysis of bacteria population involved in two dif-ferent degradation kinetics. In: In 13th World Congress on Anaerobic Digestion: Recovering (Bio) Resources for the World. (Pp. 4-P).
Herrmann, S., Kleinsteuber, S., Neu, T.R., Richnow, H.H., Vogt, C., 2008. Enrichment of anaerobic benzene-degrading microorganisms by in situ microcosms. FEMS Microbiol. Ecol. 63 (1), 94–106.
Ju, F., Zhang, T., 2014. Novel microbial populations in ambient and mesophilic biogas-producing and phenol-degrading consortia unravelled by high-throughput sequen-cing. Microb. Ecol. 68 (2), 235–246.
Kanehisa, M., Goto, S., 2000. KEGG: kyoto encyclopedia of genes and genomes. Nucleic Acids Res. 28 (1), 27–30.
Kazy, S., Monier, A., Alvarez, P., 2010. Assessing the correlation between anaerobic to-luene degradation activity and bssA concentrations in hydrocarbon-contaminated aquifer material. Biodegradation 21, 793–800.
Kuntze, K., Shinoda, Y., Moutakki, H., McInerney, M.J., Vogt, C., Richnow, H.H., Boll, M., 2008. 6‐Oxocyclohex‐1‐ene‐1‐carbonyl‐coenzyme A hydrolases from obligatory anaerobic bacteria: characterization and identification of its gene as a functional marker for aromatic compounds degrading anaerobes. Environ. Microbiol. 10 (6), 1547–1556.
Kuntze, K., Vogt, C., Richnow, H.H., Boll, M., 2011. Combined application of PCR-based functional assays for the detection of aromatic-compound-degrading anaerobes. Appl. Environ. Microbiol. 77 (14), 5056–5061.
Laempe, D., Jahn, M., Fuchs, G., 1999. 6‐Hydroxycyclohex‐1‐ene‐1‐carbonyl‐CoA dehy-drogenase and 6‐oxocyclohex‐1‐ene‐1‐carbonyl‐CoA hydrolase, enzymes of the benzoyl‐CoA pathway of anaerobic aromatic metabolism in the denitrifying bac-terium Thauera aromatica. Eur. J. Biochem. 263 (2), 420–429.
Lakshmi, M.B., Muthukumar, K., Velan, M., 2013. Optimization of minimal salt medium for efficient phenanthrene biodegradation by Mycoplana sp. MVMB2 isolated from petroleum contaminated soil using factorial design experiments. CLEAN– Soil, Air, Water 41, 51–59.
Levén, L., Schnürer, A., 2010. Molecular characterisation of two anaerobic phenol-de-grading enrichment cultures. Int. Biodeterior. Biodegradation 64 (6), 427–433.
Levén, L., Nyberg, K., Schnürer, A., 2012. Conversion of phenols during anaerobic di-gestion of organic solid waste–a review of important microorganisms and impact of temperature. J. Environ. Manage. 95, S99–S103.
Li, X.K., Ma, K.L., Meng, L.W., Zhang, J., Wang, K., 2014. Performance and microbial community profiles in an anaerobic reactor treating with simulated PTA wastewater: the ASBR acidification. Notably, two paralel metabolic pathways may
be co-occuring during the stage with highest efficiency, which suggest a positive synergic contribution of these archaeal members to the process. These results agree with our previous findings regarding the positive interactions (cooperation) between Syntrophorhabdus, Methanosaeta and hydrogenotrophic archaeas in a context of anaerobic digestion of phe-nolic compounds (Franchi et al., 2018b).
munity analysis of anaerobic granules in phenol-degrading UASB by next generation sequencing. Biochem. Eng. J. 112, 241–248.
Oka, A.R., Phelps, C.D., Zhu, X., Saber, D.L., Young, L.Y., 2011. Dual biomarkers of anaerobic hydrocarbon degradation in historically contaminated groundwater. Environ. Sci. Technol. 45 (8), 3407–3414.
Poirier, S., Bize, A., Bureau, C., Bouchez, T., Chapleur, O., 2016. Community shifts within anaerobic digestion microbiota facing phenol inhibition: Towards early warning microbial indicators? Water Res. 100, 296–305.
Prajapat, G., Jain, S., Agrawal, A., 2019. Microbial diversity and dynamics in hydro-carbon Resource environments. Microbial Diversity in Ecosystem Sustainability and Biotechnological Applications. Springer, Singapore, pp. 533–571.
Pylro, V.S., Morais, D.K., Kalks, K.H.M., Roesch, L.F.W., Hirsch, P.R., Tótola, M.R., Yotoko, K., 2016. Misguided phylogenetic comparisons using DGGE excised bands may contaminate public sequence databases. J. Microbiol. Methods 126, 18–23.
Qiu, Y.L., Hanada, S., Ohashi, A., Harada, H., Kamagata, Y., Sekiguchi, Y., 2008. Syntrophorhabdus aromaticivorans gen. nov., sp. nov., thefirst cultured anaerobe capable of degrading phenol to acetate in obligate syntrophic associations with a hydrogenotrophic methanogen. Appl. Environ. Microbiol. 74 (7), 2051–2058.
Rafrafi, Y., Trably, E., Hamelin, J., Latrille, E., Meynial-Salles, I., Benomar, S., Steyer, J.P., 2013. Sub-dominant bacteria as keystone species in microbial communities produ-cing bio-hydrogen. Int. J. Hydrogen Energy 38 (12), 4975–4985.
Regueiro, L., Lema, J.M., Carballa, M., 2015. Key microbial communities steering the functioning of anaerobic digesters during hydraulic and organic overloading shocks. Bioresour. Technol. 197, 208–216.
Rosenkranz, F., Cabrol, L., Carballa, M., Donoso-Bravo, A., Cruz, L., Ruiz-Filippi, G., Chamy, R., Lema, J.M., 2013. Relationship between phenol degradation efficiency and microbial community structure in an anaerobic SBR. Water Res. 47 (17), 6739–6749.
Shin, S.G., Koo, T., Lee, J., Han, G., Cho, K., Kim, W., Hwang, S., 2016. Correlations between bacterial populations and process parameters in four full-scale anaerobic digesters treating sewage sludge. Bioresour. Technol. 214, 711–721.
Smalley, N.E., Taipale, S., De Marco, P., Doronina, N.V., Kyrpides, N., Shapiro, N., Kalyuzhnaya, M.G., 2015. Functional and genomic diversity of methylotrophic Rhodocyclaceae: description of the new species Methyloversatilis discipulorum sp. Nov. Int. J. Syst. Evol. Microbiol ijs-0.
Smith, K.S., Ingram-Smith, C., 2007. Methanosaeta, the forgotten methanogen? Trends Microbiol. 15 (4), 150–155.
Sun, W., Sun, X., Cupples, A.M., 2014. Presence, diversity and enumeration of functional genes (bssA and bamA) relating to toluene degradation across a range of redox conditions and inoculum sources. Biodegradation 25 (2), 189–203.
Sun, W., Li, Y., McGuinness, L.R., Luo, S., Huang, W., Kerkhof, L.J., Fennell, D.E., 2015. Identification of anaerobic aniline-degrading bacteria at a contaminated industrial site. Environ. Sci. Technol. 49 (18), 11079–11088.
Tartakovsky, B., Manuel, M.F., Beaumier, D., Greer, C.W., Guiot, S.R., 2001. Enhanced selection of an anaerobic pentachlorophenol‐degrading consortium. Biotechnol. Bioeng. 73 (6), 476–483.
Veeresh, G.S., Kumar, P., Mehrotra, I., 2005. Treatment of phenol and cresols in upflow anaerobic sludge blanket (UASB) process: a review. Water Res. 39 (1), 154–170.
Wang, Y., Qian, P.Y., 2009. Conservative fragments in bacterial 16S rRNA genes and primer design for 16S ribosomal DNA amplicons in metagenomic studies. PLoS One 4 (10), e7401.
Wang, Z., Yang, Y., Dai, Y., Xie, S., 2015. Anaerobic biodegradation of nonylphenol in river sediment under nitrate-or sulfate-reducing conditions and associated bacterial community. J. Hazard. Mater. 286, 306–314.
Wirth, B., Krebs, M., Andert, J., 2015. Anaerobic degradation of increased phenol con-centrations in batch assays. Environ. Sci. Pollut. Res. Int. 22 (23), 19048–19059.
Wong, R.G., Wu, J.R., Gloor, G.B., 2016. Expanding the UniFrac toolbox. PLoS One 11 (9), e0161196.
Wu, L., Yang, Y., Chen, S., Zhao, M., Zhu, Z., Yang, S., He, Q., 2016. Long-term succes-sional dynamics of microbial association networks in anaerobic digestion processes. Water Res. 104, 1–10.
Xiong, S., Li, X., Chen, J., Zhao, L., Zhang, H., Zhang, X., 2015. Crude oil degradation by bacterial consortia under four different redox and temperature conditions. Appl. Microbiol. Biotechnol. 99 (3), 1451–1461.
Yamada, T., Sekiguchi, Y., Imachi, H., Kamagata, Y., Ohashi, A., Harada, H., 2005. Diversity, localization, and physiological properties offilamentous microbes be-longing to Chloroflexi subphylum I in mesophilic and thermophilic methanogenic sludge granules. Appl. Environ. Microbiol. 71 (11), 7493–7503.
Yamada, T., Imachi, H., Ohashi, A., Harada, H., Hanada, S., Kamagata, Y., Sekiguchi, Y., 2007. Bellilinea Caldifistulae gen. nov., Sp Nov and Longilinea arvoryzae gen. nov., Sp nov., Strictly Anaerobic, Filamentous Bacteria of the Phylum Chloroflexi isolated From Methanogenic Propionate-degrading.
Yu, Y., Kim, J., Hwang, S., 2006. Use of real‐time PCR for group‐specific quantification of aceticlastic methanogens in anaerobic processes: population dynamics and commu-nity structures. Biotechnol. Bioeng. 93 (3), 424–433.
Yu, B., Zhang, D., Shan, A., Lou, Z., Yuan, H., Huang, X., Zhu, N., 2015. Methane-rich biogas production from waste-activated sludge with the addition of ferric chloride under a thermophilic anaerobic digestion system. RSC Adv. 5 (48), 38538–38546.
Zakrzewski, M., Goesmann, A., Jaenicke, S., Jünemann, S., Eikmeyer, F., Szczepanowski, R., Al-Soud, W.A., Sørensen, S., Pühler, A., Schlüter, A., 2012. Profiling of the me-tabolically active community from a production-scale biogas plant by means of high-throughput metatranscriptome sequencing. J. Biotechnol 158 (4), 248–258.
Zhang, T., Ke, S.Z., Liu, Y., Fang, H.P., 2005. Microbial characteristics of a methanogenic phenol-degrading sludge. Water Sci. Technol. 52 (1), 73–78.
Zhang, J., Mao, L., Zhang, L., Loh, K.C., Dai, Y., Tong, Y.W., 2017. Metagenomic insight into the microbial networks and metabolic mechanism in anaerobic digesters for food waste by incorporating activated carbon. Sci. Rep. 7 (1), 11293.
from mesophilic to thermophilic temperature. Water Res. 61, 57–66.
Madigou, C., Poirier, S., Bureau, C., Chapleur, O., 2016. Acclimation strategy to increase phenol tolerance of an anaerobic microbiota. Bioresour. Technol. 216, 77–86.
Martin Vincent, N., Wei, Y., Zhang, J., Yu, D., Tong, J., 2018. Characterization and dy-namic shift of microbial communities during start-up, overloading and steady-state in an anaerobic membrane bioreactor. Int. J. Environ. Res. Public Health 15 (7), 1399.