HAL Id: hal-02402594
https://hal.archives-ouvertes.fr/hal-02402594
Submitted on 1 Jun 2021
HAL is a multi-disciplinary open access
archive for the deposit and dissemination of
sci-entific research documents, whether they are
pub-lished or not. The documents may come from
teaching and research institutions in France or
abroad, or from public or private research centers.
L’archive ouverte pluridisciplinaire HAL, est
destinée au dépôt et à la diffusion de documents
scientifiques de niveau recherche, publiés ou non,
émanant des établissements d’enseignement et de
recherche français ou étrangers, des laboratoires
publics ou privés.
Distributed under a Creative Commons Attribution| 4.0 International License
to intergenerational accelerated reproductive aging in
female mice
Moïra Rossitto, Margot Ollivier, Stéphanie Déjardin, Alain Pruvost, Christine
Brun, Candice Marchive, Anvi Laetitia Nguyen, Aurelie Ghettas, Celine
Keime, Bernard de Massy, et al.
To cite this version:
Moïra Rossitto, Margot Ollivier, Stéphanie Déjardin, Alain Pruvost, Christine Brun, et al.. In utero
exposure to acetaminophen and ibuprofen leads to intergenerational accelerated reproductive aging in
female mice. Communications Biology, Nature Publishing Group, 2019, 2 (1),
�10.1038/s42003-019-0552-x�. �hal-02402594�
In utero exposure to acetaminophen and ibuprofen
leads to intergenerational accelerated reproductive
aging in female mice
Moïra Rossitto
1
, Margot Ollivier
1,2
, Stéphanie Déjardin
1
, Alain Pruvost
3
, Christine Brun
4
,
Candice Marchive
1
, Anvi Laetitia Nguyen
3
, Aurélie Ghettas
3
, Céline Keime
5
, Bernard de Massy
4
,
Francis Poulat
1
, Pascal Philibert
1,6
& Brigitte Boizet-Bonhoure
1
Nonsteroidal anti-in
flammatory drugs (NSAIDs) and analgesic drugs, such as acetaminophen
(APAP), are frequently taken during pregnancy, even in combination. However, they can
favour genital malformations in newborn boys and reproductive disorders in adults.
Con-versely, the consequences on postnatal ovarian development and female reproductive health
after in utero exposure are unknown. Here, we found that in mice, in utero exposure to
therapeutic doses of the APAP-ibuprofen combination during sex determination led to
delayed meiosis entry and progression in female F1 embryonic germ cells. Consequently,
follicular activation was reduced in postnatal ovaries through the AKT/FOXO3 pathway,
leading in F2 animals to subfertility, accelerated ovarian aging with abnormal corpus luteum
persistence, due to decreased apoptosis and increased AKT-mediated luteal cell survival. Our
study suggests that administration of these drugs during the critical period of sex
determi-nation could lead in humans to adverse effects that might be passed to the offspring.
https://doi.org/10.1038/s42003-019-0552-x
OPEN
1Development and Pathology of the Gonad, IGH, Centre National de la Recherche Scientifique, Université de Montpellier, Montpellier, France.2Service de
Chirurgie et Urologie Pédiatrique, Hôpital Lapeyronie CHU Montpellier, Centre de Référence Maladies Rares Développement Génital, Montpellier, France.
3Service de Pharmacologie et d’Immunoanalyse (SPI), plateforme SMArt-MS, CEA, INRA, Université Paris-Saclay, Gif sur Yvette, France.4Meiosis and
Recombination, IGH, Centre National de la Recherche Scientifique, Université de Montpellier, Montpellier, France.5IGBMC, Centre National de la Recherche
Scientifique, Université de Strasbourg/INSERM, Illkirch, France.6Département de Biochimie et Hormonologie, Hôpital Lapeyronie, CHU de Montpellier,
Montpellier, France. Correspondence and requests for materials should be addressed to B.B.-B. (email:Brigitte.Boizet@igh.cnrs.fr)
123456789
N
onsteroidal anti-inflammatory drugs (NSAIDs) such as
ibuprofen (IBU) and analgesic drugs such as
acet-aminophen (APAP, or paracetamol) are among the most
commonly prescribed drugs in the
first trimester of pregnancy
1.
About 4% of pregnant women use APAP and NSAIDs in
com-bination
2. These are widely used to treat inflammation and pain
3,
and APAP and NSAIDs combinations are commonly prescribed
to patients with
fibromyalgia
4and acute pain
5to produce additive
effects. However, these molecules can cross the placental
barrier
6,7. Epidemiological studies and experimental in vivo/
ex vivo investigations in rodents, adult men
8and using human
testicular explants
3,9have established a possible link between
prenatal or adult exposure to these drugs and increased effects on
the male reproductive tract formation and physiology, thus
identifying these molecules as putative endocrine disruptors
3,8–10.
Also, early developmental exposure of mouse testes to the
APAP–IBU combination affects adult sperm parameters in the
exposed males and in their offspring
11.
Perinatal exposure of female rodents to high doses of APAP
reduces birth weight without affecting mouse fertility
12and also
decreases the primordial follicle pool in pubertal rats, leading to
early reproductive senescence in adults
13. In utero exposure to
APAP or indomethacin has been associated with a reduced
number of primordial germ cells
14and delayed meiotic entry
15in
fetal mouse and rat ovaries, respectively, leading to a decreased
number of secondary follicles in adult mouse ovaries
14and
reduced fertility in F1 and F2 rat females
15. In ex vivo cultures of
human embryonic ovaries exposed to APAP or IBU, the germ cell
number is reduced due to alterations in their proliferation and
apoptosis
16,17. These studies suggest that the time windows
cor-responding to gonadal sex determination and meiosis entry are
particularly sensitive to the effects of these molecules. However,
the molecular bases of their effects, particularly when such drugs
are used in combination, on the female reproductive health
remain unknown
18,19.
In mouse female embryonic gonads, sex determination starts
with the specific expression of key ovarian somatic genes (e.g.,
Rspo1, Wnt4 and Ctnnb1) at 11.5–12.0 days post coitum (dpc)
that promote oogonial proliferation and survival, and germ cell
meiosis initiation
20,21. FoxL2 is expressed at around 12.0 dpc, and
plays an essential role in the maintenance of the granulosa cell
ovarian phenotype in developing mouse ovaries
21,22. At 12.5 dpc,
female germ cells enter the meiosis I prophase
23and reach
diplotene by 18.5 dpc. At that time, germ cell cysts, which are
formed by interconnected germ cells, undergo breakdown until
birth, and concomitantly, many germ cells are lost through
apoptosis until day 4 post partum (dpp)
24,25. At birth, single
oocytes arrested in the meiotic diplotene/dictyate stage are rapidly
surrounded by
flat pre-granulosa cells to form primordial follicles
(PFs)
26. Most PFs remain quiescent, and only few will mature
into primary follicles through the coordinated action of various
somatic and oocyte factors
26,27, such as Kit ligand that activates
the PI3K/AKT/FOXO3 cascade
28, a major signalling pathway
involved in the regulation of follicle activation and survival
29.
Upon follicle maturation and ovulation, follicular cells
differ-entiate to form the corpus luteum (CL), an endocrine organ that
produces progesterone to support pregnancy
30and that regresses
in the absence of pregnancy
31,32.
The female reproductive lifespan is largely determined by the
PF pool size that is established early in life
33,34. Dysregulation of
the signalling cascades that regulate cell proliferation and cell
death and that determine whether a follicle will continue to
develop or undergo atresia can disturb the balance between PF
dormancy and activation
35. Particularly, environmental factors
acting during the prenatal or adult life seem to be major
deter-minants of the ovarian reserve
19and thus, could contribute to the
onset of premature ovarian insufficiency (POI)
35,36. In this study,
we evaluated whether and how in utero exposure to APAP and
IBU affects the female reproductive system development by
administering human-relevant doses of these drugs, adjusted for
mice, alone or in combination to pregnant mice between 10.5 and
13.5 dpc, the period of sex determination. Upon exposure to the
APAP
+ IBU combination, germ cell proliferation and meiosis
entry/progression were affected in embryonic ovaries, and PF
formation and activation were abnormal in postnatal ovaries.
Consequently, the ovarian reserve decreased progressively in
exposed (F1) animals and their offspring (F2), leading to
sub-fertility in 6-month-old F2 animals that showed accelerated
ovarian aging and abnormal CL persistence.
Results
Increased germ cell proliferation in F1 APAP
+ IBU
embryo-nic ovaries. To evaluate the effect of APAP and/or IBU exposure
on early ovarian development, we administered APAP (30 mg/kg/
day) or IBU (15 mg/kg/day) as single drugs (two gavages per day
for each drug) or in combination (four gavages per day every 3 h:
two for each drug) to pregnant mice between 10.5 and 13.5 dpc
(i.e., the sex determination period). Controls received diluent
alone. We previously reported that at 30 min after oral
admin-istration, APAP and IBU serum levels in pregnant mice
11are
similar to those reported in a xenograft mouse model
37and in the
umbilical cord of human fetuses
16. Furthermore, we detected
these drugs also in the embryos’ liver
11, confirming that they can
cross the placental barrier
6,7. Prostaglandin (PG) quantification in
13.5 dpc ovaries showed that production of PGD
2, PGE
2and
6-keto-PGF
1α, an inactive hydration product of PGI
238, was
decreased by 70%, 32 and 23%, respectively, in 13.5 dpc APAP
+
IBU-exposed ovaries compared with control (Fig.
1a). We could
not detect 15-desoxy-PGJ
2(an active PGD
2metabolite), PGF
2αand TXA2 in control and exposed ovaries.
Co-immunofluorescence analysis of 13.5 dpc female gonad
sections using antibodies against FOXL2 (granulosa cell marker)
or VASA/MVH (germ cell marker) concomitantly with EdU
labelling (S-phase cells) did not highlight any significant difference
in the proliferation rate of F1 germ cells (VASA
+-EdU
+) and
granulosa cells (FOXL2
+-EdU
+) in 13.5 dpc gonads exposed to
one single drug and control (Fig.
1b, c). Conversely, the percentage
of the S-phase germ cells (VASA
+-EdU
+) (Fig.
1d, e), but not of
granulosa cells (FOXL2
+-EdU
+) (Fig.
1c), was significantly higher
in F1 gonads exposed to the APAP
+ IBU combination. Germ cell
proliferation was higher also in 12.5 and 14.5 dpc APAP
+
IBU-exposed ovaries (Fig.
1e), suggesting a delay in germ cell
differentiation (i.e., meiosis entry), which normally initiates at
12.5 dpc. On the other hand, expression of Ddx4 (Vasa/Mvh) was
not modified, whereas that of the Pou5f1 (Oct4) and Dppa4
pluripotent genes was significantly decreased in 13.5 dpc APAP +
IBU ovaries compared with controls (Fig.
1f), suggesting that
pluripotency downregulation might be anticipated. The expression
level of the Wnt4 and FoxL2 ovarian genes also was significantly
affected, but not that of Rspo1 (Fig.
1g), suggesting that
differentiation of the ovarian somatic cell lineage could also be
affected.
Transcriptome analysis of 13.5 dpc female gonads showed that
compared with controls, 2215 genes were downregulated
(<0.75-fold) and 2246 were upregulated (>1.33-(<0.75-fold) in APAP
+ IBU
ovaries (P-value < 5 × 10
–5) (Supplementary Data 1) (data
accessible
through
the
GEO
series
accession
number
GSE122547. Gene ontology analysis using the ToppGene
program
39indicated that APAP
+ IBU exposure influenced many
biological pathways involved in cellular metabolism
(down-regulated genes) and meiotic recombination and meiotic cell cycle
(upregulated genes) (Supplementary Table 1). Among the 104
genes specific to meiotic prophase that have been identified by
Soh et al.
40, two [stimulated by retinoic acid gene 8 (Stra8;
0.76-fold) involved in meiosis initiation; and meiotic recombination
protein Rec8 homologue (Rec8; 0.65-fold)] were downregulated
and 47 were upregulated in APAP
+ IBU-exposed ovaries
(Supplementary Table 2). Several of the upregulated genes were
involved
in
meiosis
progression
40,
such
as
deleted
in
azoospermia-like (Dazl; 1.5-fold), Sycp1 (2.82-fold), Sycp2
(2.45-fold) and Sycp3 (1.78-(2.45-fold) (three genes encoding synaptonemal
complex proteins), double-strand-break repair rad21-like protein
1 (Rad21I; 3.12-fold), spermatogenesis-associated protein 22
(Spata22; 2.66-fold), meiotic protein covalently bound to DSB
(Spo11-1.77-fold), Horma domain-containing proteins 1 and 2
(Hormad1, 1.74-fold, and Hormad2, 1.45-fold), meiosis specific
with coiled–coil domain (Meioc, previously identified as Gm1564,
1.89-fold), DNA repair protein Rad51 associated protein
(Rad51ap2; 3.15- folds) and meiotic recombination protein
Dmc1/Lim15 homologue (Dmc1; 1.77-fold) (Supplementary
Table 2).
Therefore, we analysed the meiosis entry in F1 13.5
dpc-exposed gonads. Immunofluorescence analysis with antibodies
against VASA and
γH2AX (a marker of DNA double-strand
breaks during early meiotic recombination)
41(Fig.
2a, b) or
SYCP3 (a leptotene oocyte marker)
42(Fig.
2c, d), showed that the
percentage of
γH2AX
+and of SYCP3
+among VASA
+cells, was
significantly decreased in 13.5 dpc APAP + IBU-exposed ovaries
compared with controls, suggesting a delay in meiosis entry in
exposed ovaries. Following sex determination, the meiosis
regulator DMRT1 is expressed only in female germ cells
43, where
it is relocated from the nucleus to the cytoplasmic compartment
after meiosis initiation (after 14.5 dpc in mice)
44. In F1 17.5 dpc
APAP
+ IBU-exposed ovaries, DMRT1 was localised in the
nucleus in 9% of VASA
+germ cells whereas in controls, it was
expressed only in the cytoplasm, indicating that some exposed
germ cells were still initiating meiosis at this stage (Fig.
2e, f). We
next assessed the progression of oocyte meiotic prophase using
surface spreads from 13.5 dpc and 17.5 dpc ovaries and staining
with anti-γH2AX, SYCP3 and SYCP1 antibodies to analyse DNA
double-strand break and synaptonemal complex (SC) formation
(Supplementary Fig. 1a). At 13.5 dpc, in the exposed APAP
+
IBU compared with the control group, the percentage of oocytes
at the preleptotene stage was increased (66.6% vs. 39.3%; P-value
< 0.0001), whereas the percentage of oocytes at the leptotene stage
was decreased (32.1% vs. 55.9%; P-value < 0.0001) (Fig.
2g). As
the preleptotene stage is the stage of meiotic initiation, this result
was compatible with a defect in entry into meiosis. At 17.5 dpc,
the percentages of oocytes at early/mid zygotene, late zygotene
and pachytene stages in the exposed vs. the control group were
3% vs. 5.85% (P-value
= 0.92), 9.8% vs. 17.2% (P-value = 0.035)
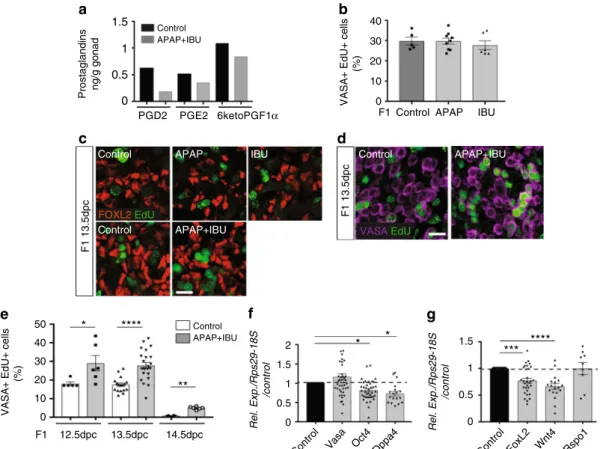
0 1 1.5 0.5 PGD2 PGE2 6ketoPGF1α Prostaglandins ng/g gonad 0 10 20 30 40VASA+ EdU+ cells
(%)
F1 Control APAP IBU
b
a
Control APAP+IBUc
VASA EdU Control APAP+IBUControl APAP IBU
FOXL2 EdU
d
g
0 0.5 1 1.5Control FoxL2 Wnt4 Rspo1
***
****
Rel. Exp./Rps29-18S /control Control APAP+IBU F1 13.5dpc F1 13.5dpc 0 10 20 30 40 Control F1 12.5dpc 13.5dpc 14.5dpc****
**
*
VASA+ EdU+ cells
(%) APAP+IBU
e
50f
0 0.5 1 1.5Control Vasa Oct4Dppa4
Rel. Exp./Rps29-18S
/control
*
*
2Fig. 1 In utero exposure to APAP and NSAIDs increases female germ cell proliferation. a Dosage of PGD2, PGE2and 6-keto-PGF1α(PGI2) by mass spectrometry in F1 13.5 dpc control and APAP+ IBU-exposed ovaries (n = 1 pool of 200 and 220 gonads from 15 control and 15 treated pregnant females, respectively).b Quantification of VASA+EdU+cells in F1 control and APAP or IBU-exposed ovaries; data are the percentage of proliferating EdU+cells among all VASA+cells (n= 20–25 gonads from n = 12 litters). c, d Representative immunofluorescence microscopy images of F1 13.5 dpc ovaries from embryos in utero exposed to ethanol (Control), APAP, IBU or APAP+ IBU between 10.5 and 13.5 dpc and pulsed with EdU at 13.5 dpc; FOXL2 (granulosa cell marker) in red (c), VASA (germ cell marker) (d) in purple and EdU in green (scale bars, 20μm). e Percentage of proliferating EdU+cells among all VASA+cells in F1 control and exposed ovaries at 12.5, 13.5 and 14.5 dpc (EdU pulse at 12.5, 13.5 and 14.5 dpc, respectively) (n= 16–20 gonads from n = 8 litters).f, g Expression analysis of Vasa, Oct4, Dppa4 (f), Foxl2, Wnt4 and Rspo1 (g) in F1 exposed ovaries, normalised to Rps29 and 18S expression and presented as percentage of the expression in control 13.5 dpc ovaries (set to 1). Values are the means ± SEMs; *P < 0.05, **P < 0.01, ***P < 0.005, ****P < 0.001 (e–g)
and 87.1% vs. 74.8% (P-value
= 0.0001), respectively (Fig.
2h).
These results indicate that APAP
+ IBU exposure induced a delay
in meiotic entry and in progression during prophase I of oocytes.
The slight increase of the late zygotene stage could be due to an
extended zygotene stage upon treatment. Specifically, meiosis
initiation is delayed, whereas expression of genes involved in
meiosis progression was increased, suggesting a misregulation of
the normal meiotic differentiation programme. The meiosis delay
and the increased cell proliferation observed in F1 exposed germ
cells at 13.5 dpc could be responsible for the higher number of
γH2AX+ cells (%) 0 20 40 60 80 100 SYCP3+ cells (%) Control APAP+IBU VASA γH2aX
***
SYCP3 VASA Control APAP+IBU
a
0 20 40 60 80 100**
b
i
Control APAP+IBUNuclear DMRT1– VASA+ cells (%)
0 5 10 15 F1 13.5dpc F1 17.5dpc DMRT1 HST Control APAP+IBU Control APAP+IBU VASA Lam F1 17.5dpc Control APAP+IBU
d
c
f
e
Control APAP+IBUh
g
F1 13.5dpc F1 17.5dpc****
*
Oocytes in meiotic prophase I (%) 0 20 40 60 80 0 20 60 100 40 80 Control APAP+IBU Pre leptotene Early leptotene Lateleptotene Leptotene Early/mid zygotene Late zygotene Pachytene
k
Control APAP+IBU****
0 10 20 15 5Number of germ cell per cyst
F1 13.5dpc F1 17.5dpc Control APAP+IBU
j
25****
****
***
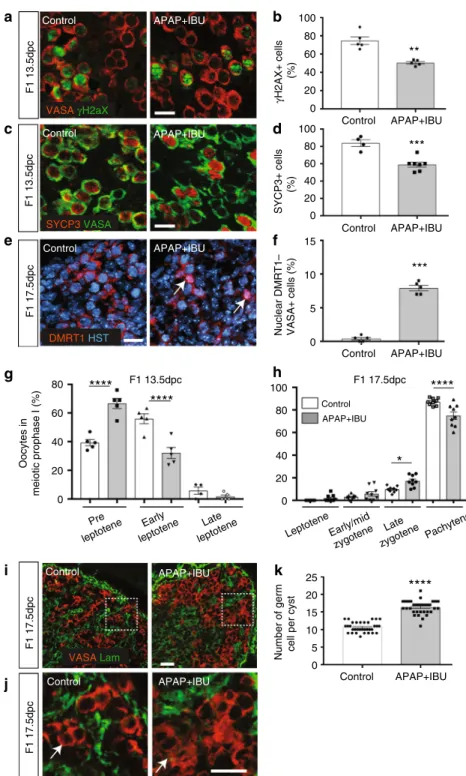
Fig. 2 In utero exposure to APAP+ IBU impairs meiosis progression. a, c, e, i Representative immunofluorescence images of γH2AX (green, a), SYCP3 (red, c), DMRT1 (red,e) and laminin (green, i) together with VASA (a, c, i) or Hoechst dye (HST, blue) (e) in tissue sections from F1 13.5 dpc (a, c) and F1 17.5 dpc (e, i, j) control and APAP+ IBU ovaries. Enlarged panels (j) delineated from panel (i) (white dashed squares) show germ cell cysts. Scale bars = 20 μm. White arrows indicated germ cells with nuclear DMRT1 expression (e) and within a cyst (j). b, d Quantification of γH2AX+(b) and SYCP3+(d) cells among all VASA
+germ cells in control and in utero exposed ovaries; data are the percentage relative to all VASA+cells.f, k Quantification of VASA+germ cells with nuclear
DMRT1 expression (f) and in cysts (k) in F1 17.5dpc ovaries. b, d, f Values are the mean ± SEMs of n= 16–24 gonads from n = 8 litters, **P < 0.01, ***P < 0.005; k Values are the mean ± SEMs of n= 10 (control) and n = 12 (APAP + IBU) gonads from n = 3 litters, ****P < 0.001. g, h Quantification of oocytes of meiotic prophase I on nuclear spreads of F1 13.5 dpc (g) and F1 17.5 dpc (h) ovaries. The data are presented as the percentage of oocytes at the preleptotene, early leptotene and late leptotene stages per total number of analysed oocytes (n= 85 to 105 for 13.5 dpc gonads) (g) and of oocytes at the leptotene, early/mid zygotene, late zygotene and pachytene stages per total number of analysed oocytes (n= 110 to 155 for 17.5dpc gonads) (h). *P < 0.05, ****P < 0.001
germ cells in cysts of exposed ovaries at 17.5 dpc compared with
controls (mean
= 16.2 vs. 10.6 germ cells per section of exposed
and control gonads, P < 0.0001) (Fig.
2i–k).
Primordial follicle formation is increased in postnatal ovaries.
Then, we determined whether these germ cell defects affected the
oocyte and follicle development also after birth. As we previously
observed intergenerational effects of APAP
+ IBU exposure on
mouse testis maturation and function
11, we analysed F1 postnatal
ovaries of animals that were in utero exposed and also of their
offspring (F2) (both F1 parents exposed) relatively to their
respective controls, F1 control and F2 control (Fig.
3a).
We analysed the
first wave of folliculogenesis in 8, 14, 21 and
30 dpp F1 and F2 ovaries. As the phenotypes of F1 control and F2
control animals/ovaries were similar, data from these two groups
were globally referred to as controls. Histological analysis showed
that the morphology of postnatal ovaries (PFs and primary
follicles in 8 and 14 dpp ovaries, secondary follicles in 21 and 30
dpp ovaries) was similar in controls, F1 and F2 animals
(Supplementary Fig. 2a). Expression of FOXL2
45and AMH
46,
two granulosa cell markers, and of COUPTFII, a theca and
interstitial cell marker
47, was comparable in primary and
secondary follicles of 8 and 14 dpp F1 and F2 and control ovaries
(Fig.
3b, c; Supplementary Fig. 2b). Conversely, more PFs were
present in 8 and 14 dpp F1 and F2 ovaries than in controls
(Fig.
3b–d), whereas the opposite was true for primary follicles at
8 dpp and for secondary follicles at 14 dpp (Fig.
3d). Also, the
oocyte diameter in PFs was significantly higher in F1 and F2
ovaries than in controls (Fig.
3e), suggesting increased oocyte
activation. Meiosis I prophase was correctly achieved because
SYCP3 staining
48confirmed that 8 dpp oocytes were blocked at
the diplotene/dictyate stage (Fig.
3f). However, the apoptosis rate
(TUNEL staining) within primary and secondary follicles was
significantly higher in 14 and 21 dpp (but not in 8 and 30 dpp) F1
and F2 ovaries compared with controls (Fig.
3g, h). Moreover,
FoxL2 and Amh expression was significantly increased in 14 dpp
(FoxL2) and in 8 and 14 dpp (Amh) F1 ovaries compared with
controls, whereas Amh expression was decreased in 21dpp F1
ovaries (Fig.
3i). Moreover, Vasa was upregulated in 8
dpp-exposed ovaries, in agreement with their higher number of
oocytes at this stage (Fig.
3j). Accordingly, the expression of
folliculogenesis-specific basic helix–loop–helix (Figla) and
sper-matogenesis and oogenesis bHLH transcription factor 1 (Sohlh1),
two genes implicated in PF formation
49,50, was significantly
increased in F1 ovaries (8 dpp) compared with controls (Fig.
3j).
Expression of the genes encoding KIT ligand (Kitlg), oogenesis
homeobox protein NOBOX (Nobox) and growth differentiation
factor 9 (Gdf9), which are critical for the formation of primary
follicles
27, was slightly but significantly increased in F1 ovaries
compared with controls (8dpp) (Fig.
3j). These results suggest an
increase of the PF pool size and of oocyte activation in 8 dpp F1
and F2 ovaries. Concomitantly, the increased apoptosis rate and
Amh expression, which is known to inhibit follicle activation
51,
might explain the lower number of primary and secondary
follicles in 8 and 14 dpp F1 and F2 ovaries.
Altered activation of the AKT/FOXO3 pathway in F1 postnatal
ovaries. We then analysed the expression of the PI3K/AKT/
FOXO3 pathway that is critical for PF pool maintenance
29,52.
Expression of the genes encoding phosphatase and tensin
homologue deleted on chromosome 10 (Pten)
53, mammalian
target of rapamycin complex 1 (mTorC1)
54and LIM homeobox
protein (Lhx8)
55, three major repressors of oocyte activation,
was significantly increased in 8 dpp F1 ovaries compared
with controls (Fig.
4a). Expression of the genes encoding
phosphatidylinositol-dependent kinase 1 (Pdk1) and Akt kinases,
that activate this pathway, as well as of forkhead transcription
factor FoxO3, an effector of this pathway and a specific AKT
substrate, was only slightly increased in 8 dpp F1 ovaries (Fig.
4a).
AKT phosphorylation analysis by western blotting in 8 dpp
control and F1 ovaries showed a significant decrease by 35% of
the phosphorylated AKT/total AKT ratio in F1 ovaries compared
with controls (mean of 0.161 vs. 0.103), indicating reduced AKT
activation (Fig.
4b; Supplementary Fig. 3). Consequently, FOXO3
nuclear expression was significantly increased in 8 dpp F1
com-pared with control oocytes (11.2% of F1 oocytes and 2% of
controls), whereas FOXO3 cytoplasmic expression was
sig-nificantly reduced (3.5% of F1 oocytes and 31% of controls)
(Fig.
4c, d). These defects were observed also in 8 dpp F2 oocytes
compared with controls (nuclear FOXO3 expression: 15.5% of F2
and 2% of control oocytes; cytoplasmic FOXO3 expression: 7.7%
of F2 and 31% of control oocytes) (Fig.
4c, d). Altogether, these
results suggest that the transition from PF to primary follicles
might be hindered in the ovaries of APAP
+ IBU-exposed
ani-mals through inactivation of the AKT/FOXO3 pathway and
consequently, inhibition of FOXO3 nucleocytoplasmic
translo-cation. Moreover, these defects are transmitted to the offspring.
Subfertility in F2 females that show accelerated ovarian aging.
Then, we evaluated the fertility of 2-month-old F1 females and of
2- and 6-month-old F2 females (Fig.
3a) by mating them with
control males (F1 or F2 controls) (n
= 8, 10 and 19 for
2-month-old F1 control x F1 control, F1 x F1 control, and F2 x F2 control,
respectively, and n
= 6 and 7, for 6-month-old F2 control x F2
control and F2 x F2 control, respectively). All 2-month-old F1
and F2 females were mated within 1–2 weeks and showed the
same full-term pregnancy frequency (100%) and comparable
mean litter sizes (between 8 and 19 pups) as controls (Fig.
5a, b).
On the other hand, the litter size of 6-month-old F2 females was
significantly smaller than that of 6-month-old controls (fewer
than ten pups for
five of the seven females, 71%), whereas the
mating time was not significantly different compared with
con-trols (Fig.
5a, b). This suggests normal reproductive capacity in
2-month-old F1 and F2 females, but subfertility in 6-2-month-old F2
females.
Therefore, we collected ovaries from 2- and 6-month-old
control, F1 and F2 mice. Haematoxylin-eosin (H&E) staining
showed a similar histology of 2-month-old F1 (in utero exposed)
and control ovaries, with similar numbers of growing follicles and
CLs (Fig.
5c; Supplementary Fig. 4a–c), confirming normal sexual
maturity in both groups. Conversely, 2-month-old F2 ovaries
contained significant higher numbers of follicles and CLs (Fig.
5c;
Supplementary Fig. 4a–c). Moreover, stimulation with human
chorionic gonadotropin (hCG) to induce follicle growth and
ovulation, increased the number of CLs in 2-month-old control
and F1 ovaries, but not in 2-month-old F2 ovaries (Fig.
5c–e). In
6-month-old F2 ovaries, CL number also was strongly increased
(Fig.
5f), although the number of follicles remained similar as in
controls (Fig.
5f; Supplementary Fig. 4a–c). The percentage of
atretic follicles (pre-antral or antral follicles) was significantly
higher in 2- and 6-month-old F2 ovaries than in their respective
controls (Supplementary Fig. 4d). Moreover, at both ages,
expression of Amh, a marker of the follicle reserve
51, was
significantly lower in F1 and F2 ovaries than in their respective
controls (Fig.
5g). This suggests that the enhanced PF formation
and the impaired transition from PF to primary follicles in
early postnatal ovaries progressively lead to a decrease of the
ovarian reserve between 2- and 6-month of age. This accelerated
ovarian aging
35might explain the subfertility of 6-month-old F2
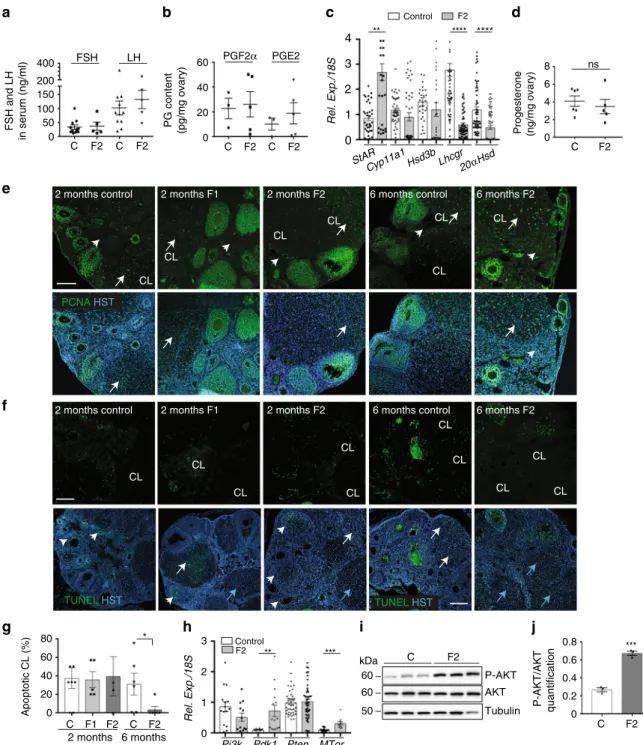
Luteolysis is impaired in F2 females. In the 6-month-old F2
group, CL number was significantly higher than in controls
(Fig.
5f; Supplementary Fig. 4c). This suggests that follicle
recruitment was increased or that CLs from the previous follicular
cycles did not regress. The level of FSH and LH secretion in
the serum (Fig.
6a) was not significantly different between F2
and
control
animals,
suggesting
an
intact
regulated
hypothalamic–pituitary axis. Normally, CL functional and
structural regression is triggered by PGF
2αthat inhibits
LH-stimulated steroidogenesis and progesterone secretion and
sti-mulates luteal cells apoptosis
56,57. During human CL maturation
and regression, the main PGs produced in luteal tissue changes
from the luteotrophic PGE
2to the luteolytic PGF
2α58. PGE
2and
PGF
2αlevels were comparable in F2 and control ovaries (Fig.
6b).
Conversely, the gene encoding steroidogenic acute regulatory
protein (Star) was significantly upregulated, whereas the genes
encoding luteinizing hormone/chroriogonadotropin receptor
(Lhcgr) and aldo-keto reductase family 1, member C18 or
20α-hydroxysteroid dehydrogenase (20αHsd or Akr1c18), the major
progesterone degradation enzyme
30, were strongly downregulated
(Fig.
6c). Expression of the genes encoding cholesterol side-chain
cleavage enzyme (Cyp11a1) and 3β-hydroxysteroid
dehy-drogenase (Hsd3b) was not modified (Fig.
6c). However,
pro-gesterone production was similar in 6-month-old control and F2
d
14dpp 8dpp C F1 F2 C F1 F2 C F1 F2 0 20 40 60 80 100 0 20 80 60 40% follicles/total follicules per section
Primary Primordial Secondary *** ** ** * *** ** * * FOXL2 VASA
b
0 10 20 30 40 50Apoptotic follicles %/ total follicles C F1 F2 C F1 F2 C F1 F2
14dpp 21dpp 30dpp 21dpp
e
g
* * * * 14dpp 0 5 10 15 Oocytes diameter (μ m) C F1 F2 C F1 F2 8dpp 14dpph
VASA SYCP3 Control F1 F2f
TUNEL HST 0 3 1 2ControlVasaFiglaSohlh1KitlgGdf9Bmp15Nobox ** * * * 6 8 **
i
** 0 0.5 1 1.5 2 Rel. Exp./18S/controlControl FoxL2 Amh
8 14 21 8 14 21dpp **** *** ** ****
j
a
Control F1 F2 Control F1 F2 Control F1 F2 Control F1 F2c
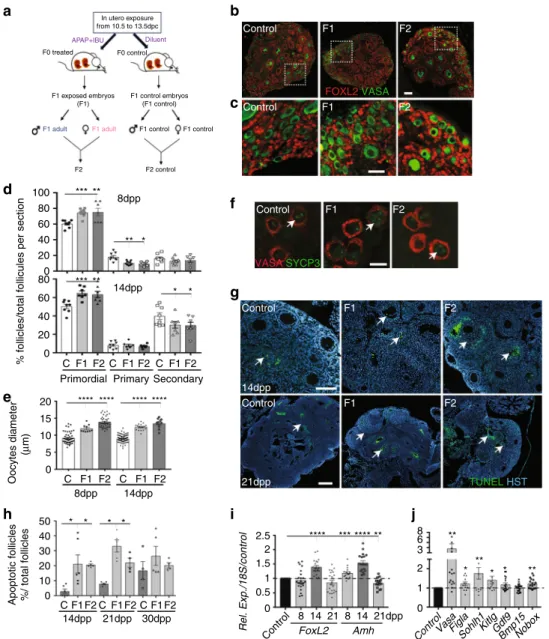
* 20 **** **** ******** 2.5 In utero exposure from 10.5 to 13.5dpc F0 treated APAP+IBUF1 adult F1 adult F1 control F1 control
F2 control F2 Diluent F0 control F1 exposed embryos (F1) F1 control embryos (F1 control)
Fig. 3 Primordial follicle formation and maturation are impaired in postnatal F1 and F2 ovaries. a Schematic representation of the experimental design to obtain F1 and F2 animals after in utero exposure to APAP+ IBU. b, c Representative immunofluorescence images of 8 dpp control, F1 and F2 ovaries stained for FOXL2 (red) and VASA (green) (scale bars= 50 μm). Enlarged panels (c) highlight details of the ovarian cortex from panels in b. d Primordial, primary and secondary follicles per section of 8 dpp and 14 dpp control (C), F1 and F2 ovaries. The results are the percentage of primordial, primary and secondary follicles among all follicles (n= 16–20 different ovaries per data point). e Oocyte diameter is increased in 8 dpp and 14 dpp F1 and F2 ovaries (n = 20 ovaries and 200 oocytes per data point); ***P < 0.005, ****P < 0.001.f SYCP3 (green) and VASA (red) signal in 8 dpp control, F1 and F2 ovary sections. White arrows indicated germ cells in the diplotene/dictyate stage. Scale bar= 10 μm. g Representative immunofluorescence images of TUNEL assays in 14 and 21 dpp ovaries. White arrows indicate apoptotic follicles. Scale bars= 60 μm. h Percentage of atretic follicles relative to all follicles in 14 dpp, 21 dpp and 30 dpp control, F1 and F2 ovaries; *P < 0.05.i, j Expression levels of FoxL2 and Amh in 8, 14 and 21 dpp control and F1 ovaries (i) and of germ cell/ somatic genes in 8 dpp control and F1 ovaries (j). The data are the ratio between F1 and control expression (h). *P < 0.05, **P < 0.01, ***P < 0.005, ****P < 0.001
ovaries (Fig.
6d), suggesting that functional luteolysis was not
impaired.
Histology analysis of new and old CL in F2 ovaries using the
method described by Taketa et al.
59showed that 97% of CLs in F2
ovaries were old CLs (3% of new CLs), whereas in control ovaries,
51% of CLs were old and 49% were new CLs (Supplementary
Fig. 4e). Analysis of CL proliferation/apoptosis using an antibody
against proliferating cell nuclear antigen (PCNA) and the TUNEL
assay showed that in 2-month-old ovaries, PCNA was localised in
granulosa and theca cells of all follicle types in the control, F1 and
F2 groups (Fig.
6e). Differentiated luteal cells were
PCNA-positive in 50% of all CLs, and most CLs showed TUNEL-PCNA-positive
FOXO3 VASA
Control F1 F2
b
a
Control Pi3k Pdk1 Pten Akt1 Akt2 mTorFoxO3aFoxO1Lhx8 0 1 2 Rel. Exp./18S/control ** * *** ** **** **** P-AKT AKT **** 1.5 0.5 1 Tubulin
c
C F1 0 P-AKT/AKTd
** **** C F1 F2 0 20 40 60 80 100 Cyto Nuclear Cyto+nucl * * * * ***FOXO3 localisation (%/total oocytes)
* C F1 60 kDa 60 50 3 ns
Fig. 4 Inhibition of the AKT-FOXO3 pathway in oocytes after in utero exposure to APAP+ IBU. a Relative gene expression of PI3K/AKT pathway components in 8 dpp control and F1 ovaries.b Representative immunoblots of the total AKT, phosphorylated AKT (P-AKT) and tubulin expression in 8 dpp control and F1 protein extracts (n= 2 pools of two ovaries) and quantification of the P-AKT/AKT ratio; ****P < 0.001. c Representative
immunofluorescence images of 8 dpp control, F1 and F2 ovaries stained for FOXO3 (red) and VASA (green) (scale bar = 15 μm). d Quantification of nuclear, cytoplasmic and nuclear/cytoplasmic FOXO3 expression in oocytes of control, F1 and F2 ovaries (8 dpp) (n= 260, 330 and 500 oocytes, respectively). The data are expressed as the percentage of all oocytes and as the mean ± SEMs; *P < 0.05, **P < 0.01, ***P < 0.005, ****P < 0.001
0 5 10 15 20
Mating time (weeks)
0 1 2 3 Litter size 0 5 10 15 CL number/section **** ** – + – + – + hCG * 6 months Control F2
d
c
b
a
f
Amh 5 10 Rel. Exp./18S 0 ** * ****g
e
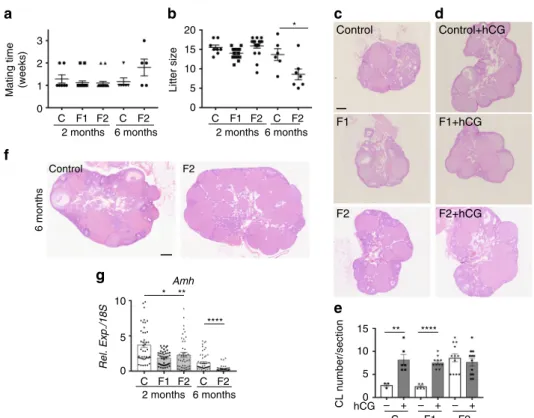
C F1 F2 C F2 2 months 6 months C F1 F2 Control Control+hCG F2 F2+hCG 2 months 6 months C F1 F2 C F2 2 months 6 months F1 F1+hCG C F1 F2 C F2Fig. 5 F2 females show accelerated ovarian aging and are subfertile. a, b Fertility of 2-month- and 6-month-old females was determined in terms of time to mating (a) and litter size (b) (n= 6–19 for each data point) *P < 0.05. c, d, f Histological analysis of 2-month-old ovaries stimulated (d) or not (c) by hCG and of 6-month-old ovaries (f). All sections were stained with haematoxylin and eosin. Scale bars= 200 μm. e Corpus luteum (CL) number measured in three representative sections of each ovary (n= 10 ovaries). **P < 0.01, ***P < 0.005 (hCG treated vs controls). g Amh expression levels in 2-month- and 6-month-old F1 and F2 ovaries, compared with their respective controls. *P < 0.05, **P < 0.01, ****P < 0.001
cells (Fig.
6e, f), suggesting that structural luteolysis proceeded
normally in 2-month-old ovaries. In contrast, in 6-month-old F2
ovaries, we could not detect any TUNEL-positive cell (Fig.
6f, g),
and 100% of luteal and stromal cells were PCNA-positive,
differently from controls (Fig.
6e). As AKT-PDK1 pathway
activation promotes cell proliferation and cell survival
60,
particularly in ovary
29,61, we analysed its status in 6-month-old
ovaries. We found that Pdk1 and Mtor were significantly
Pi3k Pdk1 Pten MTor
f
*** ** 0 1 2 0 20 40 60 80 * Apoptotic CL (%) C F1 F2 C F2 2 months 6 monthsj
i
h
g
CL CL CL CL CL TUNEL HST P-AKT AKT C F2 Control F2 P-AKT/AKT quantification 0 0.2 0.4 0.6 0.8 *** C F2 Tubulin Rel. Exp./18S PGF2α PGE2 0 PG content (pg/mg ovary)a
C F2d
c
b
StAR Cyp11a1Hsd3bLhcgr Rel. Exp./18S 20αHsd 0 1 2 3 4 0 2 8 6 4 Progesterone (ng/mg ovary) **** **** ** Control F2 ns 20 40 60 FSH and LH in serum (ng/ml) FSH LH 0 50 100 200 150 400 C F2 C F2 C F2 C F2 PCNA HST CL CL CL CL CL CL CLe
TUNEL HST CL CL CL CL CL 6 months F22 months F2 6 months control
2 months F1 2 months control
6 months control 6 months F2
2 months control 2 months F1 2 months F2
60 kDa
60 50 3
Fig. 6 Luteolysis is impaired in 6-month-old F2 ovaries. a FSH and LH secretion in serum samples from 6-month-old ovaries measured by ELISA (n= 11 control (C) and n= 5 F2 ovaries). b PGF2αand PGE2production in 6-month-old ovaries measured by ELISA (n= 3 control (C) and n = 5 F2 ovaries). c Relative expression levels of the steroidogenic genes StAR, Cyp11a1, Hsd3β, Lhcgr and 20αHsd in 6-month-old F2 ovaries normalised to 18S; **P < 0.01, ****P < 0.001.d Progesterone secretion was measured by LC/MS in 6-month-old control (n= 6) and F2 (n = 5) ovaries; ns not significant. e Proliferation in 2-month-old F1 and F2 and in 6-month-old F2 ovaries was assessed by immunofluorescence using anti-PCNA (green) antibody and Hoechst (HST, blue); CL= corpus luteum; white arrows highlight proliferating CLs and arrowheads indicated stromal cells. f, g Apoptotic cells in 2-month-old F1 and F2 and in 6-month-old F2 ovaries were visualised by TUNEL assay (green) and nuclear staining with Hoechst (HST, blue) (f) and apoptotic corpora lutea (CL) were counted (g); the data are presented as the percentage of apoptotic CLs. *P < 0.05 (g). White and blue arrows indicate apoptotic and non-apoptotic CLs, respectively, and arrowheads indicate growing follicles (f). Scale bars= 300 μm. h–j The AKT-PDK1 pathway is activated in 6-month-old F2 ovaries compared with controls. Relative expression levels of Pi3k, Pdk1, Pten and Mtor normalised to 18S, in control and F2 ovaries; **P < 0.01, ***P < 0.005 (h). Representative immunoblots of total AKT, phosphorylated AKT (P-AKT) and tubulin (i) show that the AKT pathway is activated in F2 ovaries (n= 3), as indicated by the increased P-AKT/AKT ratio compared with control (n= 4); ***P < 0.005 (j)
upregulated in 6-month-old F2 ovaries compared with control
(Fig.
6h). Western blotting with anti-AKT and -phosphorylated
AKT antibodies revealed that the AKT pathway was significantly
activated in the F2 group compared with control (Fig.
6i, j;
Supplementary Fig. 5), suggesting that, in addition to the lack of
apoptosis, increased AKT-mediated cell survival also might
contribute to inhibiting CL structural regression in 6-month-old
F2 ovaries.
Discussion
In this study, we demonstrated that APAP
+ IBU exposure
dur-ing the developmental period of sex determination produces
intergenerational effects on female reproductive development. We
analysed for the
first time the molecular mechanisms involved in
these effects, highlighting that the in utero exposure to this drug
combination modifies activation of the AKT signalling pathway
in postnatal and adult ovaries. Upon in utero APAP
+ IBU
exposure, germ cell proliferation and meiosis entry were affected
in embryonic ovaries, leading to abnormal PF formation and
activation in postnatal ovaries. Consequently, the ovarian reserve
decreased in exposed (F1) adult animals and their offspring (F2),
leading to subfertility of 6-month-old F2 animals that showed
accelerated ovarian aging and abnormal CL persistence. These
results raise the question of whether in utero exposure to APAP
+ IBU could harm the reproductive lifespan also in women.
Nearly 4% of pregnant women use a combination of APAP and
NSAIDs. This drug combination was associated with shorter
anogenital distance in the exposed male offspring
2. Also, APAP
and IBU are amongst the drugs most frequently present in the
natural environment, including surface and groundwater in many
countries, and they are not eliminated during the wastewater
treatment process
62,63. This suggests an uncontrolled and
con-tinuous sub-therapeutic dose exposure of the general population,
including pregnant women and young pre-pubertal individuals.
We found that exposure of mouse embryos to therapeutic
doses of APAP or IBU alone did not affect embryonic germ cells,
in contrast to others studies performed either using sub-toxic
doses of APAP
15in rats or lower doses for longer time in mice
14,
or using ex vivo cultures of fetal human ovaries
16,17. Conversely,
exposure to the APAP
+ IBU combination during early
embry-ogenesis led to increased proliferation of embryonic germ cells,
delayed meiosis initiation and progression, and altered
produc-tion of the PGs PGD
2, PGE
2and PGI
2. This suggests that these
PGs play essential roles in fetal female germ cell development.
The APAP
+ IBU combination was administered at 10.5–13.5
dpc, when female PGCs have reached the genital ridge and still
divide, and when DNA methylation was erased
64at meiosis
initiation. The decreased expression of Stra8 and of the
plur-ipotency genes Pouf5 (Oct4) and Dppa4 could disturb the onset of
meiotic prophase I at 12.5 dpp that normally proceeds in female
PGCs
23. The increased cell proliferation and putative
modifica-tions of epigenetic marks induced by in utero APAP
+ IBU
exposure might affect directly or indirectly germ cell
develop-ment. Deposition of the histone mark H3K4me3 on meiotic gene
promoters, which normally favours their expression and is
essential for meiosis timing, could be disturbed
65. For instance,
Stra8 expression can be influenced by changes in DNA
methy-lation of its promoter upon exposure to various endocrine
dis-ruptors
66. Additional studies are needed to investigate the
epigenetic mechanisms modified by APAP–IBU exposure.
Con-comitantly, some genes involved in meiosis I prophase
progres-sion that were shown to be targets of STRA8
40,67were
upregulated. Among these genes, Meioc encoding an
RNA-binding protein might be involved in regulating meiotic cell
cycle
68and meiotic recombination
69transcripts, via
post-transcriptional mechanisms, even in presence of lower levels of
Stra8 expression. However, despite the variations in gene
expression, oocytes can complete meiotic prophase in postnatal
exposed ovaries.
As completion of the
first meiotic prophase is tightly
corre-lated with the initiation of follicular assembly
70, oocytes
arrested at the diplotene/dictyate stage are competent to direct
follicle assembly in APAP
+ IBU-exposed ovaries. After birth,
germline cysts breakdown into individual oocytes that become
surrounded by somatic pre-granulosa cells to form PFs. During
this process, only a third of the initial oocytes survives
24. The
increased number of germ cells in cysts in exposed 17.5 dpc
ovaries led to an increase of the PF pool in 8dpp F1 (exposed)
and also in F2 ovaries. In utero APAP–IBU exposure could
disturb the regulation of the cell survival and/or programmed
cell death pathways, leading to the loss of some oocytes during
the
first days after birth
24,25, as well as to the expression of
Sohlh1 and Figla that activate PF formation
49,50. These initial
steps in PF formation are critical because they are needed to
ensure the regular follicular development throughout the
reproductive life
71. Differently from our results, a previous
study showed that exposure to APAP alone between 7 and 13.5
dpc induced a reduction of the PF number, leading to decreased
fertility in 6 and 10-month-old mice
14. Oocyte and PF
activa-tion prior to selecactiva-tion in the growing follicle pool
26also were
enhanced upon in utero exposure to APAP
+ IBU. We also
found that increased apoptosis in growing follicles and
inhibi-tion of the AKT signalling pathway (decreased phosphorylated
AKT/AKT ratio) upon APAP
+ IBU exposure led to inhibition
of FOXO3 nucleocytoplasmic translocation. Consequently, the
number of primary and secondary follicles was reduced in the
follicle pool. In oocytes, the PI3K/AKT/FOXO3 signalling
cascade is the main pathway that regulates PF activation and
survival
29. Deletion of genes encoding PTEN
53or signalling
molecules downstream of PI3K, such as PDK1
72or FOXO3A
73,
in mouse oocytes leads to abnormal PF development and POI
in adult ovaries. The increased PF pool followed by higher
apoptosis in postnatal F1 (directly exposed) and F2 ovaries
suggests an intergenerational transmission of these effects.
Finally, we observed that the ovarian reserve decreased between
2 and 6 months of age and led to subfertility in 6-month-old F2
females. Ovarian aging or menopause occurs when the PF pool is
exhausted, and abnormal PF development causes POI in adult
ovaries
35. The significant increase of CL number in 6-month-old
F2 ovaries might be the consequence of the AKT pathway
acti-vation leading to increased luteal cell proliferation and
survival
29,61, rather than being due to a higher number of
ovu-lations because FSH and LH secretion was normal. This, together
with the lack of luteal cell apoptosis, led to the structural
main-tenance of CLs that should normally have regressed in the
absence of pregnancy to allow the onset of a new cycle
30. The
maintenance of progesterone secretion in F2 could result from an
alteration of CL function that was compensated by the increased
number of CLs and the strong downregulation of the 20αHsd
gene, which encodes a protein to catabolize progesterone.
Moreover, increased expression or activity of other enzymes
involved in progesterone metabolism, such as 5α-reductases,
17α-hydroxylase or 3α-hydroxysteroid dehydrogenase
74,75in F2
ovaries, might explain why progesterone production was not
increased in F2 ovaries compared with controls, although they
contained a larger number of CLs. CL persistence was probably
due to the inhibition of the activity of PGF
2α, the major
luteo-trophic factor that was normally produced. Its inhibition could
also promote AKT activation in F2 ovaries
76. Moreover,
proges-terone, which is the main steroid produced by the CL
30, plays an
the CL from programmed cell death
77. Consequently, it may also
contribute to CL maintenance in F2 ovaries.
In conclusion, we showed that in the mouse, exposure to the
widely used APAP
+ IBU combination has an important impact
on germ cell development in embryonic ovary, and on their
maturation and folliculogenesis in postnatal and adult ovaries and
can also induce inheritable effects. These effects lead to
sub-fertility in 6-month-old F2 animals that show an accelerated
ovarian aging. Additional studies are now required to identify the
modifications of the primordial germ cell epigenome associated
with such intergenerational effects, as shown after exposure to
various endocrine disruptors
78. As the global dynamics of the
main epigenetic mechanisms are conserved between mouse and
humans
79, this mouse model of in utero NSAID/APAP exposure
provides a valuable tool for investigating their effects, and also
those of other drugs and environmental chemicals, on human
female reproduction and fertility.
Methods
Animals and experimental protocols. For all experiments, wild-type pregnant CD1 females (5.5 dpc of pregnancy) were obtained from Janvier Laboratories (Janvier Labs, Le Genest-Saint-Isle, France) and maintained in the animal care facility for 5 days prior to treatment. Animals were kept and bred at the IGH animal care facility in controlled environmental conditions. All animal experiments were conducted according to procedures approved by the Réseau des Animaleries de Montpellier (RAM) (agreement number 34–366 for B.B.-B.) and by the Regional Ethics Committee. APAP and IBU stock solutions (500 and 219 mM, respectively) (MilliporeSigma, Burlington, MA, USA) were prepared in ethanol and 10-fold diluted with PBS before oral administration between 10.5 and 13.5 dpc. For experiments with single drugs, 30 mg/kg APAP, 15 mg/kg IBU11,14or 9.7% ethanol
(control) were administered daily twice (150μl by gavage, 6 h apart) (n = 6 inde-pendent experiments with two pregnant females for each experiment and condi-tion; thus, n= 12 F0 females in total per group). For experiments with two drugs [30 mg/kg/d APAP+ 15 mg/kg/d IBU or ethanol as control], the same doses of each drug were alternately administered every 3 h (four times, 150μl by gavage) (n= 4 independent experiments with two pregnant females for each experiment and condition; thus n= 8 F0 females in total per group). These experiments generated the F1 (exposed) embryos/pups and the F1 animals. To analyse the intergenerational effects of APAP+ IBU exposure, F2 animals were generated by breeding 2-month-old F1 males and F1 females (n= 15 matings) whereas F2 controls were generated from F1 male and F1 female controls (n= 7 matings) (Fig.3a); neither siblings nor cousin animals were crossed to avoid inbreeding artifacts.
Ovaries from 13.5 dpc-17.5 dpc F1 embryos, 8-14-21-30 dpp F1 and F2 pups and 2- and 6-month-old F1 and F2 mice were collected. For each embryo/pup/ animal, one ovary wasfixed in 4% paraformaldehyde (PFA)/phosphate-buffered saline (PBS) and processed for paraffin inclusion, whereas the second ovary was immediately frozen at−80 °C for RNA extraction. For the analysis, n = 10–16 F1 embryonic gonads from two gestated females and n= 4–10 postnatal gonads were pooled from two litters, for each independent experiment (n= 6 with single drugs and n= 4 with double drugs). F1 and F2 adult ovaries (n = 6 to 10) from different litters were processed independently.
EdU (5-ethynyl-2-deoxyuridine) (2.5 mM/150μl) was intraperitoneally injected in F0 pregnant females 2 h before killing, and EdU-positive cells were detected using the Click-iT EdU Assay (Thermo Fisher Scientific, Waltham, MA, USA), according to the manufacturer’s instruction. Female mice (8 weeks) were treated with 10 IU of human chorionic gonadotropin (hCG) (Sigma-Aldrich), a gonadotropin with both FSH- and LH-like properties that promotes follicular growth, ovulation and luteogenesis80. Ovaries were dissected 48 h later for
histological analysis.
Histology, immunofluorescence, TUNEL and western blot analysis. Mesogo-nads from embryos, and postnatal and adult ovaries from F1 and F2 animals were collected,fixed in 4% PFA/PBS for 24 h, embedded in paraffin, sectioned (4 μm sections) and processed for histology or immunofluorescence. Sections were stained with H&E using standard protocols. Immunofluorescence was performed as previously described11,81and detailed in Supplementary Table 3 with the
information about the antibodies used.
Apoptosis in follicles and CLs was determined by TUNEL assay with the DeadEndfluorometric TUNEL kit (Promega). Individual sections (n = 1 for follicles; n= 3 for CLs (40 μm apart)) of ovaries (n = 3 postnatal ovaries and n = 6 adult ovaries; n= 4 experiments) were analysed. Briefly, deparaffinated and rehydrated sections were incubated with proteinase K for 4 min, andfixed again with 4% PFA/PBS. Fragmented DNA of apoptotic cells was detected by incorporation offluorescein-12-dUTP at the 3′-OH DNA ends using the terminal deoxynucleotidyl transferase, recombinant, enzyme (rTdT) at 37 °C for 1 h. After
stopping the reaction by immersion in 2× SSC solution, sections were rinsed in PBS and stained with Hoescht (HST). Thefluorescein-labelled DNA and HST staining were visualised byfluorescence microscopy; the results were expressed in percentage of TUNEL-positive follicles or CLs among total number of follicles or CLs per section.
Protein extracts from 8 dpp and 6-month-old ovaries were prepared and analysed by western blotting (SDS PAGE electrophoresis), as previously described82. Protein contents were quantified using the Image Lab software 5.1
(Biorad).
Analysis of meiotic prophase by chromosome spreads. Meiotic spreads on oocytes from F1 13.5 dpc (preleptotene/leptotene oocytes) and F1 17.5 dpc (zygotene/pachytene) ovaries were prepared as described in ref.83.
Immunos-taining was performed using a milk-based blocking buffer (5% milk, 5% donkey serum in 1 × PBS). Spreads were incubated with the guinea pig anti-SYCP384,
mouse monoclonal anti-phospho-H2AX (Upstate) and rabbit anti-SYCP1 primary antibodies (Supplementary Table 3) at room temperature overnight. Anti-guinea pig Alexa Fluor 488, anti-mouse Alexa Fluor 647 and anti-rabbit Alexa Fluor 555 secondary antibodies (Molecular Probes) were added at 37 °C for 1 h. Nuclei were stained with DAPI (4′-6-Diamidino-2-phenylindole, 2 μg/ml) during the final washing step.
Meiotic prophase I staging of mouse oocytes was performed using these SYCP3, SYCP1 andγH2AX markers85,86and between 85 and 155 oocytes were analysed in
each ovary (n= 9 for control and APAP + IBU conditions, from n = 3 litters). For F1 13.5 dpc oocytes, the preleptotene (appearance of heterochromatin patches in the nucleus), early/mid leptotene (small stretches of SYCP3 indicating onset of axial element formation and increase in the number and intensity of γH2AX-positive domains indicating DNA double-strand break formation) and late leptotene (fully formed axial elements stained by SYCP3 but lacking SYCP1, indicating absence of synapsis) stages were defined. For F1 17.5 dpc oocytes, four stages were defined: leptotene, early/mid zygotene (synapsis has started and short SYCP1 stained structures are visible), late zygotene (the meiosis-specific chromosome axes visualised by SYCP3 are at 50% associated in the synaptonemal complexes (SC) visualised by SYCP1) and pachytene (100% of the SCs are synapsed and are stained by SYCP3 and SYCP1, indicating full synapsis). Quantification of cells, cysts, oocytes, follicles and corpora lutea. In embryonic gonads, proliferative FOXL2+ granulosa cells and VASA + germ cells were quantified by counting proliferating EdU + cells amongst all FOXL2 + or all VASA+ cells. For each data point with single drug, n = 20 to 25 F1 embryonic ovaries (from n= 12 litters) were analysed and for each data point with double drugs, n= 16 to 20 F1 embryonic ovaries (from n = 8 litters) were analysed (between 400 and 2100 cells were counted).
Meiosis prophase I establishment was analysed by immunofluorescence analysis ofγH2AX, SYCP3 and DMRT1 expression, and meiotic cell number was evaluated by countingγH2AX-, SYCP3- and DMRT1-positive cells among all VASA + cells in F1 13.5 and 17.5 dpc gonads. For each data point, n= 16 to 24 gonads (400–900 germ cells) were analysed. The number of oocytes in cysts in F1 17.5 dpc embryonic gonads was determined on sections immunostained with anti-VASA and anti-laminin (that labelled the cyst basal membrane) antibodies. One representative section of control (n= 10) and exposed (n = 12) ovaries from three litters was analysed per data point (n= 3–5 cysts counted per section).
Follicles were classified as follows: primordial follicles (oocytes surrounded by a single layer offlat granulosa cells), primary follicles (oocytes surrounded by one layer of cuboidal granulosa cells) or secondary follicles (oocytes surrounded by more than one layer of granulosa cells), according to the criteria established by Pedersen and Peters87. This analysis was performed in a double-blind manner
using the Nanozoomer Digital Pathology (NDPview2) software (Hamamatsu). Only oocytes with a visible nucleus were counted. Follicles and corpora lutea were counted on three H&E-stained sections for each ovary (sections separated by 20μm or 40μm for CLs count). At least six adult ovaries (n = 6 to 10 for F1 and F2 ovaries) were analysed and n= 16 to 20 F1 and F2 postnatal ovaries from different litters were analysed, per data point. The results were expressed as the percentage of primordial/primary/secondary follicles relative to the total number of follicles and per histological section.
Oocytes diameter in primordial follicles of 8 and 14 dpp postnatal ovaries (PFs were visualised by the presence of round oocytes surrounded by one layer offlat granulosa cells) was determined on H&E-stained sections using the
NDPview2 software. Each data point was the analysis of 200 oocytes (from three sections separated by 20μm of n = 20 different ovaries per condition).
Concomitantly, the different CL morphologies were evaluated on H&E-stained sections of 6-month-old control and F2 ovaries. In contrast with new corpora lutea (new CL) that display strong nuclear staining by HE, corpora lutea formed in previous cycles (old CL) showed cells with heterogeneous shapes and sizes with increasing cytoplasmic area59. The numbers of new CLs and old CLs per section
were calculated by averaging their number in three sections of each ovary (n= 6 per data point).
TUNEL-positive follicles were counted on one section of postnatal ovaries (n= 12) for each condition. TUNEL-positive CLs were counted on three sections (40μm apart) for each F1 and F2 ovary (n = 6 for each type). The data were
presented as the percentage of apoptotic follicles/CLs relative to the total number of follicles/CLs per section.
RNA isolation, RT-qPCR and RNA-seq analysis. For the gene expression ana-lysis, n= 10–16 F1 embryonic gonads from two gestated females and n = 4–10 postnatal gonads were pooled from two litters, for each independent experiment (n= 4 with double drugs) to have four biological replicates. Specifically, embryonic and postnatal ovary RNA was extracted from the control and APAP+ IBU-exposed pools (n= 4 control and n = 4 APAP + IBU). F1 and F2 adult ovaries were processed independently (n= 6–10 per condition from different litters). RNA was extracted from gonads using TRIZOL (Thermo Fisher Scientific) and pro-cessed as described previously11. RNA quality was controlled with the Agilent 2100
Bioanalyzer system. Real-time RT-qPCR was performed as previously described81
using the primers listed in Supplementary Table 4 and Rps29 or 18S as the reference gene for data normalisation in embryonic gonads88and postnatal/adult
samples, respectively.
For RNA-seq experiments, the total RNAs (three out of the four pools) from embryonic gonads (n= 3 control and n = 3 APAP + IBU) were independently processed to provide replicates. RNA-seq libraries were generated from 300 ng of the total RNA using the TruSeq Stranded mRNA LT Sample Preparation Kit (Illumina, San Diego, CA), according to the manufacturer’s instructions. Briefly, following purification with oligo-dT attached to magnetic beads, mRNA was fragmented using divalent cations at 94 °C for 2 min. Cleaved RNA fragments were copied intofirst-strand cDNA using reverse transcriptase and random primers. Strand specificity was achieved by replacing dTTP with dUTP during the second-strand cDNA synthesis using DNA Polymerase I and RNase H. Following the addition of a single‘A’ base and subsequent ligation of the adapter on double-stranded cDNA fragments, products were purified and enriched by PCR (98 °C for 30 s; [98 °C for 10 s, 60 °C for 30 s, 72 °C for 30 s] × 12 cycles; 72 °C for 5 min) to create the cDNA libraries. Surplus PCR primers were further removed by purification using AMPure XP beads (Beckman-Coulter, Villepinte, France), and thefinal cDNA libraries were checked for quality and quantified using capillary electrophoresis (Agilent 2100 Bioanalyzer). Libraries were then sequenced on an Illumina HiSeq 4000 system using paired-end 2 × 50 bp following Illumina’s recommendations.
Image analysis and base calling were performed using RTA 2.7.3 and CASAVA 2.17.1.14. Reads were mapped onto the mm10 assembly of the mouse genome using Tophat v2.0.1489and the bowtie v2.1.0 aligner. Gene expression was
quantified using HTSeq v0.6.190, and gene annotations were from Ensembl release
86. Differential gene expression analysis was analysed using R and DESeq2 v1.6.3 Bioconductor library91.
PG, steroids and serum hormone measurements. PGD2, 15-desoxy 12, 14-PGJ2, PGE2, PGF2α, 6-keto-PGF1α(PGI2) and thromboxane (TxA2) were quantified in 13.5 dpc control and APAP+ IBU-exposed ovaries by LC-MS/MS. For this experiment, 200 control and 210 exposed ovaries were isolated from embryos of 15 controls and 15 APAP+ IBU-treated pregnant females and then pooled (n = 1 pool). Tissues were processed, and PGs were identified and quantified as previously described11. PGE2and PGF2
αin 6-month-old control and F2 ovaries were mea-sured by ELISA according to the supplier’s protocol (Cayman).
The concentration of follicle-stimulating hormone (FSH) and luteinizing hormone (LH) in serum was measured with specific EIA ELISA kit (ElabScience Biotech, E-EL-M0511 and E-EL-M0057 respectively, CliniSciences France). The mean sensitivities of these assays are 0.96 ng/ml for mouse FSH and 0.28 ng/ml for mouse LH. Briefly, blood samples collected from 6-month-old control and F2 females were allowed to clot for 60 min, followed by centrifugation at 2000 g for 20 min; serum was frozen at−80 °C until the FSH and LH assays.
Progesterone was quantified in 6-month-old control (n = 7), and F2 (n = 5) ovaries by liquid chromatography coupled to tandem mass spectrometry (LC-MS/ MS). Control and F2 ovaries were homogenised in 2 × 600μl of diethyl-ether. Homogenates were centrifuged at 20,000 g for 10 min, and supernatants were evaporated. Evaporated extracts were resuspended in 100 µl of water/acetonitrile (1/1, v/v) with 0.1% ammonia. Five microliters of D9-progesterone at 3 µg/mL were added. The sample extracts were then centrifuged at 20,000 g at 4 °C for 10 min. Finally, supernatants were transferred into new vials for analysis. Progesterone was quantified using D9-progesterone as internal standard and a linear regression with 1/X2weighing in the range from 0.0053 to 6.395 ng. Five microliters extract was
injected into the LC-MS/MS system that consist of a Waters ACQUITY UPLC® System with an Acquity UPLC BEH C18 1.7 µm, 2.1 × 50 mm column and a reversed-phase gradient over a run time of 5 min. Initial conditions consisted of mobile phase A (0.1% ammonia in water) and mobile phase B (acetonitrile) with a column temperature of 50 °C and aflow rate of 0.600 mL/min. The gradient conditions ramped from 30% B to 100% B between 0.5 and 3 min, and were maintained up to 3.5 min, ramped to 30% and maintained up to 5.0 min for re-equilibration. The MS analysis was performed on a Waters XEVO™ TQ-S Mass Spectrometer operating in positive ion electrospray MRM mode. The monitored MRM transition was m/z 315.1 > 110 and 324.019 > 113.98, for progesterone and D9-progesterone, respectively. In these conditions, the mean retention time was around 2.08 min for the two compounds.
Statistics and reproducibility. Statistical analysis was performed using GraphPad Prism 7. The Student’s t test was used to compare two groups in independent experiments and the one-way ANOVA test with the Tukey’s post hoc test for multiple comparisons (real-time quantitative RT-qPCR experiments and cell counting). A P-value < 0.05 was considered significant. For quantification of cells, follicles and oocytes, embryonic (n= 9–24) and postnatal (n = 16–20) ovaries from different litters were analysed whereas adult animals (n= 6–10 from different litters) were independently processed for each data point. Values represent the mean ± SEMs of these different ovaries. For gene expression studies, all values represent the mean ± SEM of n= 4 biological replicates and of three or more independent RT-qPCR experiments.
Reporting summary. Further information on research design is available in the Nature Research Reporting Summary linked to this article.
Data availability
RNA-sequencing data as presented in Supplementary Data 1 and Supplementary
Tables 1–3 are available at NCBI’s gene expression omnibus (GEO,http://www.ncbi.nlm.
nih.gov/geo/query/acc.cgi?acc=GSE122547) with identifier GSE122547. All other relevant data generated or analysed during this study are included in this article and Supplementary Information are available from the corresponding author upon reasonable request.
Received: 13 December 2018 Accepted: 16 July 2019
References
1. Cejvanovic, V., Jimenez-Solem, E., Poulsen, H. E. & Andersen, J. T. NSAID use during pregnancy: maternal characteristics and prescription patterns: nationwide cohort study. Scand. J. Rheumatol. 43, 424–426 (2014). 2. Lind, D. V. et al. Maternal use of mild analgesics during pregnancy associated
with reduced anogenital distance in sons: a cohort study of 1027 mother-child pairs. Hum. Reprod. 32, 223–231 (2017).
3. Kristensen, D. M. et al. Analgesic use-prevalence, biomonitoring and endocrine and reproductive effects. Nat. Rev. Endocrinol. 12, 381–393 (2016). 4. Berger, A., Dukes, E., Martin, S., Edelsberg, J. & Oster, G. Characteristics and healthcare costs of patients withfibromyalgia syndrome. Int J. Clin. Pr. 61, 1498–1508 (2007).
5. Moore, R. A., Derry, C. J., Derry, S., Straube, S. & McQuay, H. J. A conservative method of testing whether combination analgesics produce additive or synergistic effects using evidence from acute pain and migraine. Eur. J. Pain. 16, 585–591 (2012).
6. Naga Rani, M. A., Joseph, T. & Narayanan, R. Placental transfer of paracetamol. J. Indian Med. Assoc. 87, 182–183 (1989).
7. Siu, S. S., Yeung, J. H. & Lau, T. K. A study on placental transfer of diclofenac infirst trimester of human pregnancy. Hum. Reprod. 15, 2423–2425 (2000).
8. Kristensen, D. M. et al. Ibuprofen alters human testicular physiology to produce a state of compensated hypogonadism. Proc. Natl Acad. Sci. USA 115, E715–E724 (2018).
9. Hurtado-Gonzalez, P. & Mitchell, R. T. Analgesic use in pregnancy and male reproductive development. Curr. Opin. Endocrinol., Diabetes, Obes. 24, 225–232 (2017).
10. Axelstad, M. et al. EDC IMPACT: reduced sperm counts in rats exposed to human relevant mixtures of endocrine disrupters. Endocr. Connect 7, 139–148 (2018).
11. Rossitto, M. et al. Intergenerational effects on mouse sperm quality after in utero exposure to acetaminophen and ibuprofen. FASEB J. 33, 339–357 (2019).
12. Reel, J. R., Lawton, A. D. & Lamb, J. C. T. Reproductive toxicity evaluation of acetaminophen in Swiss CD-1 mice using a continuous breeding protocol. Fundam. Appl. Toxicol. 18, 233–239 (1992).
13. Johansson, H. K. et al. Perinatal exposure to mixtures of endocrine disrupting chemicals reduces female rat follicle reserves and accelerates reproductive aging. Reprod. Toxicol. 61, 186–194 (2016).
14. Holm, J. B. et al. Intrauterine exposure to paracetamol and aniline impairs female reproductive development by reducing follicle reserves and fertility. Toxicol. Sci. 150, 178–189 (2016).
15. Dean, A. et al. Analgesic exposure in pregnant rats affects fetal germ cell development with inter-generational reproductive consequences. Sci. Rep. 6, 19789 (2016).
16. Leverrier-Penna, S. et al. Ibuprofen is deleterious for the development offirst trimester human fetal ovary ex vivo. Hum. Reprod.,https://doi.org/10.1093/ humrep/dex383(2018).