HAL Id: hal-01665983
https://hal-amu.archives-ouvertes.fr/hal-01665983
Submitted on 16 May 2020
HAL is a multi-disciplinary open access
archive for the deposit and dissemination of sci-entific research documents, whether they are pub-lished or not. The documents may come from teaching and research institutions in France or abroad, or from public or private research centers.
L’archive ouverte pluridisciplinaire HAL, est destinée au dépôt et à la diffusion de documents scientifiques de niveau recherche, publiés ou non, émanant des établissements d’enseignement et de recherche français ou étrangers, des laboratoires publics ou privés.
N. Rizk, N. Ait-Mouheb, G. Bourrier, B. Molle, Nicolas Roche
To cite this version:
N. Rizk, N. Ait-Mouheb, G. Bourrier, B. Molle, Nicolas Roche. Parameters controlling chemical de-posits in micro-irrigation with treated wastewater. Journal of Water Supply: Research and Technology - AQUA, IWA Publishing, 2017, 66 (8), pp.587 - 597. �10.2166/aqua.2017.065�. �hal-01665983�
1
Parameters controlling chemical deposits in micro-irrigation with treated
wastewater
N. Rizk ab, N. Ait-Mouheb a, G. Bourrié c, B. Molle a, N. Roche b
aUMR Geau, IRSTEA, 361 rue Jean François Breton BP 5095, 34196 Montpellier, France,
bAix-Marseille Univ, CNRS, Centrale Marseille, M2P2, BP 80, 13545 Aix-en-Provence, France,
nicolas.roche@univ-amu.fr
c
INRA, UAPV, UMR Mediterranean Environment and Modelling of Agro-Hydrosystems, Domaine Saint-Paul, Site Agroparc, 222 Route de l’Aérodrome, 84914 Avignon Cedex 9, France.
Abstract
Micro-irrigation with treated wastewater has the potential to be the most efficient irrigation technique, especially in water scarce areas. Its main disadvantage is the high sensitivity of the drippers to clog. This study focused only on the chemical precipitation mechanisms. In a batch chemical process in parallel with PHREEQC software, two temperatures (22°C and 55°C), four pH (8, 8.5, 9 and 9.5) and CO2 partial pressure were tested. The aim is to analyze the quantity of
precipitates and their crystalline nature and calculate the effects of these factors on the behavior of dissolved chemical elements in treated wastewater to be able to validate and calibrate a geochemical software in order to predict chemical precipitation. The amount of precipitate increases by increasing pH and temperature. Precipitates were analyzed using thermogravimetric analysis (TGA) and X-ray diffraction (XRD). Calcium carbonate (CaCO3) in the form of calcite
was found to be the predominant precipitate. Experimental and model results showed that the saturation index (SI) of calcite was found to be the factor that most frequently affected calcite precipitation. Calcite SI is pH, temperature and CO2 partial pressure dependent. In the case of
irrigation, water equilibrium with atmospheric CO2 minimizes precipitation of calcite.
Keywords: C
alcium carbonate, chemical precipitation, micro-irrigation clogging, PHREEQC, treated wastewater reuse.Introduction
In contexts where water is scarce, using treated wastewater for irrigation can contribute significantly to integrated management of water resources. Drip irrigation is the most efficient and safest irrigation technique for the reuse of treated wastewater. The main benefits of using treated wastewater for irrigation are economic and environmental, in particular for agriculture, where the recycling of water and nutrients increases productivity while preserving groundwater resources. However, clogging is a common problem in drip irrigation. Bucks et al. (1979) defined three interlinked categories of clogging of irrigation devices: i) physical, i.e. the accumulation of particulate matter due to the presence of suspended solids; ii) chemical, due to
2
precipitation of soluble salts present at a concentration above saturation; iii) biological, due to the formation of biofilm and the growth of algae. The clogging of drippers can result in the dysfunction of the irrigation system as the uniformity of the distribution progressively decreases. Lili et al. (2016) studied the effect of saline water on dripper clogging. They found that variations in the discharge ratio and in the coefficient of uniformity of all drippers decreased with an increase in operating time. They also underlined the fact that chemical clogging is usually the result of precipitation due to reactions between the cations (Ca2+, Fe2+ and Mg2+, etc.) and anions (CO32-, HCO3- and SO42-, etc.) in the irrigation water. Several studies on
micro-irrigation systems confirmed the tendency of dripper clogging due to chemical precipitation linked to the quality of the water. Capra & Scicolone (1998) reported that an increase in the concentration of several water quality parameters, total suspended solids (TSS), total Fe, electrical conductivity (EC), and concentrations of Ca, Mn, and Mg, increased clogging. The solubility of chemical elements is controlled by variations in temperature, pressure, pH, redox potential and the relative concentrations of other substances in solution. In micro-irrigation systems, pH, temperature and partial pressure of gases are the most frequent and are interlinked in some way. Oxygen, carbon dioxide, and hydrogen sulfide gases are important in determining the solubility characteristics of water (Haman 1990). The solubility of carbon dioxide gas (CO2)
in water plays a particularly important role in the dissolution and deposition of minerals because it is closely involved in the control of pH. The solubility of CO2 depends on temperature and
pressure, both of which affect its equilibrium (Karaca & Uçan 2013). In micro-irrigation, the system works under pressure, is exposed to sun and to other factors that will raise the pH of the water. Apart from the concentration of CO2 in the water, the increase in pH can be due to
microbial degradation, inputs of fertilizer and high alkalinity (bicarbonate (HCO3-) and carbonate
(CO32-)). High alkalinity is problematic for drip-irrigation systems due to the hardness of the
water, i.e. the concentration of calcium and magnesium. The concentrations of HCO3- and CO3
2-depend on pH and CO2 partial pressure (PCO2). Relatively high concentrations of HCO3- and
CO32- in the water tend to precipitate calcium and magnesium as carbonates. In the case of high
alkalinity, hardness and pH, ions form insoluble minerals that reduce the flow rates through orifices or drippers (Bauder et al. 2014). Many researchers have investigated dripper clogging in an experimental context using treated wastewater (Karaca & Uçan 2013; Tarchitzky et al. 2013) especially concerning the development of biofilms and the deposition of particles. However few studies focused on chemical clogging but no studies have focused on the possibility of modeling salt precipitation using treated wastewater under micro-irrigation conditions. Chemical clogging is very difficult to control (Ahmad Aali et al. 2009). Preventions and treatments in general are long, expensive and may affect both the soil and the crop (Haman 1990). Alternative measures should be considered. The recommendation generally made to prevent chemical clogging is to decrease the water pH by injecting acid and temperature by irrigating at night (Ahmad Aali et al. 2009; Lili et al. 2016). Understanding the parameters that influence the solubility of minerals, ion activities and saturation states are important to prevent precipitation. The objectives of this study were thus to identify which elements precipitate and cause chemical clogging when treated
3
wastewater effluent is used, to evaluate the effect of pH, temperature and CO2 partial pressure on
chemical precipitation, and, for the first time, to use a geochemical model to quantify and qualify chemical precipitation when using treated wastewater effluent. The experiment consisted in changing the pH and temperature of the water to cause precipitation. The precipitate was then characterized by X-ray diffraction (XRD) and thermo gravimetric analysis (TGA). Experimental results validated the model. The model used in this work was PHREEQC (Parkhurst & Appelo 1999). The overall aim was to identify appropriate measures to avoid or at least to limit chemical precipitation.
Materials and Methods
Sampling and water quality
Treated wastewater was collected from the clarifier outlet of the urban wastewater treatment plant (WWTP) in Mauguio (near the city of Montpellier, southern France). The treatment plant is an activated sludge type and has a capacity of 24000 population equivalent. It meets the demographic and activity trends of the cities of Mauguio and Mudaison (Hérault, France). The full effluent analyzes was carried out one time on one sample and this was before the precipitation experiments. The physico-chemical characteristics of the effluent are listed in Table 1.
Parameters values Parameters values
pH 7.8 Sulfates (mg.L-1) 109 Conductivity (μS.cm-1 ) 1270 Fluorine (mg.L-1)) < 0.50 TDS (mg.L-1) 1241.7 Aluminium (μg.L-1) < 20 Hardness (mg.L-1)) 223 Br (mg.L-1) 0.18 Alkalinity (mg.L-1) < 20 B (mg.L-1) 0.14 Complete alkalimetric title (mg.L-1) 261 Ba (mg.L-1) < 0.05 Ammonium (mg.L-1) 0.37 Cu (mg.L-1) < 0.02 Nitrates (mg.L-1) 9.8 Fe (mg.L-1) < 0.05 Nitrites (mg.L-1) 0.17 Mn (mg.L-1) 0.03 Phosphorus (mg Ptot.L-1) 0.17 Li (mg.L-1) < 0.02 Mg (mg.L-1) 7 Pb (mg.L-1) < 0.05 Ca (mg.L-1) 133 Si (mg.L-1) 12 Na (mg.L-1) 119 Sr (mg.L-1) 0.39 Cl (mg.L-1) 171 Zn (mg.L-1) 0.03 K (mg.L-1) 18.1 COD (mg.L-1) < 30 Total TSS (mg.L-1) 5 BODn (with ATU) (mg O2.L-1) < 3.0
4
Effluents treated at the Mauguio plant fall within in the normal range of water quality recommended to avoid clogging of micro-irrigation drippers (Ayers & Westcot 1985), except for hardness and complete alkalimetric title (CAT), whose values are higher than the recommended one (Dey et al. 2007). The acceptable range of hardness is between 60 and 120 mg.L-1 and the recommended range for CAT is between 120 and 200 mg.L-1.
Independently of the work of this study, the quality of the effluent was monitored by the Mauguio station once to twice a month on a sample representing the average of many small samples for 24h. The homogeneity of the water was highlighted over three years regarding the values of pH (7.8 ± 0.2), BODn (3.2 ± 0.8 mg O2.L-1), TSS (3.7 ± 1.68 mg.L-1), total nitrogen
(4.2 ± 1.7 mg N.L-1) and total phosphorus (0.65 ± 0.54 mg P.L-1). So the date of water sampling will have no effect on the results. Calcium and CAT was measured before each precipitation experiments. Results shows that their concentration are also invariable (Ca = 136.6 ± 7.07 mg.L-1 and CAT = 240.3 ± 20.34 mg.L-1).The precipitation experiments were done in four replicates to evaluate the variability of the results. Samples were taken in February, March, April and May, 2015. The water was stored in a refrigerator at 6°C to minimize biochemical changes.
Accelerated controlled precipitation
Observing chemical precipitation in irrigation system requires time. In the laboratory, accelerated methods can be used to induce precipitation. Eight beakers were filled with one liter of pre-filtered water. Filtration at 0.45 µm is essential to eliminate all suspended solids and most of the bacteria. The experiments were conducted in an open system, meaning in equilibrium with atmospheric CO2. Temperature and pH were the only two parameters modified. Four of the eight
beakers were kept at room temperature (22°C) and the others were kept at 55°C in a thermostatic bath. Temperatures as high as 55°C can be encountered in fields in summer when the polyethylene irrigation pipes are black and are fully exposed to the sun (Gamri et al. 2016). Four pHs (8, 8.5, 9 and 9.5) were applied to study the effect of variations in pH on chemical precipitation when treated wastewater is used for irrigation. The pH values were chosen to induce precipitation without being too far from real irrigation conditions. A 0.1 M solution of sodium hydroxide (NaOH) was used to trigger precipitation. The solutions were considered stable when the pH remained unchanged for 2 h (Spanos & Koutsoukos 1998). The precipitate was collected after 24 hours. The water was filtered using a vacuum pump and glass microfiber filter paper with a 0.45 µm pore diameter (Fisherbrand). The filter paper was previously dried in the oven for 24 hours at 105°C to remove all traces of water and then weighed with a precision balance (Denver instrument S-64) (precision 0.1 mg). The same protocol was used for all four different water samples taken in February, March, April and May, 2015.
5
Modeling precipitation with PHREEQC
PHREEQC is a geochemical model that calculates equilibrium composition in a batch of water containing reactants. The objective was to predict the quality and the quantity of mineral precipitates under different environmental conditions (temperature, pH and CO2 partial pressure).
This helps define the limits of water quality and water supply that can be accepted in irrigation systems.
Two types of water supply are encountered in irrigation in general and in micro-irrigation in particular:
i) Irrigation water is pumped from a water table directly into the distribution system. The water does not come into contact with the atmosphere, so the CO2 has no
opportunity to degas into the atmosphere.
ii) Irrigation water is stored temporarily in a reservoir or pumped from a river. Water is in direct contact with the atmosphere. The partial pressure of CO2 in water with
equilibrium with the atmosphere is 10-3.5 atm. The saturation index (SI) of CO2 is
-3.5.
When treated wastewater is used for irrigation, the second case applies, but in this study we compared the two situations.
The ionic strength of the effluent produced at the Mauguio WWTP was calculated with PHREEQC to be 1.63 x 10⁻² mol.kgw-1, which is considered as a dilute solution. Activity and saturation indexes (SI) are two key thermodynamic parameters that show the distribution of elements as solid, liquid or gaseous. They were computed using the phreeqc.dat database: activity coefficients (1) were computed with Debye-Hückel equation, as ionic strength was sufficiently low (I< 0.1 M) (Bourrié et al. 2013).
𝑙𝑛𝛾𝑖 = − 𝐴 𝑧𝑖2√𝐼
1+𝐵𝑎𝑖̇ √𝐼
where γi is the activity coefficient (dimensionless), A and B are temperature dependent
coefficients, 𝑎𝑖̇ is the empirical ion-size parameter and I ionic strength (Appelo & Postma 2005). Modeling was conducted in the same way as in laboratory experiments. The concentrations of NaOH added in the experiments were the same as those added in PHREEQC but Na2O was used
instead of NaOH. Na2O thermodynamics is better known than NaOH, so for PHREEQC it is
easier and more accurate to use it. Na2O reacts with water to give sodium hydroxide according to
the following reaction:
𝑁𝑎2𝑂(𝑐𝑟)+ 𝐻2𝑂 → 2𝑁𝑎𝑂𝐻(𝑎𝑞)
So that the addition of NaOH is formally equivalent to dissolution of Na2O.
(1)
6
Results and analysis
Chemical precipitation in the laboratory
pH and temperature were increased to study the potential of treated wastewater to form precipitate. Figure 1 shows the average weight of the precipitate and the corresponding added volumes of NaOH with their standard deviations (SD) at different pH and at 22 and 55°C. The standard deviation (SD) was calculated from the four repetitions in the same conditions using four different water samples collected between February and May, 2015. The difference between the repetitions was negligible. For example, the average weight of the precipitate and the standard deviation was 140.75 ± 16.51 mg and 294.25 ± 6.98 mg respectively at pH 9.5, 22°C and pH 9, 55°C. This underlines the uniformity in the amount of precipitate obtained using the effluent of Mauguio WWTP over time.
At 22°C with a pH below or equal to 9, the weight of the precipitate was 1.3 mg. When the temperature was increased from 22°C to 55°C, precipitation occurred even at pH 8 (53.4 mg). The variation in the weight of the precipitate as a function of the pH is mainly determined by temperature. The weight increased from 53.5 mg at pH 8 to 101 mg at pH 8.5. At pH 9 and 9.5 the same quantity of precipitate was formed, whose weight was around 293 mg. It can be safely be assumed that at 55°C and from pH 9 on, all compounds precipitate. To better explain the precipitation process, XRD and TGA were used to characterize the precipitate.
Figure 1: Changes in the average weight of the precipitate and in added NaOH volume as a function of pH and temperature.
0 5 10 15 20 25 30 35 40 45 0 50 100 150 200 250 300 350 7,5 8 8,5 9 9,5 10 Vo lum e o f Na O H ( m l) Weig ht o f the prec ipi ta te (m g ) pH Average weight at 22°C Average weight at 55°C
NaOH volume for 22°C
NaOH volume for 55°C
7
Characterization of precipitate by XRD and TGA
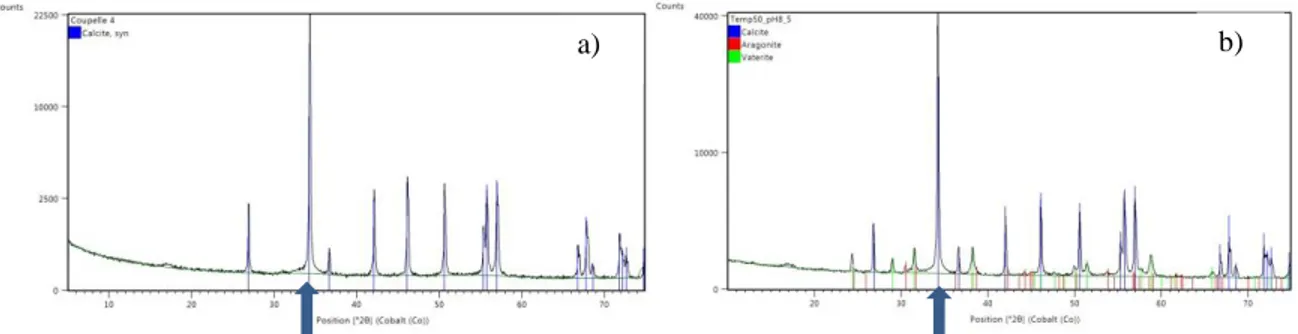
Six different samples from the four different precipitation conditions were taken for XRD analysis: pH 8.5 and 9.5 at 22°C and 55°C. For pH = 8.5 at 55°C and for pH = 9.5 at 22°C two samples were taken to evaluate repeatability. Figure 2 shows the result of XRD analysis. In all the samples with a pH of 8.5 at 55°C, a pH of 9.5 at 22°C and a pH of 9.5 at 55°C, XRD signals indicated the presence of calcite (blue strings inside peaks). Vaterite (green peaks) were observed in 60% of the crystallized samples, while aragonite (red peaks) was only observed in one sample (pH = 8.5 at 55°C) (Fig. 2-b). The presence of vaterite and/or aragonite was observed both together and separately but always with calcite. In Figure 2, the most representative peak of calcite was observed for 2θ = 34 (blue arrow). At a pH of 8.5 at 22°C, no peaks were observed, perhaps because the sample was too small or because calcium carbonate was in amorphous form (ACC) and did not crystallize.
Figure 2: XRD pattern of the precipitate. Calcite (blue peaks) are observed in all crystallized samples. Vaterite (green peaks) and aragonite (red peaks) are only observed in some samples (pH 8.5 at 55°C, figure 2-b).
Calcite is the main precipitate because it is the least soluble phase and the most thermodynamically stable crystal form of calcium carbonate, while vaterite is the most soluble phase and the least thermodynamically stable. Rogriguez-Blanco et al. (2011) showed that the first precipitation is in amorphous form (ACC) and subsequently crystallizes to calcite via vaterite. So the presence of vaterite in our samples is due to our experimental conditions, and particularly to the saturation index. The results of PHREEQC model (table 4) gave the saturation index of calcite at a pH of 8.5 at 55 °C as > 1.72. Spanos & Koutsoukos (1998) pointed out that a very high supersaturation (1.5 - 1.9) in which the solid phase is formed affects the transformation of vaterite into calcite. These authors also found a linear dependence of calcite content in the precipitate as a function of time. When the quantity of calcite increases, this results in a decrease in the quantity of vaterite. Sabbides et al. (1992) reported that aragonite may also be stabilized depending on the temperature of the supersaturated solutions and on the concentration of foreign ions present in water (Mg2+, oxalate anions, etc.). When the concentration of magnesium exceeded 53.3 mM, the aragonite phase was formed, whereas below this concentration, calcite
b) a)
8
was the only phase formed. In the XRD results, only crystallized calcium carbonate was found, mostly in the form of calcite.
TGA was used to highlight the other forms of precipitation and their percentage mass. One sample was taken randomly (pH 9.5 at 55°C) from the four repetitions and weighed before increasing the temperature. Results of the TGA showed only one notable reduction in mass between 600 and 750°C. This mass loss represented 44% of the initial weight, evidence that only calcium carbonate was present in the sample. The 44% represents the mass of CO2 which is
released from the sample. The remaining 56% corresponds to CaO according to the equation: CaCO3 → CaO + CO2
In theory, the molar mass of CaCO3 is 100.08 g.mol-1 with 44.01 g.mol-1 for the CO2. When the
CO2 was released, 43.97% of mass loss occurred, confirming the results. Li et al. (2013),
reported that during thermal decomposition of a pure phase of CaCO3 one mass loss is observed
between 600 and 850°C, representing 43.8% of the initial weight. The fact only calcium carbonate was present in our samples is due to the hardness of the water. Its value was 223 mg.L
-1
as shown in table 1, which according to Dey et al. (2007) is considered as very hard water.
Modeling precipitation with PHREEQC
The objective of using PHREEEQC was by modeling, to validate the effect of pH and temperature on calcite precipitation in the treated wastewater from the Mauguio WWTP. Once done, CO2 partial pressure was added to pH and temperature as a third parameter. This makes it
possible to modify the precipitation that can occur under real irrigation conditions. The behavior of calcite precipitation is not the same if the system is open or closed (in equilibrium with the atmosphere or not). Since the precipitate in this study generally consisted of calcite, modeling focused on this mineral. Reproducing the experiments in models will help predict the quality and the quantity of precipitates produced with a given water quality but with different CO2 partial
pressure. The effluent studied here is oversaturated with calcite (value 0.87). Even in such supersaturation conditions, no precipitation of calcite was observed. An increase in pH and temperature will increase the value of supersaturation calculated with PHREEQC software. When a certain threshold is exceeded, precipitation does occur. Tables 3 and 4 show the value of SI and pH at 22°C and 55°C respectively. Table (3-a) and table (4-a) show the volume of NaOH that corresponds to the amount of sodium hydroxide added in ml during the laboratory experiments to have a theoretical pH of 8, 8.5, 9 and 9.5. pH and SI were calculated with PHREEQC after adding the volume of NaOH and before precipitation occurs. Table (3-b) and table (4-b) shows the pH and SI after calcite precipitation. The SI was adjusted with PHREEQC to give a weight of calcite similar to the experimental one. Two cases of precipitation were studied with (open system) and without atmospheric equilibrium (closed system). The pH also was calculated with PHREEQC.
9
SI and pH values when NaOH is added before precipitation occurs (a)
Volume NaOH (ml) (experimental)
Numerical pH calculation after NaOH add
Numerical calcite SI calculation after NaOH add
3 8.442 1.43
5.25 8.715 1.68
9.75 9.05 1.95
19.25 9.486 2.22
SI, pH, and weight of calcite after precipitation occurs (b) Open system (O)
Numerical pH calculation after calcite precipitation
Numerical calcite SI calculation after precipitation Weight of calcite (mg) (experimental) 8.8 1.78 0.42 8.8 1.805 0.47 8.912 1.85 1.04 8.794 1.4 145.55 Closed system (C) 8.43 1.43 0.31 8.708 1.67 0.81 9.047 1.94 1.45 8.194 1.5 143.54
Table 3: SI and pH values before (a) and after precipitation (b) in an open and closed system with the corresponding weight of calcite.
In the experiment, the volume of NaOH added to obtain a pH of 8, 8.5, 9 and 9.5 was respectively, 3, 5.5, 9.75 and 19.25 ml (Figure 1). These volumes were added to the software to calculate the corresponding SI after the addition of NaOH (Table 3-a). Table (3-b) shows SI and pH results after precipitation in an open and closed system. The SI of calcite given by the model for (C) and (O) experiments are calibrated to give a weight of calcite close to that obtained in experimental conditions. For example for pH 8 at 22 °C, the weight of calcite is 0.67 ± 0.31 mg. Precipitation begins when after adding NaOH, the SI of calcite is between 1.95 and 2.22 (table 3-a). It corresponds to a pH of between 9 and 9.5. The corresponding experimental calcite weight was 1.3 mg and 140.1 mg respectively. For the first two volumes of added NaOH (3 and 5.25 ml), if we compare the pH after adding NaOH (8.4 and 8.7 respectively) and after precipitation in an open system (O) (8.8 in both cases) the pH increases, the same goes for the values of SI. No precipitation occurred to reduce these values and overcome the added NaOH. When precipitation occurred even in very small quantities (1.04 mg of calcite), the pH and SI began to decrease. pH dropped from 9.05 to 8.91 and SI from 1.95 to 1.85 for a volume of 9.75 ml of NaOH.
10
In the closed system (C), SI and pH before and after precipitation were invariable for the first three measures. When 19.25 ml of NaOH is added, about 143 mg of calcite precipitate reducing both the pH and SI. In an open system, like for experimental precipitation, obtaining calcite precipitation is more difficult than in a closed system. The values of SI are higher in case (O) than in case (C) for the two first volumes of added NaOH. In the case of irrigation with the Mauguio effluent at 22 °C, the water is stored in reservoirs or collected directly from the clarifier. In both cases, water is in balance with the atmosphere. Monitoring the pH is not sufficient to monitor the quality of the water with respect to mineral precipitation. pH is invariable in case (O) even with a high rate of precipitation due to the equilibrium of the carbonic system. Maximum pH was 8.9 and minimum pH was 8.7.
A total analysis of the water is necessary to calculate the SI which is the only indicator of precipitation. In conclusion, calcite precipitates with a particular degree of supersaturation (SI > 1.95). This degree can be achieved by increasing the pH of water.
SI and pH values when NaOH is added before precipitation occurs (a)
Volume NaOH (ml) (experimental)
Numerical pH calculation after NaOH add
Numerical calcite SI calculation after NaOH add
1.75 8.088 1.47
4.75 8.378 1.72
33.5 8.611 2.35
39.25 9.249 2.39
SI, pH, and weight of calcite after precipitation occurs (b) Open system (O)
Numerical pH calculation after calcite precipitation
Numerical calcite SI calculation after precipitation Weight of calcite (mg) (experimental) 8.863 1.85 57.91 8.82 1.7 105.61 8.782 0.85 295.6 8.855 0.98 294.59 Closed system (C) 7.317 0.6 55.63 7.101 0.25 102.3 8.938 0.95 295.4 9.368 1.2 295.8
Table 4: SI and pH values before (a) and after precipitation (b) in an open and closed system with the corresponding weight of calcite.
11
Like in the experiment at 22°C, the experimental volumes were introduced in the software. Tables 3 and 4 represent the same thing but at different temperatures. At 55 °C, precipitation begins at pH 8 and the value of SI after adding NaOH is 1.47. After precipitation and in case (O), the pH is the same regardless of the weight of the precipitate. When precipitation is almost compete, the saturation index drops to nearly that of the calcite in the initial state (initial SI = 0.8). The drop in SI is due to the decrease in the concentration of Ca2+ and HCO3- linked to
precipitation since the pH is invariable. Conversely in case (C), SI began low and increased with increasing precipitation like the pH. In this case, the value of SI is linked more to pH and temperature than to the weight of calcite. Like at 22 °C in the open system, starting calcite precipitation is more difficult than in a closed system. The temperature of the water reaches 55 °C in the pipes, and it is therefore considered as a closed system. The time the water takes passing through the pipe from the reservoir to the dripper and the pressure applied in the irrigation system influences the partial pressure of the CO2 as well as precipitation. Sherlock et
al. (1995) pointed out that the absence or presence of carbon dioxide strongly influences the
solubility of calcite. In an open system, there is an increase in the solubility of calcite, which implies a decrease in precipitation. In the opinion of (Hills et al. 1989), the value of SI can predict calcium carbonate precipitation. This index measures the solubility of calcium carbonate at a given temperature to ion concentration and pH. In conclusion, precipitation of calcite is greater at higher temperatures and pH. In irrigation, even at low temperatures, water that is equilibrated with the atmosphere in reservoirs before supplying the irrigation system will be subject to less chemical precipitation.
Discussion
Calcium carbonate precipitation is reported to be the main precipitate in irrigation waters (Hills
et al. 1989). In the present study, the precipitation of calcium carbonate was triggered by heating,
by adding a NaOH solution to water (0.1M), and by modifying CO2 partial pressure. These
factors are interlinked and modifying one may entail the modification of the other. 𝑂𝐻−+ 𝐻+ ↔ 𝐻
2𝑂 (4) NaOH is added to the water
𝐶𝑂2(𝑔) ↔ 𝐶𝑂2(𝑎𝑞) + 𝐻2𝑂 (5) CO2 equilibrium 𝐶𝑂2(𝑎𝑞) + 𝐻2𝑂 ↔ 𝐻2𝐶𝑂3 (6) Carbonic acid 𝐻2𝐶𝑂3 ↔ 𝐻𝐶𝑂3− + 𝐻+ (7) Bicarbonate 𝐻𝐶𝑂3− ↔ 𝐶𝑂 32− + 𝐻+ (8) Carbonate 𝐶𝑎2++ 2𝐻𝐶𝑂
3− ↔ 𝐶𝑎𝐶𝑂3+ 𝐶𝑂2+ 𝐻2𝑂 (9) Calcium carbonate precipitation
1. Effect of pH on calcite precipitation
This situation is observed when fertigation uses high pH fertilizers. As NaOH is added to the water, OH- neutralizes H+ in reaction (4). This removes H+ from reactions (7) and (8) which causes these reactions to shift to the right, generating more free HCO3- in solution. As more
12
HCO3- is present to exceed the solubility of CaCO3 leading to its precipitation. Figure 1 shows
that increases in pH alone do not cause precipitation, especially at 22°C, since precipitation only begins at more than pH 9. This is due to the CO2 equilibrium, since the experiment was
conducted in an open system. The more H+ is consumed by adding a base, the more H2CO3 the
reaction (7) will consume. Reaction (6) will also shift to the right as well as reaction (5). Atmospheric CO2 will dissolve in water to balance the lack of bicarbonate (HCO3-), which
causes the precipitation to delay. Two ascertainments were observed in the Figure 1, which will be explained below.
Analysis of the high volume of added NaOH:
In Figure 1, for example for pH 9 at 22°C no precipitation is produced. The volume of NaOH added to reach this pH is 10 ml. For the same pH at 55°C, 293 mg of calcium carbonate precipitate. The volume of NaOH added to maintain the pH at 9 is 34 ml. A higher quantity of NaOH volume must be added to maintain the same pH when precipitation occurs. This phenomenon occurs because between pH 8 and 9.5, HCO3– is the predominant carbonate ion. For
these conditions, the calcite precipitation reaction can be written as in reaction 9. Reaction 9 shows that as CaCO3 is formed, free HCO3– is removed from solution; this troubles the
equilibrium of reaction 7. To restore the needed balance, reaction shifts to the right to generate more free HCO3– and, at the same time, creates additional H+. The presence of additional H+
lowers the pH. It is this sequence which causes the pH to decrease as more NaOH is added. Stabilization of calcite weight:
In Figure 1, a stabilization of the calcium carbonate weight is observed at 55°C from pH 9 with 293 mg for both pH 9 and 9.5. In Mauguio’s water, the calcium concentration is 133 mg.l-1
. Calcium (M = 40:078 g.mol-1) is a limiting reagent with respect to the carbonates which are always in excess and forms as long as there is equilibrium with the atmospheric CO2 (reaction 5
till reaction 8). It is considered that all Ca2+ is associated with HCO3– to form calcium carbonate
(M = 100.0869 g.mol-1) in solid form. The theoretical weight of calcium carbonate (CaCO3) that
can be formed with this initial concentration of calcium is 332.5 mg. For Dey et al., (2007), pH and carbonic acid concentration (H2CO3) play an important role in the precipitation of CaCO3.
Calcium, which is linked to carbonate (carbonate hardness), can be precipitate by the addition of hydroxide ions (OH–) having a pH above 10. The remaining calcium, i.e., non-carbonate hardness, cannot be removed by simple adjustment of pH. Therefore, soda ash (sodium carbonate) must be externally added to precipitate this remaining calcium. This can explain the difference between the experimental mass of calcium
2. Effect of temperature and CO2 partial pressure on calcite precipitation
In the field, scale deposits are mainly determined by thermal effects (Hui & Lédion 2002). Heating of the water in pipes exposed to sunlight reduces carbon dioxide solubility. The decrease in CO2 solubility causes the release of CO2 to the atmosphere through degassing. The release of
13
consumption of H+ and hence to an increase in pH. The rise in pH and the presence of calcium ions and carbonic species (reaction 9) trigger calcium carbonate precipitation (Hui & Lédion 2002). In figure 1, the increase in pH had more effect on calcite precipitation at 55 °C and began even at pH 8. In this case, as highlighted by PHREEQC, the solubility of calcite is affected. 3. Effect of the calcite saturation index
PHREEQC results showed that the calcite saturation index is an important parameter for scale deposits and that it increases with increasing pH and temperature. The saturation index of the water was 0.87 and no precipitation was observed until the index reached 1.95 at 22 °C at a pH of 9, and 1.47 at 55 °C at a pH of 8. Wojtowicz (2001) pointed out that a positive saturation index (SI) does not cause calcium carbonate precipitation until a certain degree of supersaturation is reached. A supersaturated solution can be obtained by increasing the temperature and pH with the same water quality or by increasing water alkalinity and calcium content (Larson & Buswell 1942). The modeling and correction that have been done works in the case of water with high content in calcium. For other type of precipitation other correction should be done.
In irrigation systems fed by several qualities of treated wastewater, Ghorbel et al. 2001 and Tarchitzky et al. 2013 found insoluble materials mainly formed of calcium carbonate precipitates. This underlines the precipitation of calcium carbonate when wastewater is used for micro-irrigation.
Conclusion
When wastewater is reused for micro-irrigation, the quality of the water and the environmental conditions affect the precipitation of salts which finally clog the drippers. In this study, three parameters, temperature, pH and CO2 partial pressure, were varied to evaluate their effect on
possible precipitation. The effects of the three parameters were shown to be interlinked in the precipitation of calcium carbonate. Laboratory and modeling experiments with PHREEQC were conducted to validate the model.
1. In the case of the wastewater effluent studied here, calcium carbonate was precipitated as calcite when pH and temperature increased. Calcite was the main and most stable precipitate and was found in all the samples. All dissolved calcium precipitated in combination with the carbonates at pH 9 and 55 °C.
2. PHREEQC also showed calcite to be the most abundant precipitate based on the reuse of effluent from the Mauguio WWTP. The saturation index of calcite was calibrated to obtain the same weight of calcite as in the laboratory experiment. The model provided proof that calcite precipitates at a given degree of supersaturation, which can be achieved by increasing pH and temperature. At a high temperature (55 °C) the value of SI that led
14
to calcite precipitation was 1.47 above a pH of 8, while it was 1.95 at 22°C at pH 9. It was easier to start calcite precipitation at 55°C than at 22 °C.
3. The effect of atmospheric CO2 was also investigated. In an open system, i.e., in
equilibrium with CO2, the solubility of calcite increased due to a constant supply of CO2.
To minimize calcite precipitation in irrigation, water should be stored in open reservoirs at a low temperature and a low pH.
Practically this study shows that the contribution of CO2, high pH and temperature are the main
drivers of precipitation. Consequently it can be achieved to privilege acid fertilizers when practicing fertigation, and avoid high temperature period, thus practicing fertigation preferably at night. The next step will be to validate our results by modeling several effluent qualities and comparing them with laboratory precipitation experiments and with water with the same chemical composition but without organic matter such as potable water. In this case, any quality water that would be used for irrigation could be modeled. By varying environmental conditions, the concentrations of elements caused by fertigation among others, the software would show whether or not there will be a risk of precipitation. If yes, preventive measures could be taken depending on the quality and quantity of chemical clogging indicated. Several pressures can be used in micro-irrigation, depending on the type of dripper, the length of the pipes, and the power of the pumps. A degassing phenomenon can be encountered even at the outlet of the drippers, which increases the risk of precipitation. Similarly, evaporation plays a very important role in the precipitation of salts. The evaporation phenomenon is also encountered at the level of the drippers. As perspective, the variations in pressure and evaporation can also be modulated with PHREEQC. This study focuses only on chemical precipitation which is only one aspect of the clogging of micro-irrigation systems but in reality and with the complexity of the wastewater composition, interactions between biofilm developments, chemical precipitation and mineral particles can be found. The emitter’s structure and the operating model as the irrigation frequency, the working pressure ets can contribute to the development of biofilm and to the deposition of solid particles which leads to dripper clogging. The link between emitter’s structure and the operating model with chemical clogging has not or little been studied and could be a very good approach of research. From the results of this study a perspective can be discussed regarding the interaction between calcium carbonate precipitation and biofilm development in a micro-irrigation system.
Acknowledgments
The authors gratefully acknowledge the financial support of the NGO T.E.R.R.E Liban and Water4crops project and also wish to thank the CEREGE laboratory (Aix-en-Provence) for their help with the DRX tests.
15
References
Ahmad Aali K. A., Liaghat A. & Dehghanisanij H. 2009 The effect of acidification and magnetic field on emitter clogging under saline water application. Journal of Agricultural Science, 1(1), 132-141.
Appelo C. A. J., & Postma D. 2005 Geochemistry, groundwater and pollution, Second Edition. (CHEMLIBnetBASE.) Leiden: Balkema.
Ayers R. S. & Westcot D. W. 1985 Water Quality for Agriculture, Food and Agriculture Organization of the United Nations. Rome.
Bauder T.A., Waskom R.M., Sutherland P.L. & Davis J. G. 2014 Irrigation Water Quality Criteria, fact sheet No.0.506, Colorado State University Extension, USA.
Bourrié G, Trolard F., Chanzy A., Ruget F., Lecerf R. & Charron F. 2013 Sustainable intensive agriculture: evidence from equeous geochemistry, Procedia Earth and Planetary Science, 7, 93-96.
Bucks, D. A., Nakayama, F. S., Gilbert R. G. (1979). Trickle irrigation water quality and preventive maintenance. Agricultural Water Management. 2(2): 149-162.
Capra A. & Scicolone B. 1998 Water quality and distribution uniformity in drip/trickle irrigation systems. Journal of Agricultural Engineering Research, 70(4),355–365
Dey D., Herzog A. & Srinivasan V. 2007 Chemical precipitation : water softening. report ENE 806,Michigan State University East Lansing.
Gabrielli C., Maurin G., Poindessous G. & Rosset R. 1999. Nucleation and growth of calcium carbonate by an electrochemical scaling process. Journal of Crystal Growth 200: 236-250. Gamri S., Soric A., Tomas S., Molle B. & Roche N. 2015 Effects of pipe materials on biofouling under controlled hydrodynamic conditions. Journal of Water Reuse and Desalination, 281,167-174.
Ghorbel A., Tlili M.M., Walha K., Ben Amor M. & Rosset R. 2001 Étude du phénomène de colmatage chimique des distributeurs d'eaux utilisés en microirrigation (Study of the phenomenon of chemical clogging of water distributors used in micro-irrigation). Cahiers de
l'association Scientifique Européenne pour l’Eau et la Santé 6(1), 31-38.
Haman D. Z. 1990 Causes and Prevention of Emitter Plugging In Microirrigation Systems, BUL258, Agricultural and Biological Engineering Department, UF/IFAS Extension.
Hills D. J., Nawaar F. M. & Waller P. M. 1989 Effects of chemical clogging on drip-tape irrigation uniformity, Trans of the ASAE 32(4),1202-1206.
16
Hui F. & Lédion J. 2002 Evaluation methods for the scaling power of water, European Journal
of Water Quality, 33(1), 41-52.
Karaca O. F. & Uçan K. 2013 Elimination of lime causing clogging in emitters by chemical methods in drip irrigation. African journal of agricultural research 8(13),1136-1143.
Larson T. E. & Buswell A. M. 1943 Calcium carbonate saturation index and alkalinity interpretations. Journal of the American Water Works Association, 34(11), 1667-1679.
Li X.-G., Lv Y., Ma B.-G., Wang W.-Q. & Jian S.-W. 2013 Decomposition kinetic characteristics of calcium carbonate containing organic acids by TGA, Arabian Journal of
Chemistry, http://dx.doi.org/10.1016/j.arabjc.2013.09.026
Lili Z., Yang P., Ren S., Li Y., Liu Y. & Xia Y. 2016 Chemical clogging of emitters and evaluation of their suitability for saline water drip irrigation. Irrigation and Drainage, 65,439-450.
Parkhurst D. L. & Appelo C.A.J. 1999 User's guide to PHREEQC (Version 2): a computer program for speciation, batch-reaction, one-dimensional transport, and inverse geochemical calculations, Water-Resour. Invest. Rep. 99-4259. US Geol. Surv. Denver, Colorado.
Rodriguez-Blanco J. D., Shaw S. & Benning L.G. 2011 The kinetics and mechanisms of amorphous calcium carbonate (ACC) crystallization to calcite, via vaterite. Nanoscale, 3, 265-271.
Sabbides T., Giannimaras E. & Koutsoukos P. G. 1992 The precipitation of calcium carbonate in artificial seawater at sustained supersaturation. Environmental Technology 13(1):73-80.
Sherlock E. J., Lawrence R. W. & Poulin R. Geo. 1995 On the neutralization of acid rock drainage by carbonate and silicate minerals. Environmental Geology, 25(1),43-54.
Spanos N. & Koutsoukos P. G. 1998 The transformation of vaterite to calcite: effect of the conditions of the solution in contact with the mineral phase. J Crystal Growth 191,783-790. Tarchitzky J., Rimon A., Kenig E., Dosoretz C. G. & Chen Y. 2013 Biological and chemical fouling in drip irrigation systems utilizing treated wastewater. Irrigation Science, 31(6), 1277– 1288.
Wojtowicz J. A. 2001 Calcium Carbonate Precipitation Potential. Journal of the Swimming Pool