HAL Id: insu-01164266
https://hal-insu.archives-ouvertes.fr/insu-01164266
Submitted on 18 Jun 2015HAL is a multi-disciplinary open access
archive for the deposit and dissemination of sci-entific research documents, whether they are pub-lished or not. The documents may come from teaching and research institutions in France or abroad, or from public or private research centers.
L’archive ouverte pluridisciplinaire HAL, est destinée au dépôt et à la diffusion de documents scientifiques de niveau recherche, publiés ou non, émanant des établissements d’enseignement et de recherche français ou étrangers, des laboratoires publics ou privés.
The Infrared Solar Spectrum Measured by the
SOLSPEC Spectrometer Onboard the International
Space Station
Gérard Thuillier, Jerry W. Harder, Alexander Shapiro, Thomas N. Woods,
Jean-Marie Perrin, Marty Snow, Timofei Sukhodolov, Werner Schmutz
To cite this version:
Gérard Thuillier, Jerry W. Harder, Alexander Shapiro, Thomas N. Woods, Jean-Marie Perrin, et al.. The Infrared Solar Spectrum Measured by the SOLSPEC Spectrometer Onboard the International Space Station. Solar Physics, Springer Verlag, 2015, 290 (6), pp.1581-1600. �10.1007/s11207-015-0704-1�. �insu-01164266�
1
The Infrared Solar Spectrum Measured by the SOLSPEC
Spectrometer Onboard the International Space Station
G. Thuillier1, J. W. Harder2, A. Shapiro3, T. N. Woods2, J.-M. Perrin4, M. Snow2, T. Sukhodolov3, W. Schmutz3
1 LATMOS-CNRS, 11 blvd d’Alembert, 78280 Guyancourt, France
2 Laboratory for Atmospheric and Space Physics, University of Colorado, 3665 Discovery Drive, Boulder, Colorado 80303, USA
3 Max-Planck Institut, Gottingen, Germany
4 Observatoire de Haute-Provence du CNRS, F-04870 Saint Michel l'Observatoire, France
Abstract A solar spectrum extending from EUV to the near infrared (IR) is an important
input for solar physics, climate research, and atmospheric physics. Ultraviolet measurements have been conducted since the beginning of the space age but measurements throughout the contiguous visible and infrared regions are much more sparse. Ageing is a key problem throughout the entire spectral domain, but the majority of the effort to understand degradation has concentrated on the ultraviolet spectral region and these mechanisms may not be
appropriate for the infrared. This problem is further complicated by the scarcity of long-term data sets. Onboard the International Space Station, the SOLSPEC spectrometer measured an IR solar spectral irradiance smaller than the one given by ATLAS 3, e.g. by about 7% at 1700 nm. In the present article, we evaluate the consequences of the lower solar spectral irradiance measurements, and present a re-analysis of on-orbit calibration lamp and solar data trend yielding to a revised spectrum.
Keywords: Ground-based measurements, International Space Station, Solar infrared spectrum, SOLSPEC
1 Introduction
Solar spectral irradiance (SSI) is identified by the Global Climate Observing System (GCOS) as an essential climate variable. High precision/accuracy measurements, with extensive and well documented data characterization are required for climate and for solar and atmospheric sciences. Measurements from space bring the strong advantage of being free of atmospheric contamination which is a large limiting factor for ground-based observations. However, they present a challenge when it comes to the stability of the sensors over time.
SOLSPEC (SOLar SPECtrometer) is a state-of-the-art spectrometer deployed in various
space missions (Space Shuttle, European Retrievable Carrier (EURECA) platform, and now the International Space Station (ISS)) and therefore producing measurements spanning over a
long time, however having a short duration. Processing has aimed to produce reference solar spectra over specific time periods: solar maximum or minimum. For example, ATLAS 1, ATLAS 3 and the EURECA missions produced two reference spectra, one for high solar variability and another for low solar variability which have since been largely used by the science community (Thuillier et al., 2004). Since 2008 SOLSPEC is operating onboard ISS. SOLSPEC data have been used to produce a composite spectrum extending the spectral domain of the previous spectra and representative of the lowest solar minimum from the modern era. It is referred as SOLAR 2 composite (Thuillier et al., 2014).
Bolsée et al. (2014) recently proposed that the solar irradiance in the infrared (IR) domain is significantly lower than given by the ATLAS 3 reference solar spectrum, for example by about 7% at 1700 nm.
They based their conclusion on the following spectra:
• new measurements (named InfraRed SPEctroRADiometer, IRSPERAD) obtained from the ground at the Izaña station (Tenerife, Spain) in the IR spanning from 1000 to 2400 nm,
• SOLAR 2 measured by the SOLSPEC instrument onboard the ISS,
• the Scanning Imaging Absorption Spectrometer for Atmospheric Chartography (SCIAMACHY; Bovensmann et al., 1999) spectrum provided by M.Weber (private communication, 2013), and
• the Menang et al. (2013) spectrum (named Continuum Absorption at Visible and Infrared Wavelengths and its Atmospheric Relevance, CAVIAR) measured from ground at about 9 km away from the sea.
We will review and discuss the different arguments supporting this conclusion, and show what the consequences are in terms of a low solar irradiance in the IR for solar spectral modelling, total solar irradiance, and calibration of the space-based instruments in the visible domain. Furthermore, we present a re-analysis of on-orbit calibration lamp and solar data trending for SOLSPEC-ISS. Such a reanalysis allows us to produce a new reference spectrum called SOLAR 2rev. This spectrum is in a good agreement with ATLAS 3 but disagrees with IRSPERAD, which indicates that SOLAR 2 spectrum cannot be considered as a support for the lower value of the IR irradiance.
2 SOLSPEC Spectrometer: Missions and Results
2.1 Brief Instrument Description
Thuillier et al. (2009) describe in detail the SOLSPEC instrument and its on-orbit behaviour. SOLSPEC consists of three double gratings spectrometers (UV, visible, and IR) allowing measurements from 170 to 2900 nm. The duration to record such a spectrum is 11 min.
The instrument carries several light sources for use in on-orbit monitoring instrument degradation trends: two deuterium lamps to monitor the UV spectrometer aging, two tungsten ribbon lamps which provide information for the visible spectrometer, and two other tungsten ribbon lamps are dedicated to the IR spectrometer for monitoring aging. This allows a redundancy in terms of lamps. Each calibration lamp has a specific measurement cadence: 3 days and 15 days. The IR detector is equipped with three gain ranges (1, 4.1, and 41)
permitting comparable signals, with the lowest gain used for solar measurements and the highest gain for the tungsten lamp measurements. A hollow cathode lamp filled with Argon emits lines, which allow us to measure in-flight the spectrometer’s slit function and the
3
precise relationship between wavelength and grating position. The seven lamps are located in an enclosure placed above the spectrometer’s entrance slits. On the top of the instrument is a light-tight shutter that is only open when the Sun pointing is available. When the instrument is in the stand-by mode and for calibration with the lamps, the shutter remains closed. During the period of low solar activity, SOLSPEC recorded a solar spectrum once every two days in order to limit the effect of the solar EUV on the entrance optical windows and thus to reduce its degradation trend.
2.2 SOLSPEC Missions
The first SOLSPEC mission was with SpaceLab I in 1983. After refurbishment and recalibration, SOLSPEC participated in the three ATLAS (ATmospheric Laboratory for
Applications and Science) missions aboard the NASA Space Shuttle in 1992, 1993, and 1994.
A duplicate SOLSPEC instrument named SOlar SPectrum (SOSP) was flown on the EURECA platform in 1994. SOLSPEC and SOSP were both calibrated with the blackbody reference at the Heidelberg Observatory.
The SOLSPEC spectrometer was installed 8 February 2008 on the Columbus Laboratory of the ISS. This unit was the same instrument as flown on ATLAS, but with updated electronics and optical components. Extensive lamp calibration equipment was incorporated and synchronous IR signal detection was implemented by the Belgian Institute for Space Aeronomy (BIRA-IASB). After alignment of the optics, vacuum and mechanical tests, the new SOLSPEC was calibrated at the Physikalisch-Technische Bundesanstalt (PTB; Braunschweig, Germany) using a blackbody as reference (Thuillier et al., 2009).
2.3 ATLAS 1 and 3 and SOLAR 1 and 2 Spectra
Using data from the three ATLAS missions and the EURECA mission, two spectra were built (Thuillier et al., 2004):
– ATLAS 1 at high solar activity and ATLAS 3 at low solar activity. For both spectra the IR range was provided by the SOSP/EURECA as the temperature of the platform was low and stable enough to allow IR measurements. ATLAS 1 and 3 spectra are a composite extending from 0.5 nm to 2400 nm. In the following discussion, we shall only refer to the IR part extending from 1000 to 2400 nm. The IR ATLAS 3 has been used to derive the photosphere brightness temperature as a function of wavelength, and is consistent with the Solar Radiation Physical Model (SRPM; Fontenla et al., 2009).
Using data from SOLSPEC onboard the ISS, two composite spectra were built extending from 16 to 2900 nm using the following data sets:
- the Solar Auto-Calibrating EUV/UV Spectrometers (SolACES ; Schmidtke et al., 2006, 2014), which is a self-calibrating spectrometer that uses ion gas cells, to measure from 17 to 150 nm.
- SOLSPEC (Thuillier et al., 2009) spectrometer measuring from 170 to 2900 nm, - the Solar Stellar Irradiance Comparison Experiment (SOLSTICE) onboard the Solar
Radiation and Climate Experiment (SORCE ; Rottman, 2005; McClintock, Snow, and
Woods, 2005) to fill the gap between 150 and 170 nm.
The name of this reference spectrum at solar minimum activity using these data is SOLAR 2. Data were taken at the first light (5 and 8 of April 2008), and additional data obtained one month later (2, 4, and 5 of May 2008) were co-added to increase the signal to noise ratio.
The SOLAR 2 spectrum was recorded at first light to avoid aging effects that were subsequently identified from measurements using the onboard deuterium lamp. At the first light, the SOLSPEC-ISS data in the UV and visible were found consistent with the
SORCE/Solar Irradiance Monitor (SIM) measurements. In the IR, the measurements were compared to ATLAS 3 in the IR range. The corresponding irradiance was found lower than ATLAS 3 (Figure 1). This was reported at the MOCA meeting “Our Warming Planet” (Montreal, Canada, 2008), and recently published by Thuillier et al. (2014).
Figure 1c shows that the SOLAR 2 IR SSI is smaller than ATLAS 3 and differs by as much as 7% at 1700 nm (see also Figure 9 in Thuillier et al., 2014). In light of this
disagreement a reference spectrum identified as SOLAR 1 was constructed with the SOLAR 2 spectrum but substitutes the 1100-2400 nm range with the measurements from ATLAS 3 (Thuillier et al., 2014). SOLAR 1 and 2 correspond to the Solar Cycle 23 activity minimum.
Given the discrepancy with respect to ATLAS 3, independent IR spectral comparisons were conducted:
• from theoretical models: COde for Solar Irradiance (COSI; Shapiro et al., 2010) and Solar Radiation Physical Modeling (SRPM; Fontenla et al., 2011)
• from SCIAMACHY recent spectrum (SCIAMACHY2002; M.Weber, private
communication, 2013) and SCIAMACHY2004 as published by Pagaran et al. (2011) and Noël, et al. (2007)
• Whole Heliospheric Interval (WHI; Woods et al., 2009)
• Two spectra from ground (Menang et al., 2013; Bolsée et al., 2014)
WHI uses SIM, which was normalized to ATLAS 3 in the early part of the SORCE mission (Harder et al., 2010, Section 4.3) based on an analysis of flight spares and flight data leading the SORCE team to make this adjustment.
5
Figure 1: Panel (a) shows the ratio to ATLAS 3 of the COSI and SRPM spectra calculated at
the time of SOLAR 1 and 2 composites. SCIAMACHY2002, SCIAMACHY2004, and SOLAR 2 are displayed together on panel (b). Panel (c) shows SOLAR 1, SOLAR 2, and IRSPERAD. The present discussion is focussed on the IR SSI so only data above 700 nm are displayed.
Figure 1 shows:
• The agreement between COSI and SRPM with a maximum difference of 4% in the IR between 1900 and 2100 nm
• The agreement between SOLAR 2 and SCIAMACHY2002 (M. Weber, private communication, 2013)
• Some agreement between SOLAR 2 and IRSPERAD
The accuracy of SCIAMACHY2002 data will be discussed in Section 6.
3 Behaviour of the IR Channel
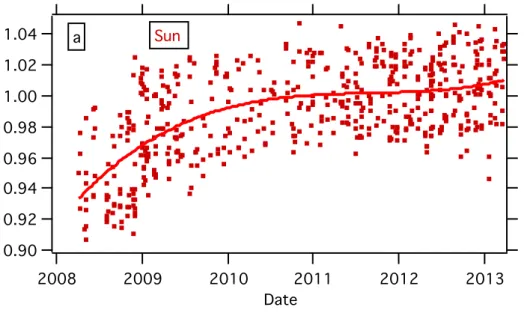
Figure 2 shows the behaviour of the SOLSPEC/ISS instrument for its IR solar signal and IR lamp signal as a function of time, respectively. The domain of wavelength is 1560-1620 nm in order to be close to the SOLAR 2 domain where a deficit of SSI with respect to ATLAS 3 is measured (Figure 1c). Figure 2 (upper panel) clearly indicates an increase of the solar signal as a function of time. Likely, the instrument reached its permanent regime around 2010. We have no clear explanation of this phenomenon, likely due to some temperature effect and/or the outgassing of the instrument.
1.04 1.02 1.00 0.98 0.96 0.94 0.92 0.90 Su n si gn al v ar ia ti on 2013 2012 2011 2010 2009 2008 Date Sun First light a) b a
7 1.05 1.00 0.95 0.90 N or ma lis ed s ig na l 2012 2011 2010 2009 Date a b W3 tungsten ribbon lamp
The solid line is a 5th degree polynomial fit 4300 4200 4100 4000 3900 3800 3700 3600 Si gn al 2013 2012 2011 2010 2009 Date Sun
Sun W3 tungsten ribbon lamp
c 1.20 1.15 1.10 1.05 1.00 Sp ec tr al Ra ti o 2400 2200 2000 1800 1600 1400 1200 1000 Wavelength (nm) -0.050.00 0.05 Fi t Re si du al Fit = K0 + K1*! + K2*!2+ K3*!3 K0 =1.458 ± 0.145 K1 =-0.000951 ± 0.000271 K2 =+6.45e-07 ± 1.63e-07 K3 =-1.26e-10 ± 3.2e-11 (95% confidence limits) (Residual RMS =0.0157) d
Figure 2: The SOLSPEC/ISS data in the range 1530-1620 nm. Panel (a) shows the IR solar
signal and panel (b) shows the IR lamp signal in the same wavelength range for lamp W3. (the less frequently used lamp). Curves in panels (a) and (b) are fifth-order polynomial fits. Panel (c) displays the two datasets combined together to show the same trend in the two IR datasets (Sun and W3). (d) The ratio of the 2010 mean spectrum to 2008 mean spectrum is displayed. Around 1330, 1600, and 2200 nm, there is a spectrometer filter change that generates variations in the ratio amplitude of about ± 5%, which is removed by using the polynomial fitting.
The lamp signal is noisier than the solar signal as expected given the effective
temperature of the Sun (about 5800 K) compared to the lamp temperature (2100 K). Figure 2b shows the W3 lamp signal as a function of time. W4 signal behaves similarly up to mid 2010, and begins to decrease afterward by internal darkening of lamp interior, in particular its front window. This darkening originates from sublimation of the tungsten filament with subsequent deposition on the window when the lamp is powered. Figure 2c shows a similar trend between the Sun and lamp signals as a function of time.
Two tungsten ribbon lamps dedicated to the IR spectrometer record a consistent increase (Figures 2a and b) with the solar signal (Figure 2d) in instrument responsivity from first light to permanent and more stable regime after about 2 years of operation.
Consequently, the IR solar data used at first light is lower than in the permanent regime reached by mid 2010.
However, this responsivity increase is shown in the spectral domain 1530-1620 nm. We have investigated if a similar behaviour also exists at other wavelengths. For that, we have gathered the existing measured spectra (raw data) in April 2008 and April 2010, and calculated the corresponding mean spectra and their ratio. To establish this ratio, we used the solar signal for two reasons: i) its signal to noise ratio is larger than with the lamp signal even taken on the highest gain amplifier (see Section 2.1) as expected, ii) even with the highest gain, the tungsten lamp cannot generate a usable signal long-ward of 1800 nm. At 1000 nm the ratio is very close to unity and increases as a function of wavelength. The origin of this phenomenon is not understood despite extensive investigations. A possible scenario is presented below: A contamination could occur when the instrument was without electric power just after the vehicle docking delivering the solar payload. A contamination has been observed on the SolACES spectrometer. SOLSPEC has observed an increase of the deuterium lamp signal, followed by a significant decrease due to the lamp itself (see Figure 3, upper left, in Thuillier al., 2014). Another unexpected behaviour was observed in the visible
spectrometer. Contamination slowly removed afterward by evaporation to space.
We note the increasing noise as a function of wavelength due to the decreasing of the raw solar signal with increasing wavelength (Figure 2d).
We will show in the next section that such a behaviour of the IR spectrometer on orbit explains the difference between SOLAR 1 (i.e. ATLAS 3) and SOLAR 2 spectra (first light for SOLSPEC/ISS).
4 Revision of SOLAR 2, Revisited Estimate for Solar IR Measurements Uncertainty, and Discussion
9
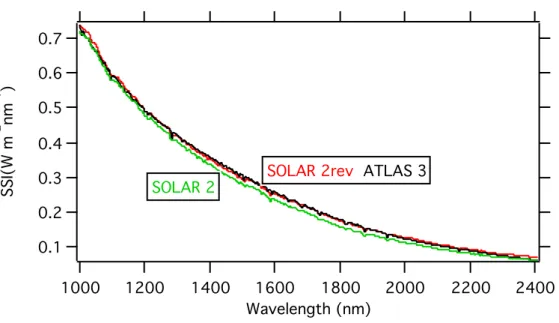
The trend with wavelength depicted in Figure 2d has been fitted by a 3rd order polynomial and applied to SOLAR 2. The resulting spectrum is named SOLAR 2rev. Note that the ATLAS 3 spectrum is not used to determine this correction factor, so it is an independent measurement. The application of this polynomial to the SOLAR 2 results in a spectrum that is labelled as SOLAR 2rev and shown in Figure 3 along SOLAR 2 and ATLAS 3.
Figure 3: Comparison of SOLAR 2, ATLAS 3, and SOLAR 2rev. SOLAR 2rev is derived by
correcting the SOLAR 2 spectrum by applying the polynomial fit from the ratio of the 2008 and 2010 spectra shown in Figure 2d.
As expected, SOLAR 2 SSI is lower than the two others. Furthermore, ATLAS 3 (in black) and SOLAR 2rev (in red) are very close. To estimate the agreement, the power between 1000 and 2400 nm is calculated for the three spectra. We found:
• The band-integrated irradiance for ATLAS 3 is 373.085 Wm-2. • Difference between ATLAS 3 and SOLAR 2: 19.006 Wm-2. • Difference between ATLAS 3 and SOLAR 2rev: - 1.337 Wm-2.
Given that the three data sets have uncertainties quoted to 3%, the 1.337 Wm-2
difference (0.3 %) is within their combined uncertainties.
As SOLAR 2rev is very close to ATLAS 3, we have displayed one versus the other in Figure 4. 0.7 0.6 0.5 0.4 0.3 0.2 0.1 SSI (W m -2 nm -1 ) 2400 2200 2000 1800 1600 1400 1200 1000 Wavelength (nm)
Figure 4: SOLAR 2rev versus ATLAS 3 is shown in red. The bisector of the figure is
displayed in black.
The SOLAR-ATLAS 3 relationship is quasi linear and is very close to the bisector (line with slope 1.000). In order to estimate how close it is to the SOLAR 2rev/ATLAS 3 relationship, a linear fit is made providing the following results: The intersection is at -7.5864 10-5 ± 0.000272, and the slope is 1.004 ± 0.000848. The difference in slope from the 1:1 line represents a relative apparent change in the calibration between the time periods of ATLAS 3 and SOLAR of about 0.4%. We note that it is consistent with the power difference between ATLAS 3 and SOLAR 2rev as shown above. Some differences with respect to the bisector may be seen, the greatest is shown around 1000 nm (SSI around 0.7 Wm-2nm-1).
To point out these differences, the ratio SOLAR 2rev/ATLAS 3 is displayed as a function of wavelength on Figure 5.
0.6 0.4 0.2 0.0 SO LA R 2 re v (W m -2 nm -1 ) 0.6 0.4 0.2 0.0 ATLAS 3 (W m-2 nm-1)
The black line is the bisector (line of slope 1)
1.10 1.05 1.00 Ra ti o SO LA R 2 re v/ A T LA S 3 2400 2200 2000 1800 1600 1400 1200 1000 Wavelength (nm)
11
Figure 5: SOLAR 2rev to ATLAS 3 ratio is shown as a function of wavelength. A
polynomial fit is made to derive the trend after removing the noise.
The ratio shows wavelength dependence and remains smaller than 5 % below 2200 nm. We note that the ratio is particularly close to unity in the wavelengths range of the maximum deviation between ATLAS 3 and SOLAR2 (around 1700 nm). The increase of the ratio towards the wavelength onward 2200 nm can be explained by a small signal to noise ratio of both ATLAS3 and SOLAR2rev spectra.
We will show in the next section its compatibility with the uncertainties of the data sets participating to this ratio.
4.2 Uncertainty Budget
Table 1 presents the uncertainty budget summary based on the analysis performed in this study. Adding in quadrature the uncertainties of ATLAS 3 (3%), the SOLAR 2 stabilization correction (5% at 1800 nm), the IRSPERAD uncertainty calibration, and the atmospheric effects estimated from the local atmosphere characteristics suggests a 6 to 8%
ISPERAD/ATLAS 3 difference at 1800 nm. An estimate of the absolute accuracy of IRSPERAD alone considers two sources of uncertainty: the instrument absolute calibration and counting statistics contribute at least 1% along with atmospheric effects that are
independent of the instrument uncertainty. If these atmospheric contributions are considered independent, they add to give a 1.45% to 2.05% contribution; for a random uncertainty they are added in quadrature to give a 0.8% to 1.14% uncertainty due to the local sub-visible clouds that can only be detected by in-situ LIDAR at the observation station. We have rounded to this 1%, which leads to a total of 2%.
Table 1. Estimated uncertainties of the IR irradiance analysed in this study. Quoted instrument accuracy
IRSPERAD (laboratory calibration) 1%
ATLAS 3 (preflight calibration) 3%
SOLAR 2 (preflight calibration) 3%
SOLAR 1 (SOLAR 2 <1100 nm, ATLAS 3 > 1100nm) 3%
Atmospheric effects (ground based measurements)
Aerosols 0.45%
Water vapor diffusion 0.5%
Local sub-visible clouds <0.6%
Bouguer-Langley method 0.5%
SOLAR 2 stabilization (in-flight degradation correction > 1100 nm)
wavelength dependent (see Figure 2d)
Now, let take into account the ratio SOLAR 2rev/ATLAS 3 as a function of wavelength. ATLAS 3, SOLAR 2, and the ratio 2010/2008 contribute to the ratio SOLAR 2rev/ATLAS 3. The difference to unity of this ratio is given on line 2 of Table 2. Taking into account the signal amplitude, the uncertainty of the ratio 2010 to 2008 is calculated and displayed on line 3 (Table 2). The uncertainty affecting the ratio SOLAR 2/ATLAS 3 is obtained from their quoted uncertainty (line 4). Finally, we combined these uncertainties
(lines 3 and 4) in line 5. Now, comparing lines 2 and 5, we show that the difference SOLAR 2rev/ATLAS 3 to unity is compatible with the estimated uncertainty up to 2300 nm. Above, it is increasing up to 9 % at 2400 nm. At 2400 nm, this difference is not compatible with the uncertainty budget. The presence of important noise may contribute to these 9%. At this point, it is reminded that at that wavelength the SSI is very small, and the instrument responsivity as well.
Table 2. Budget uncertainties (%) as a function of wavelength (µm)
λ (µm) 1.0 1.2 1.4 1.6 1.8 2.0 2.2 2.3 2.4
SOLAR 2rev/ATLAS 3 difference 3.0 1.0 1.0 2.0 1.0 1.0 2.0 5.0 9.0 Uncertainty on 2010/2008 ratio 0.65 0.70 0.90 1.5 1.8 2.5 5.0 5.2 4.5 Uncertainty on SOLAR 2/ATLAS 3 ratio 4.3 4.3 4.3 4.3 4.3 4.3 4.3 4.3 4.3 Combined uncertainties (lines 2 and 3) 4.4 4.4 4.4 4.6 4.7 5.0 6.6 6.7 6.2
5.Discussion
5.1 Consistency with the Solar Atmosphere Models
Planck’s law shows an irradiance distribution in semi-log coordinates as a function of
wavelength, which is linear in the IR range. With the same presentation using ATLAS 3 data, a linear distribution of the SSI as a function of wavelength is used to calculate the brightness temperature of the solar atmosphere from where the IR SSI originates. Figure 6 displays the difference between brightness temperatures calculated with different spectra with respect to temperature calculated with COSI.
13 -400 -300 -200 -100 0 100 200 300 T ( mod el or me as ur ed s pe ct ru m) T ( C O SI ) 2500 2000 1500 1000 500 0 Wavelength (nm) T(SOLAR 1) - T(COSI) T(SOLAR 2) - T(COSI) T(ATLAS 3) - T(COSI) T(WHI) - T(COSI) T(SCIAMACHY)-T(COSI) TSRPM) - T(COSI) T(IRSPERAD)- T(COSI) + T(Arvesen) - T(COSI) +
T(SOLAR 2rev) - T(COSI)
-400 -300 -200 -100 0 100 200 300 T ( mod el or me as ur ed s pe ct ru m) T ( C O SI ) 2500 2000 1500 1000 500 0 Wavelength (nm) T(SOLAR 1) - T(COSI) T(SOLAR 2) - T(COSI) T(ATLAS 3) - T(COSI) T(WHI) - T(COSI) T(SCIAMACHY)-T(COSI) TSRPM) - T(COSI) T(IRSPERAD)- T(COSI) + T(Arvesen) - T(COSI) +
Figure 6: Difference in calculated brightness temperatures as a function of wavelength for all
spectra and the COSI theoretical model used as baseline from 200 to 2400 nm (from Thuillier
et al., 2014). Upper panel shows SOLAR 2, SOLAR 2rev, SOLAR 1, SCIAMACHY2002,
and ATLAS 3’s spectra. Lower panel shows WHI, SRPM, SCIAMACHY2002, Arvesen, IRSPERAD, and ATLAS 3’s spectra added for comparison.
The deviations between ATLAS 3 and SOLAR 2rev brightness temperature are below 100 K up to 2000 nm. Longward 2000 nm the deviations increases up to 100K, likely because of the small signal to noise ratio in SOLAR 2rev and ATLAS3 spectra. Nevertheless, this difference is significantly smaller than the SOLAR 2 difference to ATLAS 3 brightness temperature. It is very important to note that ATLAS 3 and SOLAR 2rev are basically identical exactly in the region of the strongest deviations with SOLAR 2 (1700 nm).
The absorption coefficient of the negative ion of hydrogen has its minimum around 1600 nm (see e.g. Mihalas, 1978) so that measurements at this wavelength provide a unique opportunity to probe the deepest layers of the solar photosphere. Thus the comparison
between the IR measurements and model predictions is of particular interest for understanding the structure of the solar photosphere. Bolsée et al. (2014) note that recent semi-empirical models (Shapiro et al., 2010; Fontenla et al., 2011) indicate lower brightness temperatures of the IR irradiance than given by ATLAS 3. Indeed, according to the semi-empirical models, the solar brightness temperature around the opacity minimum at 1600 nm is approximately 100 K lower than given by ATLAS 3 and the deviation reaches 200 K around 2000 nm (see Figure 3). To some extent the disagreement between the semi-empirical models and
measurements may be attributed to the one-dimensional and static character of the semi-empirical models. The spatial bifurcations of the temperature and density in the solar photosphere (which increase in the amplitude towards the deeper layers, see e.g. Socas-Navarro, 2011) affect the radiative transfer in the solar atmosphere (e.g. Uitenbroek and Criscuoli, 2011; Holzreuter and Solanki, 2013; and references therein). Shapiro et al. (2010) used the temperature and density structure of the solar atmosphere by Fontenla et al. (1999). The photospheric layers of this model have been derived using the observed continua between 310 nm and 10 µm (see Fontenla et al., 1999), but the model cannot consistently reproduce the solar spectrum equally at all wavelengths (Uitenbroek and Criscuoli, 2011) so that the deviations at some wavelengths are possible and even expected. Interestingly, the infrared spectrum proposed by Bolsée et al. (2014), SOLAR 2, and SCIAMACHY2002 leads to a significantly higher disagreement with models than ATLAS3 over the entire IR spectrum range. For example the Bolsée et al. (2014) spectrum is 200 K below the semi-empirical models around the opacity minimum, and the deviations reach 350 K with respect to ATLAS 3. Thus, while the results of semi-empirical models must be treated with a certain degree of caution, there is noticeably better agreement between these models with ATLAS 3 than with the Bolsée et al. (2014) spectrum. Furthermore, the temperature increase near 1.6 µm is only about 300 K relative to the brightness temperature near 500 nm in these models, so a 300 K decrease in the IR would imply that the IR and visible are formed at nearly the same level in the photosphere. Such a result would contradict decades of research that have shown that the H− opacity in the solar atmosphere causes a peak brightness temperature near 1.6 µm.
Therefore, the higher IR irradiance values, such as ATLAS 3, are more consistent with the expected IR brightness temperature.
5.2 Consistency with the Total Solar Irradiance
Using WHI spectrum, the integral from the EUV to a given wavelength λup is calculated to
15
S(λup), varies as shown in Figure 7 (left panel). The integrated power difference between
ATLAS 3 and SOLAR 2 in the domain 1000-2400 nm is 19 Wm-2. As the TSI is known to be 1360.5 Wm-2 with an accuracy of 0.4 Wm-2 (Kopp and Lean, 2011), this loss would have to be compensated somewhere else in the spectrum. Likely, it is below 1000 nm. Let us assume that below λup, the SOLSPEC instrument measures x% greater than a perfectly calibrated
instrument. Then, we calculate the corresponding percentage (x%) between the lower wavelength and λup to be a total of 19 Wm-2. This calculation is shown in Figure 7 (right
panel).
Figure 7: The left panel shows the variation of the integrated WHI spectrum as a function of
λup. The right panel shows the percentage of systematic overestimation of SSI to represent
19Wm-2 as a function of λ up.
Figure 7 (right panel) shows that with 2% systematic uncertainty, the corresponding domain extends to 1000 nm. With 5% uncertainty, the corresponding domain extends to 400 nm. We note that WHI and SOLAR 1 are totally independent below 1000 nm and were independently calibrated. SOLAR 1 was calibrated using the blackbody at PTB. The portion of the WHI spectrum below 300 nm is derived from SOLSTICE which was calibrated at the Synchrotron Ultraviolet Radiation Facility (SURF) at the National Institute of Standards and Technology (NIST; McClintock, Snow, and Woods, 2005). The longer wavelength portion of the WHI spectrum (above 300 nm) is derived from SIM. The SIM characterization is
described in Harder et al. (2010). Absolute standards may differ, however, by no more than 1% in the visible range. Consequently, it is not plausible that these two instruments would
both be systematically wrong by 2% below 1000 nm or both systematically wrong by 5%
below 400 nm. In addition, three spectra independently calibrated in the absolute scale provide a power in the 300-800 nm range within 0.5%, which is fully compatible with their uncertainties affecting these measurements.
In addition, we present below, Table 3 extracted from Thuillier et al. (2014) showing the ratio between ATLAS 3 and WHI to SOLAR 1 (identical to SOLAR 2 in this range).
Table 3 Ratio of power per spectral ranges (first column) for ATLAS 3, WHI, to SOLAR 1
(from Thuillier et al., 2014). 1400 1200 1000 800 600 400 200 0 In te gr at ion ( ! up) 2500 2000 1500 1000 500 Wavelength (! up) 20 15 10 5 Pe rce ntag e 1000 800 600 400 200 Wavelength (nm)
Δλ (nm) ATLAS 3/SOLAR 1 WHI/SOLAR 1 210-350 1.057 1.003 350-500 0.996 0.989 350-850 1.001 0.993 220-260 1.086 0.977 260-300 1.029 0.971 300-340 1.080 1.024 340-370 1.031 1.008 350-425 0.987 0.979 425-500 1.014 1.007 500-575 1.023 1.032 575-650 0.993 0.987 650-725 1.012 0.991 725-800 1.064 1.041
For narrow spectral ranges the ratio changes from -2 to 8%, while for the large range 350-850, the ratio is the order of 0.1%. Consequently, assuming an existing systematic uncertainty of 2 % is not credible. This point is also supported by noting that the uncertainty of a given spectrum is not constant as a function of wavelength for several basic reasons:
- the calibration source power is not uniform with wavelength (e.g. Planck function), - a spectrometer also presents a responsivity, which is a function of wavelength,
- the detector also has a wavelength dependent efficiency
- some filters are also set/removed on the optical path to decrease/increase the signal. These elements have been applied to SOLSPEC-ISS by Bolsée (2012). Figures II.7.3.4.1-1 and II.7.3.4.1-2 from his thesis show:
In the range of 200-350nm, the background uncertainty is 4 %, increases at 10 to 15 % around 220 nm, with several peaks above 10 % at 265nm, and 280 nm, and increases in the range 350-370 nm from 10 to 65%. For the visible spectrometer, at 350 nm, the uncertainty is 6% and decreases afterward. Between 800 and 900 nm, the uncertainty increases from 3 to 10 %. Consequently, a constant uncertainty over the range 200-1000nm cannot explain the missing 19 Wm-2nm-1.
Another hypothesis would be to consider the power above 2400 nm. It is calculated using the Kurucz spectrum (1995) that is consistent with the observations of Kondratyev et al. (1965) in the 3-13 µm region accounting for a large fraction of the integrated irradiance of 52 Wm-2. As the solar spectrum can be represented by the Rayleigh-Jeans law as T λ-4, to retrieve the missing 19 W m-2 in that region implies that the temperature should increase by 19/52
(36%), i.e. about 2000 K, which is highly unlikely.
Consequently, the loss of power in the IR cannot be compensated by a systematic overestimation of the SSI above 2400 nm or below 1000 nm as such a systematic error is incompatible with the absolute calibration of the SORCE/SIM and SOLSPEC-ISS
instruments in the visible. This is an additional evidence that supports the higher IR irradiance value from ATLAS 3.
5.3 SCIAMACHY Spectra
SCIAMACHY is a spectrometer launched by ESA in 2002 onboard the ENVISAT satellite (Bovensmann et al., 1999). ENVISAT stopped operations in 2012, and provided valuable spectral measurements, which have been extensively used by the atmospheric science community.
17
SCIAMACHY was designed and built to measure several trace constituents in the terrestrial stratosphere and troposphere including aerosols and clouds. These measurements, obtained at the global scale, result from the comparison between the solar irradiance and the backscattered irradiance from the Earth as a function of wavelength. For that purpose, only a relative calibration is required. However, given the high quality of the measurements,
SCIAMACHY dataset has been pushed towards applications beyond its design. In particular, it has recently been used in the context of producing reference solar spectra in absolute scale. The caveat is that for achieving solar spectral irradiance measurements in the field of solar physics, it is necessary to calibrate the instrument in the absolute scale. Given the required calibration level was not performed before launch, different attempts based on a set of assumptions were made to provide SSI results from SCIAMACHY measurements: • Skupin et al. (2005) compared SCIAMACHY SSI with different spectra, in particular
with ATLAS 3 for the channel 6 (1000-1750 nm). They found a remarkable agreement with ATLAS 3 spectrum reporting the mean difference of 0.11% with a standard deviation of 2.8%.
• Pagaran et al. (2011) also performed similar studies with SORCE/SIM for data gathered on 21 April 2004. At this point, it is worth remembering that SIM used ATLAS 3 in the IR for normalization at the beginning of the SORCE mission. In the domain 800-1600 nm, the difference between SCIAMACHY and SIM (i.e. ATLAS 3) is only about 3%. The SCIAMACHY spectrum used in Pagaran et al. (2011) is referred as SCIAMACHY2004.
The SCIAMACHY2002 spectrum used by Bolsée et al. (2014) has not been published as of yet. Bolsée et al. (2014) do not provide any information about the origin of the
SCIAMACHY2002 spectrum used in their study and how the 2% absolute accuracy in the infrared was obtained. We cannot comment on either the accuracy of these data or on their calibration. While these data are different from Skupin et al. (2005) and Pagaran et al. (2011), to our knowledge no corrigendum to these two papers has been published yet.
During the development of the SOLSPEC spectrometer, we learnt a lot about the tungsten ribbon lamp properties. We came to the conclusion that such lamps are usable to monitor the instrument responsivity in space in the relative scale, but not for transferring the absolute scale from ground to orbit. Indeed, there is a heat leakage through the wiring depending of the lamp power supply environment, and a significant filament temperature increase when the lamp is filled with a noble gas (for limiting the tungsten sublimation) given the absence of internal convection. These effects cannot be numerically estimated with
precision in orbit.
While Skupin et al. (2005) and Pagaran et al. (2011) agree with ATLAS 3 within their quoted uncertainties, the new SCIAMACHY2002 data presented by Bolsée et al. (2014) agree with IRSPERAD and SOLAR 2 (see Figure 5).
Since SCIAMACHY2002 absolute calibration remains unclear, it is not possible to use this spectrum in the IR to draw any conclusion with respect to ATLAS 3. Consequently, in absence of a published or documented reference, the SCIAMACHY2002 spectrum is not considered further in this discussion. We simply note that its agreement with SOLAR 2 will lead to the same problem of brightness temperature and absolute calibration in the visible domain for SCIAMACHY as explained in Sections 5.1.
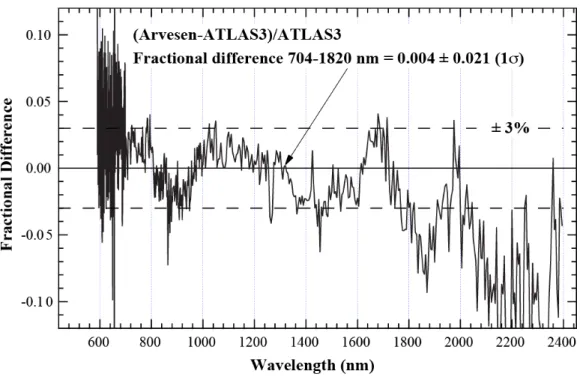
Another observation in support of the higher IR irradiance value is the work of Arvesen, Griffin, and Pearson (1969; hereafter Arvesen’s spectrum for short) who have carefully measured the IR spectrum from an airborne platform at an altitude of 11.6-12.5 km well above the aerosol and water vapour rich planetary boundary layer. Figure 8 shows the fractional difference with ATLAS 3 to within 3% up to 1800 nm. Above 1800 nm, the SSI becomes noisy, and the agreement declines due to uncorrected water vapour absorption residual as discussed below. Above 11.5 km altitude, the water vapour concentration is likely very small; however, the absorption coefficient of water vapour at 1800-1900 nm is large (twice the value at 1400 nm). Furthermore, for carrying out corrections, the quantity of water vapour needs to be known. This is a significant difficulty even today as the plane likely encountered different regions and wind regime during 11 flights with among them, 8 were above the ocean. As such information is not available, we have calculated the brightness temperature corresponding to the Arvesen’s spectrum. It had been added to Figure 6 showing the temperature brightness derived from all spectra considered in this study. Between 1000 and 1700-1800 nm, the brightness temperature of Arvesen’s spectrum is in agreement with all spectra except with SOLAR 2, IRSPERAD and SCIAMACHY2002. Above 1800 nm, it is in disagreement with all spectra due to excessive water vapor absorption. This is why Arvesen’s spectrum above 1800 nm cannot be considered as a support of SCIAMACHY2002 and IRSPERAD in the IR domain above 1800 nm.
Arvesen’s spectrum, which is in agreement with ATLAS 3, is associated with a TSI of 1390 Wm-2. As the TSI is now known to be about 1360 Wm-2, Bolsée et al. (2014) interpret the discrepancy of these two TSI values as supporting an incorrect SSI (i.e. too high) and consequently a wrong SSI ATLAS 3. This approach is incorrect since Arvesen’s spectrum is not valid above 1800 nm, which makes it necessary to use a model spectrum to integrate the SSI above 2500 nm. Arvesen’s landmark experiment was conducted prior to the start of extra-atmospheric measurements of TSI and his reported integrated TSI value does not exceed his uncertainty estimate. Consequently, the uncertainty associated with this calculation cannot support any notion for the validity of any spectrum using such a method. Moreover, Arvesen’s spectrum is systematically greater than ATLAS 3 in the visible part of the spectrum. ATLAS 3, WHI, and SOLAR 1 are three spectra independently calibrated. The power calculated with these three spectra in the domain 300-800 nm agree within 0.5%. Calculating in this range the power with Arvesen’s spectrum provides a higher value of 23 Wm-2 with respect the ATLAS 3, WHI, and SOLAR 1. Consequently, the 30 W m-2 claimed by Bolsée et al. (2014) is simply explained by a contribution of 23 Wm-2 in the 300-800 nm
19
Figure 8: Fractional differences of Arvesen’s IR spectrum relative to ATLAS 3. 5.5. Ground-Based IR Measurements
5.5.1 Atmospheric Conditions at Izaña and Camborne Stations
We discuss below the recent measurements carried out by Menang et al. (2013) and Bolsée et
al. (2014).
The solar measurements conducted by Menang et al. (2013) present interesting features of the atmospheric conditions at the Camborne (50.22°N, 5.33°W, 88 m altitude, west of Cornwall, UK) station. Two datasets were obtained with an instrument located about 9 km away from the sea. These two datasets were obtained on 22 August and 18 September 2008 in two different meteorological conditions shown in Table 4.
Table 4: Conditions of measurements of the CAVIAR spectrum by Menang et al. (2013).
2008 Dates Atmospheric characteristics 10:00 13:00 16:00 19:00 22 August Cloud (%) Wind direction Wind velocity (km h-1) Local humidity (%) 26 NNW 22.5 80 13 NNW 22.5 73 5 NW 25.7 73 5 NW 25.7 75 18 September Cloud (%) Wind direction Wind velocity (km h-1) Local humidity (%) 13 ENE 12.9 77 17 NE 6.4 74 6 NE 1.6 74 10 NNW 9.6 79
The CAVIAR SSI measured on 18 September is greater by 5% as a mean than the SSI on 22 August. Table 4 shows that local humidity is comparable for these two days, and may not play in any case a significant role given the measurements were made outside the water absorption bands in the IR domain. The first day is characterized by a higher wind than the
second day, and a wind direction with a west component while the second day the wind direction has an east and north component. A map of west Cornwall shows that the measurement site is located at about 9 km from the sea and suggests that marine aerosols could influence the observing conditions due to the wind direction and its velocity. We note that the change of 5% can be induced by wind transporting marine aerosols and likely
additional scattering by water vapour on 22 August (wind from the NW), which are likely less abundant on 18 September (wind from the NE and weaker). The Menang et al. (2013) article conclude their work by presenting two spectra: A high resolution spectrum where the water vapour absorption domains are filled with a high resolution theoretical spectrum and their original spectrum normalised on ATLAS 3, which could be interpreted as a tacit
acknowledgment of the difficulty to correct ground-based measurements at the ultimate few percent accuracy, and because this solar spectrum is widely accepted as a reference solar spectrum as stated in their own conclusion.
Table 5: Meteorological conditions of Bolsée et al.’s (2014) measurements at the Izaña
station (Spain). Water vapour content along the line of sight is obtained by the Cimel sunphotometer. They are not monotonous with time.
2011 dates Atmospheric conditions 09:00 12:00 15:00 18:00 1 June Cloudiness (%) Wind direction Wind velocity (km h-1) Local humidity (%) Water vapour (cm) 12 NE 29 79 0.68 7 NE 24 71 0.74 4 NE 22.5 71 0.79 6 NNE 24 74 0.73 2 June Cloudiness (%) Wind direction Wind velocity (km h-1) Local humidity (%) Water vapour (cm) 13 NNE 21 71 0.53 17 NNE 21 70 0.48 6 N 19.3 72 0.44 10 N 21 77 0.57 4 June Cloudiness (%) Wind direction Wind velocity (km h-1) Local humidity (%) Water vapour (cm) 26 N 19.3 76 0.60 12 N 17.7 71 0.70 2 N 21 69 no data 2 N 25.7 71 no data 5 June Cloudiness (%) Wind direction Wind velocity (km h-1) Local humidity (%) Water vapour (cm) 13 S 21 75 0.23 6 S 19.3 70 0.18 4 S 21 69 0.4 3 E 25.7 71 no data
As only the best measurements are reported, it is not possible to estimate an effect on SSI as a function of meteorological conditions.
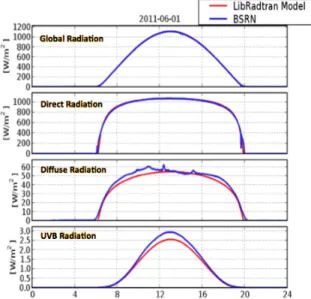
Tables 4 and 5 show comparable local humidity and cloudiness. This may contribute to understanding why the two SSI measurements are close as we assume no significant instrumental problems. At the island of Tenerife, whatever the wind direction is, it may transport aerosols, except when null, which is not the case here. The diffuse radiation obtained from pyranometers operated at Izãna shows variation with time as displayed in
21
Figure 8 for day 1 of June while the aerosol optical depth (AOD) was very weak (lower than 0.01). However, the AOD was reaching 0.01 on 4 June.
Figure 9: Pyranometers data for one of the best days used to obtain IRSPERAD. These
pyrometers are operated by the World Radiation Monitoring Center-Baseline Surface Radiative Network (WRMC-BSRN) allow to chracterize the local atmospheric conditions at the Izaña station.
Bolsée et al. (2014)’s spectrum is in agreement with CAVIAR because both were correctly measured from ground but they could be below space-based solar irradiance
measurements due to some additional atmospheric absorption (Figure 9, diffuse component). Using different information for characterizing the local atmosphere conditions, an estimate of the atmosphere effect on the measurement is made below.
The data recorded with a sunphotometer produced by Cimel indicates a mean AOD at Izãna of 0.005, reaching sometimes 0.01. Using the (Tropospheric Ultraviolet-Visible) TUV model (Madronich and Flocke, 1998; Perrin et al., 2005), and the mean AOD value, we have
calculated the absorption and scattering of the solar radiation due to the aerosols and we find a decrease of 0.45 % in the range 1610-1690 nm. Furthermore, the water vapour content varies non-uniformly during the day. Using the TUV model and a water vapour column of 0.74 cm (1 June at 12:00) measured by the Cimel instrument, the diffuse effect (not the absorption) generates a decrease of 0.55% of the measured irradiance along the line of sight. The cloudiness reported in the meteorological conditions at Izãna is difficult to assess because cloud location and its nature are not precisely known. The statement “no cirrus” in the instrument field of view is difficult to assess since only in situ LIDAR is able to detect these sub-visible clouds. Furthermore, detection along the Sun-instrument direction is very
challenging. Local sub-visible and visible cirrus as suggested by cloudiness (Table 2) and assumed to be located in the field of view of the instrument would generate an upper limit absorption reaching 0.6 %. In addition to these aerosol and cloud effects, Shaw et al. (1976) identify a 0.5% uncertainty associated with diurnal variations of atmospheric absorbents.
5.5.2 Ground-Based Measurements
There are additional factors that suggest that the Bolsée et al. (2014) solar IR measurement uncertainty could be higher than their claim of 0.5% to 1%. Bolsée et al. (2014) claim that the
accuracy of the absolute calibration of the IRSPERAD for wavelengths greater than 1000 nm is between 0.5% and 1%. We find this estimate to be surprising since SOLSPEC was
calibrated with the same source providing consistent SSI with WHI whose accuracy is
estimated to be 4% by Harder et al. (2010) for the interval 1000-1350 nm (further above, it is scaled on ATLAS 3), for the same conditions (distance, blackbody temperature, and its stability, etc.) even after a long integration time (Thuillier et al., 2009).
Furthermore, Bolsée et al. (2014) wrote “We noticed that for all recent experiments, either ground-based or from space, the respective spectra show similar deviations with respect to the ATLAS 3 spectrum around 1.6 µm, even though they were measured by independent instruments and with different methodologies.” We are completely at a loss as to how Bolsée et al. (2014) reached this conclusion. There are two space experiments
measuring irradiance at 1.6 µm: SOLAR 2, and SCIAMACHY. SIM measures up to 2400
nm; however it uses ATLAS 3 for the IR calibration above 1350 nm (Harder et al., 2010) and thus is in agreement above with ATLAS 3 by design. At the same time we have shown that SOLAR 2 suffers from an unstabilized regime at first light. The published version of
SCIAMACHY data (Skupin et al., 2005; Pagaran et al., 2011) are in agreement with ATLAS 3, while the origin of the SCIAMACHY2002 spectrum presented by Bolsée et al. (2014) is unclear on its calibration reference so that we cannot comment on it. Furthermore, Arvesen’s spectrum taken from an airplane also agrees with ATLAS 3 up to 1800 nm within 3%. As for the ground-based spectra there can be residual atmosphere absorption and aerosol scattering that consequently can make ground measurements necessarily lower than the space
measurements. This is why such measurements can be close to a lower SSI value as SOLAR 2, at the level of 6- 8% by taking into account all uncertainties affecting the difference between IRSPERAD to ATLAS 3. We also note that theoretical spectra (Fontenla et al., 2011; Shapiro et al., 2010) are in noticeably better agreement with ATLAS 3 than with IRSPERAD and CAVIAR-ESS.
The solar atmosphere temperature structure has an increase of brightness temperature near 1.6 µm of about 300 K relative to the brightness temperature near 500 nm. The
IRSPERAD infrared irradiance would reduce the IR brightness temperature by about 300 K making the IR and visible at nearly the same level in the photosphere. Such a result would contradict the research showing that the H− opacity in the solar atmosphere causes a peak brightness temperature near 1.6 µm. Therefore, the higher IR irradiance values, such as ATLAS 3, are more consistent with the expected IR brightness temperature.
6 Conclusions
An investigation of the SOLSPEC-ISS measurements revealed an IR spectrometer behavior in flight which has not been taken into account in the publication of the SOLAR 2 spectrum (Thuillier et al., 2014). This paper presents a methodology that corrects for this factor and demonstrates that the previously noticed deviation between ATLAS 3 and the published SOLAR 2 is reconciled by the new treatment of the instrument response at the first light when the IR spectrometer had not reached its permanent regime.
We presented evidence that the claimed uncertainties of the IRSPERAD are too small. A difference of 7% (at 1700 nm) of the ground-based observations to ATLAS 3 can be explained by a combination of several sources of the uncertainty, including the inevitable small remaining absorption and error generated by the total absorbing species concentration varying with time. We emphasize that the IRSPERAD spectrum is not the spectrum that has been measured on ground but has been extrapolated to remove the absorption of the terrestrial
23
atmosphere. The bases of the extrapolation (hypothesis of the Bouguer-Langley method) are stable atmosphere properties over a day, which is unlikely to ever be the case.
A lower value of the IR irradiance appears to be incompatible with the measurements of the TSI because an additional 19 Wm-2 would be needed in other parts of the solar
spectrum to account for the deficit. The most likely contribution of additional irradiance would need to occur in the visible. An increase by 2% originating from a systematic
uncertainty up to 1000 nm is not consistent with the accuracy in the visible reported by WHI, SOLAR 1, and SCIAMACHY 2004 (Skupin et al., 2005; Pagaran et al., 2011) as well as because it is known to be a function of wavelength.
The Tenerife and ATLAS 3 spectra are compatible if an appropriate uncertainty analysis is made. Nonetheless, the higher IR irradiance levels are supported better from the viewpoint of solar physics (IR brightness temperature), the summation of the solar spectrum agrees with the TSI level, and the comparison of solar spectral irradiance models.
This result is highly relevant for the atmosphere and climate science communities which rely on guidance for the adoption of solar spectral irradiance reference standards for different applications. Furthermore, the results presented here increases the level of maturity of the SOLSPEC solar spectral measurements and significantly contributes to its
establishment as climate data record. Work will continue to process the entire SOLSPEC dataset and make it available to the science community.
An important consequence of this study is that the calibration coefficients determined at PTB are correct if applied when the instrument comes to stabilization.
Ground measurements have the advantage of a tight instrument control; however, the transparency of the atmosphere cannot be compared to the solar viewing conditions in space. In orbit, we have the opposite conditions, as instruments cannot be easily controlled while there is no absorption along the line of sight. Despite these difficulties a space mission is in preparation for IR SSI measurements, which shows that ground-based measurements, with all its advantages, cannot meet the required accuracy of SSI measurements for solar,
atmospheric, and climate physics.
In summary, we note that the lower IR irradiance proposed by Bolsée et al. (2014) is incompatible with the accuracy in the IR domain of ATLAS 3, with SORCE/SIM (1000-1350 nm), with SOLSPEC-ISS after its stabilization (SOLAR 2rev), with the TSI present
measurements, and with the solar modelling.
Acknowledgment:
The SOLSPEC investigation is supported by the Centre National d'Etudes Spatiales (France), the Centre National de la Recherche Scientifique (France), the Federal Office for Scientific, Technical and Cultural Affairs (Belgium), and the Bundesministerium für Forschung und Technologie (Germany). The participating institutes are the Service d'Aéronomie du CNRS, now LATMOS, the Institut d'Aéronomie Spatiale de Belgique, and the Landessternwarte of Heidelberg. The SOLSPEC absolute calibration has been carried out with the blackbody BB3200g from the Physikalisch-Technische Bundesanstalt (PTB, Braunschweig, Germany). SOLSPEC constitutes an equipment of the external SOLAR payload of the ESA Columbus Laboratory placed onboard the International Space Station. The SOLAR operations are conducted by the Belgium User Support Operations Center (B-USOC) via the COLUMBUS
Control Center of DLR (Oberpfaffenhofen, Germany). We thank the World Radiation
Monitoring Center-Baseline Surface Radiative Network (WRMC-BSRN) for providing access to the local atmospheric data at the Izaña station. J. Harder, T. Woods, and M. Snow are supported by NASA contract NAS5-97045. The authors thank Vanessa George (LASP) for her support in document preparation.
References
Arvesen, J. C., Griffin, R. N., Jr., Pearson, B. D., Jr.: 1969, Appl. Opt. 8, 2215. doi : 0.1364/AO.8.002215.
Bolsée, D.: 2012, Métrologie de la Spectrophotométrie Solaire Absolue : Principes, Mise en œuvre et Résultats. Instrument SOLSPEC à bord de la Station Spatiale Internationale. Ph.D. Thesis, Free University of Brussels.
Bolsée, D., Pereira, N., Decuyper, W., Gillotay, D., ·Yu, H., Sperfeld, P., et al.: 2014, Solar
Phys. 289, 2433. doi: 10.1007/s11207-014-0474-1.
Bovensmann, H., Burrows, J. P., Buchwitz, M., Frerick, J., Noel, S., Rozanof, V. V., Chance, K. V., Goede, A. P. H.: 1999, J. Atmos. Sci. 56, 127. doi:10.1175/1520-0469.
Harder, J. W., Thuillier, G., Richard, E. C., Brown, S. W., Lykke, K. R., Snow, M.,
McClintock, W. E., Fontenla, J. M., Woods, T. N., Pilewskie, P.: 2010, Solar Phys. 263, 3. doi: 10.1007/s11207-010-9555-y.
Holzreuter, R., Solanki, S. K.: 2013, Astron. Astrophys. 558, A20. doi: 10.1051/0004-6361/201322135.
Fontenla, J., White, O. R., Fox, P. A., Avrett, E. H., Kurucz, R. L.: 1999, Astrophys. J. 518, 480, doi:10.1086/307258.
Fontenla, J. M., Curdt, W., Haberreiter, M., Harder, J. Tian, H.: 2009, Astrophys. J., 707, 482. doi:10.1088/0004-637X/707/1/482.
Fontenla, J. M., Harder, J., Livingston, W., Snow, M., Woods, T.: 2011, J. Geophys. Res. 116, D20108, doi:10.1029/2011JD016032.
Kondratyev, K. Y., Andreev, Badinov, I. Y., Grishechkin, V. S. Popova, L. V.: 1965, Appl.
Opt. 4, 1069.
Kopp, G., Lean, J. L.: 2011, Geophys. Res. Lett. 38, L01706. doi:10.1029/2010GL045777. Kurucz, R. : 1995, CD Rom # 23,Smithonian Astrophys. Obs.
Madronich, S.,Flocke, S.: 1998, In: Boule, P. (ed.), Handbook of Environmental Chemistry, Springer, Heildelberg, pp.1-26.
McClintock, W. E., Snow, M., Woods, T. N.: 2005, Solar Phys. 230, 259. doi: 10.1007/s11207-005-1585-5.
Menang, K. P., Ptashnik, I. V., Coleman, M. D., Gardiner, T. D., Shine, K. P.: 2013, J.
25
Mihalas, D.: 1978, Stellar Atmospheres, 2nd edn, Freeman and Company, 108.
Noël, S., Kokhanovsky, A. A., Jourdan, O., Gerilowski, K., Pfeilsticker, K., Weber, M., Bovensmann, H., Burrows, J. P.: 2007, In: Danesy, D. (ed.), Proc. Third Workshop on the
Atmospheric Chemistry Validation of ENVISAT 3 (ACVE3), ESA SP-642, on CDROM.
Pagaran, J., Harder, J. W., Weber, M., Floyd, L. F., Burrows, J. P.: 2011, Astron. Astrophys.
528, A67. doi:10.1051/0004-6361/201015632.
Perrin, J-M., Thuillier, G., Fehrenbach, M., Huppert, F.: 2005, J. Atmos. Solar-Terr. Phys. 67, 449. doi. 10.1016/j.jastp.2004.11.010.
Rottman, G.: 2005, Solar Phys. 230, 7. doi:10.1007/s11207-005-8112-6.
Schmidtke, G., Brunner, R., Eberhard, D., Halford, B., Klocke, U., Knothe, M., Konz, W., Riedel, W.-J., Wolf, H.: 2006, Adv. Space Res. 37, 273. doi:10.1016/j.asr.2005.01.112. Schmidtke, G., Nikutowski, B., Jacobi, Ch., Brunner, R., Erhardt, Ch., Knecht, S., Scherle, J., Schlagenhauf, J.: 2014, Solar Phys., 289, 5, 1863. doi:10.1007/s11207-013-0430-5..
Shaw, G. E.: 1976, Pure Appl. Geophys. 114, 1.
Skupin, J., Noël, S., Wuttke, M. W., Gottwald, M., Bovensmann, H., Weber, M., Burrows, J. P.: 2005. Adv. Space Res. 35, 370. doi: 10.1016/j.asr.2005.03.036.
Shapiro, A. I., Schmutz, W., Schoell, M., Haberreiter, M., Rozanov, E.: 2010, Astron.
Astrophys. 517, A48. doi:10.1051/0004- 6361/200913987.
Socas-Navarro, H.: 2011, Astron. Astrophys. 539, A37, 10. doi: 10.1051/0004-6361/201015805.
Thuillier, G., Floyd, L., Woods, T.N., Cebula, R., Hilsenrath, E., Hersé, M., Labs, D.: 2004, In: Pap, J., Fox, P., Frohlich, C., Hudson, H.S., Kuhn, J., McCormack, J., North, G., Sprigg, W., Wu, S.T. (eds.), Solar Variability and its Effect on Climate, AGU Geophys. Monogr. 141, 171. doi: 10.1029/141GM13.
Thuillier, G., Foujols, T., Bolsée D., Gillotay, D., Hersé, M., Peetermans, W., et al.: 2009,
Solar Phys. 257, 185. doi: 10.1007/s11207-009-9361-6.
Thuillier, G., Bolsée, D., Schmidtke, G., et al.: 2014, Solar Phys. 289, 1931. doi: 10.1007/s11207-013-0461-y.
Uitenbroek, H., Criscuoli, S.: 2011, Astrophys. J. 736, 69. doi:10.1088/0004-637X/736/1/69. Woods, T. N., Chamberlin, P. C., Harder, J. W., Hock, R. A., Snow, M., Eparvier, F. G., Fontenla, J., McClintock, W. E., Richard, E. C.: 2009, Geophys. Res. Lett. 36, L01101. doi:10.1029/2008GL036373.