HAL Id: ird-01006385
https://hal.ird.fr/ird-01006385
Submitted on 16 Jun 2014
HAL is a multi-disciplinary open access
archive for the deposit and dissemination of sci-entific research documents, whether they are pub-lished or not. The documents may come from teaching and research institutions in France or abroad, or from public or private research centers.
L’archive ouverte pluridisciplinaire HAL, est destinée au dépôt et à la diffusion de documents scientifiques de niveau recherche, publiés ou non, émanant des établissements d’enseignement et de recherche français ou étrangers, des laboratoires publics ou privés.
Geometric morphometrics, Fourier analysis of otolith
shape, and nuclear-DNA markers distinguish two
anchovy species (Engraulis spp.) in the Eastern
Mediterranean Sea
Arzu Karahan, Philippe Borsa, Ali Cemal Gucu, Irfan Kandemir, Emel
Ozkan, Yasim Ak Orek, Sinan Can Acan, Evren Koban, Inci Togan
To cite this version:
Arzu Karahan, Philippe Borsa, Ali Cemal Gucu, Irfan Kandemir, Emel Ozkan, et al.. Geometric morphometrics, Fourier analysis of otolith shape, and nuclear-DNA markers distinguish two anchovy species (Engraulis spp.) in the Eastern Mediterranean Sea. Fisheries Research, Elsevier, 2014, 159, pp.45-55. �ird-01006385�
1 To be cited as:
Karahan A., Borsa P., Gucu A.C., Kandemir İ., Ozkan E., Ak Örek Y., Can Acan S., Koban E., Togan I. (2014) Geometric morphometrics, Fourier analysis of otolith shape, and nuclear-DNA markers distinguish two anchovy species (Engraulis spp.) in the Eastern Mediterranean Sea. Fisheries Res. 159, 45-55.
Geometric morphometrics, Fourier analysis of otolith shape, and nuclear-DNA markers distinguish two anchovy species (Engraulis spp.) in the Eastern Mediterranean Sea
Arzu Karahan a,*, Philippe Borsa b, Ali Cemal Gucu a, İrfan Kandemir c, Emel Ozkan d, Yesim Ak Örek a,
Sinan Can Acan f, Evren Koban e, Inci Togan f
a Middle East Technical University, Institute of Marine Science, Department of Biology, Mersin, Turkey b Institut de recherche pour le développement, Montpellier, France
c Ankara University; Faculty of Science, Department of Biology, Ankara, Turkey
d Namik Kemal University, Agriculture Faculty, Department of Animal Science, Tekirdağ, Turkey e TUBITAK Marmara Research Center, Genetic Engineering and Biotechnology Institute, Gebze,
Kocaeli, Turkey
f Middle East Technical University, Department of Biology, Ankara, Turkey
* Corresponding author. Tel.: +90 532 6462547, E-mail address; arzukarahan@ims.metu.edu.tr or arzuukarahan@gmail.com
2
ABSTRACT
Two anchovy forms identified from their external morphology and designated as ‘Silver’ and ‘Blue’ anchovies were captured in Mersin Bay (Eastern Mediterranean Sea). Silver anchovy seemed to inhabit shallower waters (9-77 m) than Blue anchovy (majority at depths of 69-111 m). Significant differences in body shape, which was analyzed through geometric morphometrics, and in otolith shape, examined using Fourier analysis, separated the two forms. Length polymorphisms at two intron and 9 microsatellite loci showed strong genetic differences between the two forms. Mersin-Bay Blue anchovy were genetically related to Engraulis encrasicolus from the Western Mediterranean Sea. Mersin-Bay Silver anchovy possessed an original genetic composition that distinguished them from both E. encrasicolus and E. albidus at the two intron loci, while presenting affinities to E. albidus based on microsatellite markers. Mersin-Bay Silver anchovy were assigned to the latter species, of which they are considered as a geographically isolated population. This is the first record of E. albidus in the Levantine basin and confirmation of its presence in the Eastern Mediterranean Sea. These results have implications for the management of anchovy populations and their habitats.
3
1. Introduction
The degree of geographic isolation among European anchovy populations has been addressed through a number of population genetic and phylogeographic studies (Spanakis et al., 1989; Bembo et al., 1996a, b; Magoulas et al., 1996; Magoulas et al., 2006; Bouchenak-Khelladi et al., 2008; Kristofferson and Magoulas, 2008; Erdogan et al. 2009). Complex patterns of geographical structure in the European anchovy have been revealed, where the level of genetic differentiation between inshore and offshore forms within a basin (e.g. Western Mediterranean Sea) exceeds that within the offshore form at the scale of the whole Mediterranean Sea (Borsa, 2002; Grant, 2005; Bouchenak-Khelladi et al., 2008).
It has been hypothesized that the remarkable degree of anchovy population genetic structure in the Mediterranean Sea derives from its higher geographic and oceanographic complexity relative to other regions (Grant, 2005). While such extrinsic barriers to gene flow likely determine part of the genetic differences between anchovy populations, intrinsic (reproductive) barriers have also been documented (Borsa, 2002). Restriction in gene flow between two habitat-specific forms sampled locally in a context where the anchovy form inhabiting the pelagic habitat shows relative genetic homogeneity over a broad geographical range (the Mediterranean Sea), indicates
reproductive isolation between the two forms. This has led Borsa et al. (2004) to distinguish the two forms as different species, where Engraulis albidus is the species inhabiting the inshore waters of the north Western Mediterranean Sea and presumably the northern Adriatic Sea, and E.
encrasicolus is the species inhabiting the pelagic waters of the north Western Mediterranean Sea. Two genetically distinct forms also co-occur in the Bay of Biscay, where they segregate according to habitat (Zarraonaindia et al., 2012) and where distinct coastal and oceanic spawning areas have been reported (Motos et al., 1996). Some of the populations sampled in the Bay of Biscay are genetically closer to some populations from the Mediterranean Sea than to adjacent populations in the northeastern Atlantic (Zarraonaindia et al., 2012). Kristofferson and Magoulas (2008) have compared anchovy populations from the central Aegean Sea, the Ionian Sea, the Adriatic Sea and the Gulf of Lions with regard to mtDNA clade proportions, nuclear allele frequencies, body shape and otolith shape. They concluded that several reproductively isolated anchovy populations also exist in the western and central regions of the Eastern Mediterranean Sea.
Using morphometric characters, Turan et al. (2004) reported dissimilarity among the anchovy populations inhabiting the eastern Levantine basin and those found in the Black Sea and the Aegean Sea. However, the authors did not consider possible dissimilarities within regions.
In the present study, two anchovy forms distinct by their general appearance and colour were sampled in Mersin Bay (northeastern area of the Eastern Mediterranean Sea). The morphology of individuals was examined using geometric morphometric analysis, and otolith shape was described using Fourier analysis. The aim of this study was to determine whether the morphological
differences between the two forms reflected genetically distinct populations, so the two forms were further characterized by their allelic composition at nuclear genetic markers. The two forms were further compared to reference samples of E. albidus and E. encrasicolus from the Western
4
Mediterranean Sea to determine their genetic relationships to either species.
2. Materials and methods
2.1. Study site and samples
Mersin Bay, in the Levantine basin, Eastern Mediterranean Sea (36°31’N-36°48’N; 34°13’E-34°44’E) (Fig. 1) is a potentially important area for commercial fisheries (Abdulla et al., 2008). Two hundred and twenty nine anchovy were collected by trawling in Mersin Bay (Fig. 1) in June 2010, from the research vessel Lamas of the Middle East Technical University, Institute of Marine Sciences, Mersin, Turkey. Anchovy were visually sorted into two groups according to their external characteristics by the fisheries scientists present on board: a proportion of individuals possessed a slender and rounded body shape, with a firmer body and a darker (blue) back than the other individuals, which were generally paler with a well-delineated longitudinal silver stripe along the flank (Fig. 2), and with a broader belly and a softer texture. Hereafter, the two forms will be referred to as “Blue” and “Silver” anchovies, respectively. Blue anchovies (Fig. 2a) were captured above the bottom at depths between 9 - 111m (the majority occurring between 69 -111m) whereas Silver anchovies (Fig. 2b) were caught in the inshore waters of northeastern Mersin Bay, at depths of 9 m -77 m. Immediately after collection, the anchovy were frozen at -20°C, shipped to the Middle East Technical University Institute of Marine Sciences, Mersin and kept frozen until processed. Ninety three Blue anchovy and 136 Silver anchovy were used for geometric morphometric analysis; 22 Blue anchovy and 20 Silver anchovy were used for Fourier analysis of otolith shape; and 48 individuals randomly selected from each form were used for analysis of genetic variation. Genetic analyses were carried out in the population genetics laboratory of the Middle East Technical University, Ankara.
Anchovy samples from Annaba, Algeria (sample Ann; N=15), from the Benguela current system, southern Africa (Ben; N=15), and from Cul-de-Beauduc (Cul; N=7) and Sète (Set; N=15) both located in the northern region of the Western Mediterranean Sea [i.e. subsamples of, ANN, BEN, CUL and SET samples respectively of Bouchenak-Khelladi et al. (2008)] were used as reference samples for genetic comparison. The CUL sample consists of reference material for E. albidus while the SET sample consists of E. encrasicolus specimens. Cul-de-Beauduc and Sète are the respective type localities of these two species (Borsa et al., 2004).
2.2. Analysis of body shape by geometric morphometrics
Geometric morphometrics is based on body landmarks. Differences in the relative positions of landmarks indicate differences in shape between specimens (Bookstein, 1991). The geometric morphometrics method involves five steps: (1) capturing the images of individuals; (2) quantifying shape by digitization of landmarks on the images using the TPS software (Rohlf, 2001); (3)
5
variables using principal component analysis (PCA) (Pearson, 1901) and discriminant analysis (DA) (Lebart et al., 1997). Procrustes superimposition consists of translating the configurations defined by the raw coordinates to a common centroid, scaling to unit centroid size, and rotating until the sum of the squared distances between corresponding landmarks is minimized (Rohlf and Slice, 1990). General Procrustes analysis and digitization of deformation grids (Bookstein, 1989) for 20 landmarks on Blue and Silver anchovy samples were run using the Morpho-J, version 1.02d software (Klingenberg, 2011). Deformation grids, which employ the Procrustes distance as a metric, provide a visually interpretable description of deformation, with the same number of variables as there are statistical degrees of freedom.
Principal component analysis was run using PAST version 2.01 (Hammer et al., 2001).
Discriminant analysis was run on the Procrustes coordinates for body shape, using cross-validation to assess the effectiveness of the algorithm (Polly and Head, 2004). To mitigate possible effects of allometric growth, only adult specimens were measured.
The left side of each individual was photographed with a digital Olympus C-7070 camera (image resolution: 7.1 megapixels) (Fig. 2a,b). Twenty landmarks (Fig. 2c) were digitized from each photograph using the TpsDig version 2.12 software. The X-Y coordinates of the landmarks were recorded. Sex was determined from the visual aspect of the gonads, which were examined after the individuals had been photographed.
2.3. Fourier analysis of the outline of otoliths
The outlines of the images of otoliths (sagittae) of 1+ year-old Blue (N=15) and Silver
(N=12) anchovies, and those of 2+ year-old Blue (N=7) and Silver (N=8) anchovies were subjected
to Fourier analysis. Both left and right sagittae were extracted, cleaned, and photographed under a dissecting microscope (Olympus SZx12) using an Olympus C-7070 camera. The age (in years) of each individual was estimated from the number of translucent zones in the sagittae, under the assumption that a translucent zone represents the winter season (Waldron, 1994). Variation in otolith shape was assessed using elliptical Fourier analysis (Kuhl and Giardina, 1982; Ferson et al., 1985). The outline of the otolith was traced using the softwares tpsDig2 and EFAWin (Rohlf, 1993; Isaev, 1995). The x- and y- coordinates of 120 landmarks were obtained from points equally spaced along the otolith’s outline using tpsDig2. Next, a set of harmonics that describe the shape of the otolith was produced using EFAWin. Twenty one harmonics were used to obtain a good balance between the ratio of sample size to the number of variables, and the accuracy of the description of otolith shape (Fig. 3). The harmonics were made invariant to otolith size, rotation, and starting position of the tracing of the outline (Ferson et al., 1985; Kristofferson and Magoulas, 2008). Principal component analysis was run using the EFAWin scores with the PAST statistical program. The generalized Mahalanobis distance (Mahalanobis, 1936) was used to estimate differences in otolith shape among anchovy populations. Mahalanobis distances were computed using Morpho-J. Canonical discriminant analysis (CDA) was run under SYSTAT v. 12.02.00 to estimate differences in otolith shape between age groups of Blue and Silver anchovies.
6 2.4. Genetic analyses
Genomic DNA was extracted from 100 mg muscle tissue using the CTAB protocol (Stewart and Via, 1993). The amount of DNA from each sample was subsequently quantified by
spectrophotometry. Individuals were genotyped at 12 size-polymorphic nuclear loci, including two introns and 10 microsatellites (Appendix A). The forward primers were fluorescently labeled with HEX, TAMRA or FAM. The quality of the PCR amplifications was checked by subjecting the PCR products to electrophoresis in 0.8-4 % agarose gels. Allele size was determined in an ABI-PRISM 3100 sequencer (Applied Biosystems, Foster City CA, U.S.A.). Raw data from the sequencer were processed with the PEAK SCANNER1.0 software for peak identification and fragment sizing (Applied Biosystems).
Expected heterozygosity (He: Nei, 1978) and observed heterozygosity (HO) were calculated
using GENETIX v.4.05.2 (Belkhir et al., 2000). Allelic richness (AR) and the inbreeding coefficient (f; Weir and Cockerham, 1984) were estimated using FSTAT v. 2.9.3.2(Goudet, 2002). Genetic
differentiation between samples was estimated as Weir and Cockerham’s (1984) θ using GENETIX. The Bonferroni correction (Rice, 1989) was applied for multiple tests. The presence and frequency of null alleles was tested using the expectation maximization algorithm of Dempster et al. (1977) implemented in FreeNA (Chapuis and Estoup, 2007). The null hypothesis of Hardy-Weinberg equilibrium at a locus was tested by using the GENEPOP version 4.1.1. (Raymond and Rousset, 1995: Rousset, 2008) which implements Fisher’s exact test for multiple alleles (Guo and Thompson, 1992). Outlier f values were detected using Minitab v.16.0 (Minitab Inc., 2010). A value was
considered to be an outlier when it lay outside the interval delimitated by one interquartile subtracted from and added to the values of the first and third quartiles respectively.
Bayesian structure analysis was run using the clustering algorithm implemented in the software STRUCTURE 2.1 (Pritchard et. al., 2000; Falush et al., 2007). The number of populations assumed by STRUCTURE is K, each of which is in the Hardy-Weinberg and linkage equilibrium and characterized by a set of allele frequencies. To estimate the assignment of each individual to a cluster, ten replicate simulations were run for each prior value of K in the total sample. K was allowed to range from 2 to 7, using 10,000 burn-in repetitions and a final run of 100,000
Markov-chain-Monte Carlo steps under an admixture model with independent allele frequencies. The CLUMPP software (Jakobsson and Rosenberg, 2007) was used to calculate similarity
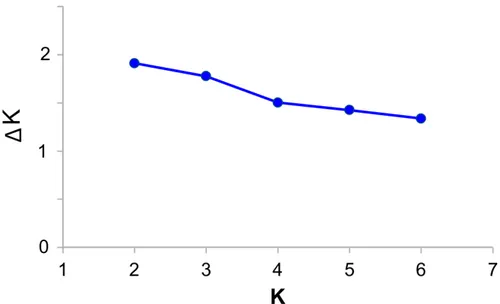
coefficients. To determine the actual number of populations, we used Evanno et al.’s (2005)
method, which checks the second-order rate of the likelihood function (ΔK = mL"(K)/ sL(K)) (where mL”(K) is the mean of the absolute values of L”(K) and sL(K) is the standard deviation of L(K)).
The correlation between genotypes at pairs of loci was determined using Weir’s (1979) measure of genotypic disequilibrium, Rij. Random permutations of genotypes at a locus (GENETIX v. 4.05.02) allowed us to generate the distribution of Rij under the null hypothesis of genotypic equilibrium. Correspondence analysis (CA; Benzécri, 1982) was run to visualize samples
7
to a bidimensional space. Two CAs were run on allele-frequency data, the first one on the matrix of samples x allele-frequencies derived from Appendix B (26 samples x compound-alleles at 2 intron loci), and the second one on the matrix derived from Appendix C (12 samples x compound-alleles at 3 microsatellite loci). Hierarchical clustering analysis (Lê et al., 2008) was used to delineate clusters of samples; for this, pairwise distances between samples were Euclidean distances in the space defined by the first five axes of the CA.
3. Results
3.1. Geometric morphometrics
Clear-cut differences were observed in the body shapes of Blue and Silver anchovies from Mersin Bay, whereas no effect of sex on body shape was visible (Fig. 2e). The Mahalanobis distance between male and female specimens was 1.72 for Blue anchovy and 1.68 for Silver anchovy. These differences were not significant (test on T-square statistic; 1000 permutations; P>0.05), hence, males and females were pooled for subsequent analysis. The Mahalanobis distance between the two morphotypes was 4.59 (P <0.001). According to DA, the assignment of Blue anchovy to their own group was 95.6% and that of Silver anchovy was 96.8% (Fig. 2f), thus formalizing the initial distinction of two forms from their general, external features.
The deformation grid for the body shape of Blue, relative to Silver anchovy is given in Fig. 2d. This figure points out remarkable deformation at the head and posterior parts of the ventral region. 3.2. Otolith shape
The results of the Fourier analysis of otolith shape are summarized in Fig. 3b,c. Otoliths of individuals belonging to different age groups were analyzed separately. The otoliths of Silver anchovy differed from those of Blue anchovy in both the 1+ and 2+ age groups. Although some marginal overlap was present in 1+ individuals (Fig. 3b), no overlap was observed between Silver and Blue anchovies aged 2+ (Fig. 3c). The CDA discriminated Blue from Silver anchovies with reclassification scores of, respectively, 80% and 85% for 1+ individuals (Wilk’s Λ = 0.017; P< 0.001),
and, respectively, 86% and 100% for 2+ individuals (Wilk’s Λ = 0.003; P< 0.001).
3.3. Genetic analyses
Summary statistics (allele number, allelic richness, expected heterozygosity, observed heterozygosity, inbreeding coefficient estimates, estimated null allele frequencies) for Blue and Silver anchovies from Mersin Bay and for four reference anchovy populations, all genotyped at 12 nuclear loci, are reported in Table 1. To assess the suitability of the genetic markers for
investigating population structure, we first checked the general conformity of the observed
8
done with the two samples from Mersin Bay which unlike the other samples were large enough to allow meaningful estimations of f. Locus EeJ27.1 exhibited much higher f values (0.502 and 0.526 in Silver and Blue anchovies, respectively) than the other loci (Table 1), hence was designated as an outlier in both Silver and Blue anchovies (Appendix B). Moreover, the null allele frequencies inferred at locus EeJ27.1 (Table 1) in the two anchovy populations from Mersin Bay (0.24, 0.25) were higher than the generally accepted threshold value (r= 0.20) above which the impact of null alleles on θ estimates can be considered a problem (Chapuis and Estoup, 2007). Thus, EeJ27.1 was excluded from further analysis. The most polymorphic marker was EeOV04 with 34 different alleles while CK6-1 was the least polymorphic with 10 alleles (Table 1). The distributions of allele
frequencies by sample are summarized in Supplementary material, Fig. S1.
The outcomes of Bayesian structure analysis for K = 2-7 are summarized in Supplementary Material, Table S2 and Fig. S2. Using Evanno et al.’s (2005) approach, the most likely number of clusters (K) was determined as 2 (Supplementary material, Fig. S3). No significant genetic disequlibrium (Rij) value was detected (Supplementary material, Table S3).
3.4. Comparison with other anchovy populations
Pairwise θ estimates between populations ranged from 0.017 (between Ann and Set) to 0.094 (between Blue anchovy and Cul) and were all significant (Table 2). Mersin-Bay Silver anchovy appeared to be genetically closer to the reference E. albidus than to the reference E. encrasicolus. Likewise, Mersin-Bay Blue anchovy were genetically closer to E. encrasicolus (Table 2). To analyze the placement of Mersin-Bay Silver and Blue anchovies in the phylogeographic context of the entire Mediterranean Sea, we compared them on the basis of allele frequencies to the widest possible range of samples of individuals. We thus compared the allele-frequency data at loci CK6-1 and CK6-2 obtained in this study with previously published, homologous data from across the Mediterranean Sea (Bouchenak-Khelladi et al., 2008; Kristofferson and Magoulas, 2008). This required pooling alleles as explained in Appendix B. The resulting matrix of allele frequencies per sample (Appendix B) was subjected to correspondence analysis (CA). Comparisons were also made using microsatellites, between this study and that of Borrell et al. (2012). We obtained the genotype data of Borrell et al. (2012) concerning loci EeOV04, Ee-10, Ee2-508, Ej-27.1 and Ej-41.1 (Y.J. Borrell, pers. comm.). Locus Ej-27.1 was discarded because of the inferred high proportion of null alleles in our samples (see above) and so was Ej-41.1 because we were unable to establish cross-study relationships between alleles at this locus. Alleles at the three remaining loci were pooled as explained in Appendix C. The resulting matrix of allele frequencies per sample (Appendix C) was subjected to CA. The outcomes of the CAs on allele frequency data are presented in Fig. 5a (introns) and Fig. 5b (microsatellites). The Mersin-Bay “Blue” anchovy sample was included within the E. encrasicolus cluster (Fig. 5a, b), thus confirming its identity as E. encrasicolus. Correspondence analysis on microsatellite data further suggested “Silver” anchovy from Mersin Bay to be a genetically differentiated, local population of E. albidus (Fig. 5b).
9
4. Discussion
A trivial but crucial and sometimes overlooked problem in fish ecology and fisheries is to accurately identify the fish to species. This is a requirement for correctly estimating biomass, productivity and population trends, which in turn helps define management strategies (Ward, 2000). Inadvertently or intentionally confounding multiple species in an assessment would amount to ignoring the different population dynamics of each individual species due to different life
histories. In the case where fish are commercially exploited, it is also important that they be correctly labelled to species through the market chain.
4.1. Two anchovy species in Mersin Bay
Anchovy specimens from Mersin Bay presented two distinct phenotypes or forms differing by their general morphology, here coined “Blue” and “Silver” because of correlated colour differences. Here, we confirmed that the two forms also differ in their body shape as defined by landmarks, and that they differ significantly by their otolith shape. The two forms were segregated according to habitat: Blue anchovy tended to occur in the deeper areas of the bay, whereas Silver anchovy occurred in shallower, inshore waters.
Morphometric analysis has long been used as a tool for stock identification (Cadrin and Friedland, 1999). Silva (2003) examined morphometric variability using both the distance and landmark morphometric data of Sardina pilchardus from the northeastern Atlantic. Both morphometric methods indicated that southern Iberian (southern Portugal, Gulf of Cadiz) and northern Moroccan S. pilchardus specimens had a morphotype distinct from those in the other areas. Discrimination of the two morphotypes was also confirmed statistically by the significant difference between group centroids and by the high percentage of correct classification (85%). The assignment of individuals to their own group was even higher (>95 %) for both anchovy
populations from Mersin Bay. This high score demonstrates a high level of morphological differentiation between the two sympatric forms.
Otolith shape has been widely used to discriminate closely related fish species (L’Abee-Lund and Jensen, 1993; Tuset et al., 2003; Ponton, 2006; Wakefield et al., 2014). It has also been used successfully to distinguish populations within a single species, Melanogrammus aeglefinus (Begg and Brown, 2000). Tracey et al. (2006) compared otolith forms of two widely separated Latris lineata populations using elliptical Fourier analysis. They achieved reasonable success in
demonstrating population differentiation based on otolith shape, which was further supported by mitochondrial DNA differences. DeVries et al. (2002) used otolith Fourier coefficient analysis to distinguish Atlantic king mackerel (Scomberomorus cavalla) populations from the eastern Gulf, reaching high classification success (71-86%). In the present study, the reclassification success of Mersin Bay Blue and Silver anchovies was between 80% and 100%, which again indicates strong differentiation.
10
nuclear loci, suggesting that the morphological differences do not result from pure phenotypic plasticity.
Altogether, these observations are strongly reminiscent of the differences observed between the two forms (also sometimes coined “Blue” and “Silver” anchovies) reported from the Adriatic Sea (Bembo et al. 1996a) and from the north Western Mediterranean Sea (Pasteur and Berrebi, 1985; Borsa, 2002). The latter observations have eventually led to recognizing two anchovy species, E. encrasicolus and E. albidus, in the Western Mediterranean Sea (Borsa et al., 2004;
Bouchenak-Khelladi et al., 2008). The present results indicate a level of genetic differentiation between Silver and Blue anchovies from Mersin Bay comparable to that observed between E. albidus and E. encrasicolus in the Western Mediterranean Sea.
4.2. Comparison of Mersin Bay anchovies with other populations
The recognition of at least two anchovy species in the Western Mediterranean Sea (Borsa, 2002; Borsa et al., 2004; Bouchenak-Khelladi et al., 2008) was originally inferred from higher similarities at allozyme loci between inshore anchovy of the north Western Mediterranean Sea and the northern Adriatic Silver anchovy, than between either of these populations and their
geographically closest counterparts, namely Blue anchovy from a few tens of kilometers apart in the north Western Mediterranean Sea and Blue anchovy from the Central Adriatic Sea. Likewise, the genetic similarities between Blue anchovy populations throughout the northeastern Atlantic and Mediterranean Sea were greater than between Blue anchovy and Silver anchovy within, e.g., the Adriatic Sea. This indicated restricted gene flow at a local scale in spite of a high level of genetic exchange on a regional level. Even though no diagnostic allozyme locus has been detected between the two forms, the patterns of genetic clustering were correlated with habitat (offshore vs. inshore) and not with geography.
Blue anchovy from Mersin Bay were genetically more similar to E. encrasicolus from the Western Mediterranean Sea than from typical E. albidus. Silver anchovy from Mersin Bay were genetically closer to E. albidus from the Western Mediterranean Sea, albeit slightly so, than they were to typical E. encrasicolus. In the absence of linkage data, one may argue that the two CK intron markers scored by Bouchenak-Khelladi et al. (2008) could well be linked, hence additional markers would be welcome to enforce the genetic distinction between the two species. Because allozyme genes encode enzymes involved in metabolism, one may also argue that genetic variation at allozyme loci in anchovies from the Western Mediterranean (Pasteur and Berrebi, 1985) may also have been potentially affected by selection. Here, the result that Blue anchovy from Mersin Bay are E. Encrasicolus and Silver anchovy from Mersin Bay are E. albidus was based on two sets of nuclear markers including microsatellite markers (see Fig. 5b). The latter are a priori unlikely to be linked to the two intron markers scored by Bouchenak-Khelladi et al. (2008), or to the six polymorphic allozyme loci scored by Pasteur and Berrebi (1985).
The difference between Mersin Bay Blue anchovy and E. encrasicolus was much higher than the allozyme-based estimate of genetic differentiation reported among E. encrasicolus populations
11
[i.e., Group II of Borsa (2002)] Mediterranean-wide. It is possible that Mersin-Bay Blue anchovy actually belong to another population, e.g. Group III of Borsa (2002), which includes samples from Sicily and from the Aegean Sea. The genetic difference, at nuclear DNA loci, between Mersin-Bay Silver anchovy and E. albidus was much higher than the (allozyme-based) comparison between E. albidus from the Western Mediterranean Sea and Silver anchovy from the northern Adriatic Sea (Borsa, 2002). This last result can be interpreted in terms of genetic differentiation between geographically distant populations.
5. Conclusion
Species are independently evolving metapopulation lineages (de Queiroz, 2007). Expected properties of separate species are distinct morphologies and distinct genetic composition. The occurrence of genetically distinct forms in sympatry provides evidence for reproductive isolation, which is another expected property of separate species. Here, we demonstrated both morphological distinction and significant, substantial genetic differences between anchovy forms at a single site, Mersin Bay. In our view, this is evidence for two separate species. These two anchovy forms also seem to segregate according to habitat (i.e., inshore vs. offshore), which is a further expected property of separate species (de Queiroz, 2007).
The present findings provide new insights into the biogeography of a common, but, from a taxonomic viewpoint, still incompletely described fish of the northeastern Atlantic and
Mediterranean waters. Future studies on the biology and ecology of anchovy populations will have to take into account the occurrence of two genetically and morphologically differentiated forms that occur sympatrically in several regions in both the Western and the Eastern Mediterranean basins and possibly elsewhere. This has further implications regarding the fishery management of anchovy, and the conservation of important biodiversity areas, such as Mersin Bay.
Acknowledgements
We are grateful to Dr. Yaisel J. Borrell for sharing microsatellite genotype data, to Dr. Dominique Ponton (IRD), Drs. Fusun Özer and Dr. Devrim Tezcan (IMS-METU) for their help and advice, to Serdar Sakınan and other scientists who obtained and identified the anchovy samples, to Cihan Ayanoğlu (METU) for running the Minitab programme, and to Allison Kideys (IMS-METU) for copy-editing the manuscript. This work was financed by the TUBITAK (The Scientific and
Technological Research Council of Turkey) projects: Small Pelagic Fishes (1080566), TARAL (1076066), TBAG (107T154) and KAMAG TURKHAYGEN-I (106G005). A.K. was supported by TUBITAK National Post-Doctoral Research Scholarship Program, SeaDataNet-EU FP6 (026212) and UPGRADE BlackSeaScene-EU FP7 (226592) projects.
12
References
Abdulla, A., Gomei, M., Maison, E., Piante, C., 2008. Status of marine protected areas in the Mediterranean Sea. IUCN, Gland, and WWF, France, 152 p.
Begg, G.A., Brown, R.W., 2000. Stock Identification of Haddock Melanogrammus aeglefinus on Georges Bank based on otolith shape analysis. Transactions of the American Fisheries Society 129, 935-945.
Belkhir, K., Borsa, P., Raufaste, N., Chikhi, L., Bonhomme, F., 2000. Genetix version 4.02, logiciel sous Windows™ pour la génétique des populations. Laboratoire Génome et populations, Université Montpellier 2, Montpellier.
Bembo, D.G., Carvalho, G.R., Cingolani, N., Arneri, E., Giannetti, G., Pitcher, T.J., 1996a. Allozymic and morphometric evidence for two stocks of the European anchovy Engraulis encrasicolus in Adriatic waters. Marine Biology 126, 529-538.
Bembo, D.G., Carvalho, G.R., Cingolani, N., Pitcher,T.J., 1996b. Electrophoretic analysis of stock structure in Northern Mediterranean anchovies, Engraulis encrasicolus. ICES Journal Marine Science 53, 115-128.
Benzécri, J.-P., 1982. L’analyse des données, 2, L’analyse des correspondances. Dunod, Paris. Bookstein, F. L., 1989. Principal warps: Thin plate splines and the decomposition of deformations.
IEEE Transactions on Pattern Analysis and Machine Intelligence 11, 567–585.
Bookstein, F.L., 1991. Morphometric tools for landmark data: Geometry and biology. Cambridge University Press, Cambridge.
Borrell, Y.J., Alvarez, J., Blanco, G., Mártinez de Murguía, A., Lee, D., Fernández, C., Martínez, C., Cotano, U., Álvarez, P., Sánchez Prado, J.A., 2011. A parentage study using microsatellite loci in a pilot project for aquaculture of the European anchovy Engraulis encrasicolus L. Aquaculture 310, 305-311.
Borrell,Y.J., Piñera, J.A., Sánchez Prado, J.A., Blanco, G., 2012. Mitochondrial DNA and microsatellite genetic differentiation in the European anchovy Engraulis encrasicolus L. ICES Journal of Marine Science 69, 1357–1371.
Borsa, P., 2002. Allozyme, mitochondrial-DNA, and morphometric variability indicate cryptic species of anchovy (Engraulis encrasicolus). Biological Journal of the Linnean Society 75, 261–269.
Borsa, P., Collet, A., Durand, J.-D., 2004. Nuclear-DNA markers confirm the presence of two anchovy species in the Mediterranean. Comptes Rendus Biologies 327, 1113–1123.
Bouchenak-Khelladi, Y., Durand J-D., Magoulas, A., Borsa, P., 2008. Geographic structure of European anchovy: a nuclear-DNA study. Journal of Sea Research 59, 269–278.
Cadrin, S. X., Friedland, K. D., 1999. The utility of image processing techniques for morphometric analysis and stock identification. Fisheries Research 43, 129-139.
Chapuis, M-P., Estoup, A., 2007. Microsatellite null alleles and estimation of population differentiation. Molecular Biology and Evolution 24, 621-631.
13
Chiu, T.S., Lee, Y.J., Huang, S.W., Yu, H.T., 2002. Polymorphic microsatellite markers for stock identification in Japanese anchovy (Engraulis japonica). Molecular Ecology Notes 2, 49–50. de Queiroz, K., 2007. Species concepts and species delimitation. Systematic Biology 56, 879-886. Dempster, A.P., Laird, N.M., Rubin, D.B., 1977. Maximum likelihood from incomplete data via the EM
algorithm (with discussion). Journal of the Royal Statistical Society B 39, 1-38.
DeVries, D.A., Grimes, C.B., Prager, M.H., 2002. Using otolith shape analysis to distinguish eastern Gulf of Mexico and Atlantic Ocean stocks of king mackerel. Fisheries Research 57, 51–62. Erdogan, Z., Turan, C., Torcu Koc, H., 2009. Morphologic and allozyme analyses of European ancovy
(Engraulis encrasicolus (L. 1758)) in the Black, Marmara and Aegean Seas. Acta Adriatica 50, 77-90.
Evanno, G., Regnaut, S., Goudet, J., 2005. Detecting the number of clusters of individuals using the software STRUCTURE: a simulation study. Molecular Ecology 14, 2611–2620.
Falush, D., Stephens, M., Pritchard, J., 2007. Inference of population structure using multilocus genotype data: dominant markers and null alleles. Molecular Ecology Resources 7, 574–578. Ferson, S., Rohlf, F.J., Koehn, R.K., 1985. Measuring shape variation of two dimensional outlines.
Systematic Zoology 34, 59–68.
Goudet, J., 2002. FSTAT, a program to estimate and test gene diversities and fixation indices, version 2.9.3.2 (http://www2.unil.ch/popgen/softwares/fstat.htm).
Grant, W.S., 2005. A second look at mitochondrial DNA variability in European anchovy (Engraulis encrasicolus): assessing models of population structure and the Black Sea isolation hypothesis. Genetica 125, 293–309.
Guo, S.W., Thompson, E.A., 1992. Performing the exact test of Hardy-Weinberg proportion for multiple alleles. Biometrics 48, 361-372.
Hammer, Q., Harper, D.A.T, Ryan, P.D., 2001. PAST: Paleontological Statistics software package for education and data analysis. Paleontologia Electronica 4, 1-9.
Isaev, M., 1995. EFAWin, Window shell for Elliptic Fourier, Institute of Math Problems of Biology, Pushchino. Available athttp://life.bio.sunysb.edu/morph/
Jakobsson, M., Rosenberg, N.A., 2007. CLUMPP: a cluster matching and permutation program for dealing with label switching and multimodality in analysis of population structure.
Bioinformatics 23, 1801-1806.
Klingenberg, C.P., 2011. MorphoJ: an integrated software package for geometric morphometrics. Molecular Ecology Resources 11, 353-357.
Kristofferson, J.B., Magoulas, A., 2008. Population structure of anchovy Engraulis encrasicolus L. in the Mediterranean Sea inferred from multiple methods. Fisheries Research 91, 187-195. Kuhl, F.P., Giardina, C.R., 1982. Elliptic Fourier features of a closed contour. Computer Graphics and
Image Processing 18, 236–258.
L’Abee-Lund, J.H., Jensen, A.J., 1993. Otoliths as natural tags in the systematics of salmonids. Environmental Biology of Fishes 36, 389–393.
Landi, M., Garoia, F., Piccinetti, C., Tinti, F., 2005. Isolation of polymorphic microsatellite loci from the European anchovy, Engraulis encrasicolus. Molecular Ecology Notes 5, 266 268.
14
Lebart, L., Morineau, A., Piron, M., 1997. Statistique exploratoire multidimensionnelle. Dunod, Paris, 439 p.
Lê, S., Josse, J. ,Husson F., 2008. FACTOMINER: an R package for multivariate analysis. Journal of Statistical Software. 25, 1.
Magoulas, A, Castilho, R., Caetano, S., Marcato, S., Patarnello, T., 2006. Mitochondrial DNA reveals a mosaic pattern of phylogeographical structure in Atlantic and Mediterranean populations of anchovy (Engraulis encrasicolus). Mol. Phylogenet. Evol. 39, 734–746.
Magoulas, A., Tsimenides, N., Zouros, E., 1996. Mitochondrial DNA phylogeny and the reconstruction of the population history of a species: the case of European anchovy (Engraulis encrasicolus). Molecular Biology and Evolution 13, 178-190.
Mahalanobis, P.C., 1936. On the generalised distance in statistics. Proceedings of the National Institute of Sciences of India 2, 49-55.
Minitab Inc., 2010. Meet Minitab 16. State College, PA: Minitab Inc. (www.minitab.com).
Motos, L., Uriarte, A., Valencia, V., 1996. The spawning environment of the Bay of Biscay anchovy (Engraulis encrasicolus L.). Scientia Marina 60, 117–140.
Nei, M., 1978. Estimation of average heterozygosity and genetic distance from a small number of individuals. Genetics 89, 583–590.
Pakaki, V., Magoulas, A., Kasapidis, P., 2009. New polymorphic microsatellite loci for population studies in the European anchovy, Engraulis encrasicolus (L.). Molecular Ecology Resources 9, 1406–1409.
Pasteur, N., Berrebi, P., 1985. Structure génétique des populations naturelles d’animaux
laguno-marins sur des bases de génétique biochimique et d’écologie (Contrat n°83.J.0024 du Ministère de la recherche, Direction du développement scientifique et technologique et de l’innovation). Université des sciences et techniques du Languedoc, Montpellier.
Pearson, K., 1901. On lines and planes of closest fit to systems of points in space. Philosophical Magazine 2, 559-572.
Polly, P.D., Head, J.J., 2004. Maximum likelihood identification old fossils: taxonomic identification of Quaternary marmots (Rodentia, Mammalia) and identification of vertebral position in the pipe snake Cylindrophis (Serpentes, Reptilia). Pp. 197-222 in Elewa, A.M.T. (ed.), Morphometrics- Applications in biology and paleontology. Springer-Verlag, Heidelberg.
Ponton, D., 2006. Is geometric morphometrics efficient for comparing otolith shape of different fish species? Journal of Morphology 267, 750-757.
Pritchard, J. K., Stephens, M., Donnely, P., 2000. Inference of population structure using multilocus genotype data. Genetics 155, 945-959.
Raymond, M., Rousset, F., 1995. GENEPOP (version 1.2): Population genetics software for exact tests and ecumenicism. Journal of Heredity 86, 248-249.
Rice, W.R., 1989. Analyzing tables of statistical tests. Evolution 43, 223–225.
Rohlf, F.J., 1993. Elliptic Fourier analysis. Department of Ecology and Evolution, State University of New York at Stony Brook, New York.
15
Stony Brook, New York (http://life.bio.sunysb.edu/morph/).
Rohlf, F.J., Slice, D., 1990. Extensions of the Procrustes method for the optimal superimposition of landmarks. Systematic Zoology 39, 40–59.
Rosenberg, N.A., 2004. DISTRUCT: a program for the graphical display of population structure. Molecular Ecology Notes 4, 137-138.
Rousset, F., 2008. Genepop'007: A complete reimplementation of the Genepop software for Windows and Linux. Molecular Ecology Resources 8, 103-106.
Silva, A., 2003.Morphometric variation among sardine (Sardina pilchardus) populations from the northeastern Atlantic and the western Mediterranean. ICES Journal of Marine Science
60:1352-1360.
Spanakis, E., Tsimenides, N., Zouros, E., 1989. Genetic differences between populations of sardine, Sardina pilchardus, and anchovy, Engraulis encrasicolus, in the Aegean and Ionian seas. Journal of Fish Biology 35, 417-437.
Stewart, C.N., Jr., Via, L.E., 1993. A rapid CTAB DNA isolation technique useful for RAPD fingerprinting and other PCR applications. BioTechniques 14,748-749.
Tracey, S.R., Lyle, J. M, Duhamel, G., 2006. Application of elliptical Fourier analysis of otolith form as a tool for stock identification. Fisheries Research 77, 138–147.
Turan, C., Erguden, D., Gurlek, M., Basusta, N. and Turan, F., 2004. Morphometric structuring of the anchovy (Engraulis encrasicolus L.) in the Black, Aegean and NortheasternMediterranean Seas. Turkish Journal of Veterinary and Animal Science 28, 865-871.
Tuset, V.M., Lozano, I.J., Gonzalez, J.A., Pertusa, J.F., Garcia-Diaz, M.M., 2003. Shape indices to identify regional differences in otolith morphology of comber, Serranus cabrilla (L., 1758). Journal of Applied Ichthyology 19, 88–93.
Wakefield, C.B., Williams, A.J., Newman, S.J., Bunel, M., Dowling, C.E., Armstrong, C.A., Langlois, T.J., 2014. Rapid and reliable multivariate discrimination for two cryptic Eteline snappers using otolith morphometry. Fisheries Research, in press.
Waldron, M.E., 1994. Validation of annuli of the South African anchovy, Engraulis capensis, using daily otolith growth increments. ICES Journal of Marine Science 51, 233–234.
Ward, R.D., 2000. Genetics in fisheries management. Hydrobiologia 420, 191-201. Weir, B.S., 1979. Inferences about linkage disequilibrium. Biometrics 35, 235-254.
Weir, B.S., Cockerham, C.C., 1984. Estimating F-statistics for the analysis of population structure. Evolution 38, 1358–1370.
Zarraonaindia, I., Iriondo, M., Albaina, A., Pardo, M.A., Manzano, C.,Grant, W.S., Irigoien, X., Estonba, A., 2012. Multiple SNP markers reveal fine-scale population and deep phylogeographic
16
Table 1. Summary of genetic diversity at 2 intron- and 10 microsatellite loci in European anchovy (Engraulis spp.)
from Mersin Bay and from reference samples. Ann, Annaba, south Western Mediterranean Sea; Ben, Benguela current system off South Africa; Cul, Cul-de-Beauduc, north Western Mediterranean Sea; Set, off Sète, north Western Mediterranean Sea (sampling details for reference samples in Bouchenak-Khelladi et al., 2008). N, sample size; k, number of alleles; AR, allelic richness; He, expected heterozygosity; Ho, observed heterozygosity; f, inbreeding coefficient; Null frequency of null alleles under the hypothesis of the Hardy-Weinberg equilibrium.
Sample,
parameter Locus
CK1 CK2 EeOV04 Ee-10 Ee2-91a Ee2-91b Ee2-135 Ee2-407 Ee2-452a Ee2-508 Ej-27.1 Ej-41.1
Silver (N=48) k 5 8 26 19 12 7 15 18 15 13 23 12 AR 2.482 4.468 8.908 7.516 6.506 5.025 5.881 6.484 7.564 7.757 8.678 6.281 Ho 0.375 0.604 0.681 0.854 0.745 0.750 0.674 0.833 0.830 0.688 0.468 0.896 He 0.514 0.675 0.936 0.891 0.868 0.795 0.808 0.827 0.900 0.912 0.934 0.851 f 0.273 0.105 0.275* 0.042 0.143 0.057 0.167 -0.008 0.079 0.248* 0.502* -0.054 Null 0.08 0.034 0.128 0.000 0.048 0.012 0.074 0.007 0.040 0.116 0.237 0.000 Blue (N=48) k 8 12 24 20 13 7 13 12 17 9 27 10 AR 3.622 5.495 8.955 6.211 6.850 5.007 5.506 6.216 7.520 4.980 9.606 6.532 Ho 0.5 0.521 0.804 0.813 0.833 0.792 0.617 0.771 0.833 0.792 0.457 0.958 He 0.617 0.746 0.941 0.755 0.885 0.794 0.823 0.807 0.901 0.745 0.957 0.873 f 0.192 0.304* 0.147 -0.078 0.059 0.003 0.252* 0.045 0.076 -0.064 0.526* -0.099 Null 0.083 0.133 0.073 0.007 0.024 0.012 0.113 0.012 0.029 0.000 0.251 0.000 Ann (N=15) k 2 7 19 13 10 10 9 14 10 11 21 10 AR 1.683 4.972 9.832 7.848 7.251 5.928 6.090 7.473 7.412 7.007 10.778 7.057 Ho 0.143 0.533 0.929 1.000 0.929 0.867 0.533 0.667 0.933 0.867 0.857 0.867 He 0.137 0.786 0.958 0.897 0.905 0.816 0.846 0.878 0.910 0.878 0.982 0.883 f -0.04 0.329 0.032 -0.12 -0.027 -0.064 0.378 0.247 -0.026 0.014 0.131 0.019 Null 0 0.128 0.000 0.000 0.000 0.000 0.139 0.067 0.000 0.016 0.048 0.000 Ben (N=15) k 3 6 7 10 11 7 5 10 10 9 16 8 AR 2.705 4.386 4.860 6.671 7.381 5.840 4.017 7.132 7.057 6.502 9.582 6.435 Ho 0.4 0.467 0.786 0.733 0.933 0.714 0.600 0.733 0.857 0.867 0.643 0.733 He 0.358 0.72 0.688 0.855 0.903 0.855 0.722 0.899 0.889 0.878 0.960 0.881 f -0.125 0.360 -0.149 0.147 -0.034 0.169 0.174 0.189 0.037 0.014 0.339* 0.172 Null 0 0.122 0.000 0.079 0.000 0.045 0.055 0.064 0.000 0.000 0.151 0.073 Cul(N=7) k 2 2 10 10 6 5 6 6 4 6 9 6 AR 2.000 2.000 9.099 8.978 5.692 4.835 5.429 5.549 4.000 5.549 8.253 5.692 Ho 1.000 0.167 0.857 1.000 0.571 0.429 0.857 0.571 0.667 0.714 0.429 0.714 He 0.538 0.410 0.956 0.945 0.835 0.780 0.780 0.747 0.636 0.747 0.934 0.846 f -1.000 0.615 0.111 -0.063 0.333 0.471 -0.108 0.25 -0.053 0.048 0.561* 0.167 Null 0.000 0.168 0.000 0.000 0.112 0.177 0.000 0.082 0.000 0.000 0.236 0.000 Set (N=15) k 1 8 14 14 7 6 8 10 10 7 18 8 AR 1.000 5.602 7.799 7.441 5.545 4.395 5.121 6.470 7.328 5.264 9.760 6.08 Ho 0 0.786 0.733 0.867 0.923 0.933 0.467 0.643 0.800 0.750 0.714 0.733 He - 0.762 0.901 0.837 0.822 0.724 0.756 0.852 0.906 0.754 0.960 0.862 f 0.001 -0.033 0.192 -0.037 -0.129 -0.302 0.391 0.252 0.12 0.005 0.263 0.154 Null NA 0 0.078 0.000 0.000 0.000 0.157 0.058 0.048 0.000 0.104 0.034
17
Table 2. Mediterranean anchovy, Engraulis spp. Pairwise genetic differentiation (θ)
estimates between populations, based on 2 intron- and 9 microsatellite loci.
Sample
Sample Blue Ann Ben Cul Set
Silver 0.041* 0.038* 0.066* 0.063* 0.073*
Blue 0 0.043* 0.087* 0.094* 0.057*
Ann 0 0.051* 0.057* 0.017*
Ben 0 0.092* 0.094*
Cul 0 0.095*
18 LEGENDS TO FIGURES
Fig. 1. Trawling locations for anchovy (Engraulis spp.) in Mersin Bay, Eastern Mediterranean Sea
(36°31’N-36°48’N; 34°13’E-34°44’E) in June 2010. Pie charts indicate catch ratios of Silver and Blue anchovies, as determined from external appearance; grey, Silver anchovy; blue, Blue anchovy.
Fig. 2. Body shape and colour differences between the two anchovy forms (Engraulis spp.) from
Mersin Bay, Eastern Mediterranean Sea, and landmarks for geometric morphometrics. (a) Anchovy of the “Blue” phenotype typical of the deeper waters of Mersin Bay; scale: 1 square = 0.2 cm. (b) Anchovy of the “Silver” phenotype typical of the shallow inshore habitat of Mersin Bay; scale: 1 square = 0.2 cm. ( c) Position of 20 morphometric landmarks (black dots): 1, tip of premaxillary; 2, pit of upper jaw; 3, border of head; 4, anterior base of the dorsal fin; 5, posterior base of the dorsal fin; 6, 7, 8 points of maximum curvature of the caudal peduncle; 9, posterior base of anal fin; 10 anterior base of anal fin; 11, base of pelvic fin; 12, base of pectoral fin; 13, ventral tip of cleithrum; 14, tip of lower jaw; 15, anterior border of eye; 16, posterior border of eye; 17, most anterior point of cleithrum; 18, dorsal tip of cleithrum; 19, 20, insertions of pectoral fin. (d) Pattern of shape change along PC1 of principal component analysis (see Fig. 2e). Circles indicate the locations of the landmarks in the mean shape of the sample; arrows indicate the changes in the relative positions of the landmarks as the score on PC1 increases (scaling factor 0.1). (e) Principal component analysis of body shape for 229 Silver and Blue anchovy specimens from Mersin Bay, based on 20 landmarks (Fig. 2c). Closed triangles (▲): male Silver anchovy; inverted open triangles (∇): female Silver anchovy; open squares (□): male Blue anchovy; closed squares (∎): female Blue anchovy. (f) Cross-validation discriminant function analysis of Blue and Silver anchovy body shape. Rate of correct classification was 95.6% for Silver anchovy and 96.8% for Blue anchovy. Blue: Blue anchovy; grey: Silver anchovy; dark blue: misclassified individuals.
Fig. 3. Otolith morphometrics of Mersin Bay Engraulis spp. (a) Photographed are the sagittae of 2+
year-old Silver anchovy (left) and Blue anchovy (right). Sagittae traced by 120 equally spaced points using the TPSDig2 computer program (Rohlf, 1993). Load: points of 120 landmarks around otolith (blue contour); H:1, H:2 and H:21 harmonic numbers (red contour) from EFAWin program. Twenty one harmonics were used to obtain a balance between ratio of sample size to the number of variables, and accuracy of the description of otolith’s shape. (b) Principal component analysis on 21 harmonics of sagitta contour for 1+ Blue (N=15) and Silver (N=13) individuals. (c) Principal
component analysis on 21 harmonics of sagitta contour for 2+ Blue (N=7) and Silver (N=8)
individuals. Black circles (•): Silver anchovy; diamonds (⋄): Blue anchovy.
Fig. 4. Results of Bayesian structure analysis of individual genotypes in anchovy samples (Engraulis
spp.) from Mersin Bay (Silver, Blue) together with reference samples from the Benguela current system (Ben) and from the Western Mediterranean Sea (Ann, Set, Cul), based on 11 nuclear loci (EJ27.1 excluded) assuming K=2 clusters. Twenty replicate simulations were run for each K value,
19
ranging from 2 to 7, using 10,000 burn-in repetitions and a final run of 100,000 Markov
chain-Monte Carlo steps under an admixture model with independent allele frequencies. Evanno et al.’s (2005) test designated K=2 as the most likely (see Supplementary material, Figs. S2 and S3). Each individual, represented by a vertical bar, is segmented with assorted colours representing the different clusters to which it was assigned, with segment length proportional to assignment
probability. Figure drawn using Distruct v1.1 (Rosenberg, 2004).
Fig. 5. Genetic relationships of Mersin-Bay Engraulis spp. (Silver and Blue) to samples from the
Atlantic and the Mediterranean as inferred from correspondence analysis (CA) (FACTOMINER: Lê et al., 2008). Ellipses delineate clusters of samples determined by hierarchical clustering
(FACTOMINER). Grey lettering: samples set as inactive in the analyses (see Appendix B for
justification). In brackets: inertias of axes. (a) Samples of the present study, together with those of Bouchenak-Khelladi et al. (2008), including reference samples for E. encrasicolus (SET) and E. albidus (CUL), and those of Kristofferson and Magoulas (2008). Samples were characterized by their compound-allele frequencies at intron loci CK6-1 and CK6-2 (Appendix B). (b) Samples of the present study, together with those of Borrell et al. (2012), characterized by their compound-allele frequencies at microsatellite loci EeOV04, Ee-10 and Ee2-508 (Appendix C).
36°E
35°E
34°E
3
6
°
3
0
’N
3
6
°
N
TURKEY
MERSIN BAY
Mediterranean Sea
50
10
100
200
500
Figure1a
b
12 17 13 1 2 3 4 5 6 7 8 9 10 11 20 19 18 14 15 16c
d
11 12 20 13 17 16 1 14 15 7 8 9 10 PC1 3 19 18 2 4 5 6 Frequency Blue Silverf
15 12 9 6 3 -20 -10 0 10 20 0 PC 1 (26.4%) -2.4 -1.2 0 1.2 2.4 -3.2 -1.6 0 1.6e
PC 2 (16.4%) Discriminant Figure2-2.4 -1.2 0 1.2 2.4 PC1 (52.7%) -2.4 -1.2 0 1.2 2.4 PC2 (14.4%)
b
-1.6 -0.8 0 0.8 1.6 -2 -1 0 1 2 PC1 (40.4%) PC2 (27.2 %)c
a
Load H:1 H:21 H:2 Figure3Probability
0
1
Silver
Blue
Ben
Ann
Set
Cul
Sample
Figure4-0.5
0
0.5
Cul
ME
Ben
Set
Ann
SA
LI
GE
Silver
Blue
0
1
-0.5
BB
FR
0.5
Cul
Ben
Set
ADR
Ann
Pat
Lion
CUL
MAU
SET
Adr
Kav
Bls
Geo
ANN
ORN
Can
BEN
PAG1
PAG2
PAG3
PAT1
PAT2
LION
Silver
Blue
0
0.5
-0.5
-0.5
0
0.5
Axis 1 (53.1%)
Axis 1 (63.8%)
Axis 2 (28.5%)
Axis 2 (18.8%)
a
b
Figure525
Appendix A
Primers and PCR conditions for two intron and 10 microsatellite loci in European anchovy
Locus Repeat motif (5’-3’) Forward (F) and reverse (R) primer
sequences Ta (°C) [Mg
2+ ]
(mM) Allele size (bp) Reference
CK6-1 - F5′-CGACATTGTAATGATGTTACAATGA-3’
R5′-ATTTCCTTTGGGTTGGCTCTTCTCT-3’ 54 1.7 320-1040 Borsa et al., 2004 CK6-2 - F5′-CTCAGAACTACATACCAAACCAATG-3’
R5′-ACTCACTGTAATTCTGAATAGAGCT-3’ 52 1.7 472-527 Borsa et al., 2004 EeOV04 (CA)2 F 5’-CCCAGGAAGTGTATTGGGTGGCTT-3’
R 5’-TGTGTGTCCCAAACACAGTGCGGA-3’ 56 1.5 275-400 Borrell et al., 2011 Ee-10 [(GT)9CT]2[(GT)2CT]3 F 5’-GGTGGATGAAGTGGCAATCT-3’
R 5’-CTGGGGTGGCATAACTGAAG-3’ 56 1.5 200-268 Landi et al., 2005 Ee2-91a (AGG)12 F 5’-AGAGCAGGTTCTTGCTGTGG-3’
R 5’-TGTGGTGCGCTACTATCAGG-3’ 55 1.5 250-292 Pakaki et al., 2009 Ee2-91b (CCGCA)8 F 5’-GGTCTTGAGCTTGGCATAGG-3’
R 5’-CCGGAAGACACTCTGCACAC-3’ 60 1.5 115-170 Pakaki et al., 2009 Ee2-135 (ATTAG)10 F5’-AGGGCAGTGACAGGAGAGTC-3’
R5’-TCGTTACCCTGCGTTTATACTG-3’ 55 1.5 110-165 Pakaki et al., 2009 Ee2-407 (CA)13 F 5’-AGGAATCTCCTTCCCGTCTC-3’
R 5’-GTGGGTCTGTGGGTGTTTTG-3’ 60 1.5 136-196 Pakaki et al., 2009 Ee2-452
a (AC)13 F 5’-CCCAACCCTAGGGAGACATC-3’ R 5’-TCGTTCAGCAAGCATACACC-3’ 59 1.5 250-298 Pakaki et al., 2009 Ee2-508 (AGG)8 F 5’-CACATGCTCGCTAAACATTG-3’
R 5’-CCTGATGCTGCTTGGTAGC-3’ 55 1.5 154-199 Pakaki et al., 2009 Ej-27.1 (GA)36 F5’-GACTGTGAAGGAACGCTGGT-3’
R5’-AATAGGATTAGTCATCACAGGG-3’ 56 1.5 150-268 Chiu et al., 2002 Ej-41.1 (CACAA)8 F 5’-TCTACCCCTGGAGGACACAC-3’
26
Appendix B
Comparison of allele frequencies at intron loci CK6-1 and CK6-2 for the samples analyzed in this study with those in Bouchenak-Khelladi et al. (2008) (Bouchenak-Khelladi) and, indirectly, Kristofferson and Magoulas (2008)(Kristofferson) a. S, O, F, compound alleles as defined in footnotes b,c. N sample
size.
Locus, Sample
Allele Bouchenak-Khelladia Kristoffersona This studya
Adr ANN BEN Bls Can CUL Geo Kav MAU Lion ORN Pat SET ADR LION PAG1 PAG2 PAG3 PAT1PAT2 Ann Ben Blue Cul Set Silver
CK6-1 b S 0 0.01 0 0.02 0 0 0 0.02 0 0 0 0.02 0.01 0.01 0 0.01 0.03 0.02 0 0 0 0 0.08 0 0 0.02 O 0.74 0.86 0.75 0.94 0.61 0.93 0.95 0.78 0.93 0.93 0.58 0.73 0.85 0.78 0.86 0.71 0.65 0.73 0.85 0.83 0.93 0.80 0.54 0.50 1 0.60 F 0.26 0.13 0.24 0.04 0.39 0.07 0.05 0.21 0.06 0.07 0.41 0.25 0.14 0.20 0.14 0.28 0.33 0.25 0.15 0.17 0.07 0.20 0.38 0.50 0 0.38 (N) (52) (49) (49) (56) (49) (112) (55) (58) (46) (15) (24) (53) (95) (37) (47) (117) (40) (83) (83) (82) (15) (15) (48) (7) (15) (48) CK6-2 c S 0.47 0.17 0.05 0.51 0.14 0.10 0.48 0.46 0.10 0.43 0.25 0.36 0.50 0.49 0.55 0.50 0.67 0.55 0.51 0.54 0.47 0.03 0.57 0.25 0.61 0.14 O 0.09 0.24 0.07 0.10 0.25 0.13 0.12 0.18 0.12 0.30 0.17 0.26 0.16 0.10 0.23 0.28 0.15 0.27 0.30 0.21 0.17 0.27 0.20 0 0.14 0.64 F 0.44 0.58 0.87 0.39 0.6 0.77 0.41 0.36 0.78 0.27 0.58 0.38 0.34 0.41 0.21 0.22 0.17 0.18 0.19 0.25 0.37 0.70 0.23 0.75 0.25 0.23 (N) (46) (49) (48) (50) (48) (115) (53) (36) (46) (15) (24) (29) (93) (43) (47) (114) (46) (103) (92) (78) (15) (15) (48) (7) (15) (48)
a Samples Lion, Adr and Pat of Bouchenak-Khelladi et al. (2008) are partly the same as samples LION, ADR and either PAT1 or PAT2 respectively of Kristofferson and Magoulas (2008);
they were used to determine allele homologies across the two studies. Similarly, samples Cul, Set, Ann and Ben of this study are subsamples of, CUL, SET, ANN and BEN respectively of Bouchenak-Khelladi et al. (2008) and were used for the same purpose. To eliminate duplications, samples Lion, Pat, ADR, Cul, Set, Ann and Ben were defined as inactive elements in the CA (Fig. 5a)
b At locus CK6-1, compound allele S corresponds to alleles 120, 110 and 105 of Bouchenak-Khelladi et al. (2008), 1-3 of Kristofferson and Magoulas (2008)and 990, 940, 615 and 563 of
this study; allele O corresponds to allele 100 of Bouchenak-Khelladi et al. (2008), 4 of Kristofferson and Magoulas (2008), and 524 of this study; compound allele F corresponds to alleles
98, 95, 90, 52, c050, 47, 30, 10 and 1 of Bouchenak-Khelladi et al. (2008), 5-21 of Kristofferson and Magoulas (2008), and 444, 414, 412, 404 and 320 of this study
c At locus CK6-2, compound allele S corresponds to alleles 150, 110, 107 and c105 of Bouchenak-Khelladi et al. (2008), 1-2 of Kristofferson and Magoulas (2008), and 527, 525 and 523 of
this study; compound allele O corresponds to alleles c102 of Bouchenak-Khelladi et al. (2008), 3-5 of Kristofferson and Magoulas (2008), and 521 and 518 of this study; compound allele F corresponds to alleles 100, 98, 97, 95, 90 and 10 of Bouchenak-Khelladi et al. (2008), 6-14 of Kristofferson and Magoulas (2008), and 516, 514, 512, 510, 508, 504, 502, 474 and 472 of this study.
27
Appendix C
Comparison of allele frequencies at microsatellite loci EeOV04, Ee-10 and Ee2-508 for the samples analyzed in this study, with those in Borrell et al. (2012) (Borrell). N sample size.
Locus, Sample
Allele Borrell a This study a
BB FR GE LI ME SA Ann Ben Blue Cul Set Silver
EeOV04 b >306 0.45 0.51 0.64 0.54 0.55 0.55 0.54 0.36 0.59 0.36 0.37 0.60 c304 0.33 0.31 0.17 0.10 0.22 0.30 0.25 0 0.21 0.21 0.20 0.22 <300 0.22 0.18 0.19 0.36 0.23 0.15 0.25 0.64 0.26 0.50 0.43 0.21 (N) (181) (39) (21) (25) (43) (48) (14) (14) (46) (7) (15) (47) Ee-10 c >214 0.75 0.74 0.76 0.58 0.84 0.69 0.64 0.17 0.34 0.50 0.83 0.57 214 0.20 0.18 0.12 0.30 0.10 0.22 0.04 0.30 0.48 0.14 0.03 0.23 <214 0.05 0.09 0.12 0.12 0.06 0.09 0.32 0.53 0.18 0.36 0.13 0.20 (N) (182) (40) (21) (25) (44) (48) (14) (15) (48) (7) (15) (48) Ee2-508 d >163 0.41 0.45 0.36 0.44 0.50 0.56 0.67 0.97 0.43 0.93 0.46 0.79 163 0.51 0.49 0.50 0.44 0.46 0.39 0.27 0 0.44 0.07 0.46 0.07 <163 0.07 0.06 0.14 0.12 0.04 0.04 0.07 0.03 0.14 0 0.08 0.14 (N) (182) (40) (21) (24) (42) (47) (15) (15) (48) (7) (12) (48)
a To establish identities of alleles across studies, the Blue and Set samples of the present study were compared with sample ME of Borrell et al. (2011), which was
located in the southern Central Adriatic and, hence was assumed to consist of Blue anchovy (Bembo et al., 1996a).
b The most common allele at locus EeOV04 in Blue anchovy (this study) was 304 (frequency = 0.14). The most common allele in sample ME of Borrell et al. (2012) was 305 (frequency = 0.16), indicating that the sizing of alleles in Borrell et al. (2012) was shifted by one bp to the right, relative to this study. All alleles larger than 306
(307 of Borrell et al., 2012) were lumped into compound allele >306 while all alleles smaller than 300 (301 of Borrell et al., 2012) were lumped into compound allele
<300. All alleles from 300 to 306 (from 301 to 307 in Borrell et al., 2012) were lumped into compound allele c304
c The most common allele at locus Ee-10 in Blue anchovy (this study) was 214 (frequency = 0.48) and was assumed to be homologous to allele 215 of Borrell et al.
(2012). All alleles larger (resp. smaller) than 214 (215 in Borrell et al., 2012) were lumped into compound allele >214 (resp. <214)
d The most common allele at locus Ee2-508 in Blue anchovy (this study) was 163 (frequency = 0.44)and was assumed to be homologous to allele 165 of Borrell et al.
28
Appendix D. Supplementary data
Supplementary data associated with this article can be found, in the online version, at http://dx.doi.org/xxx
Supplementary material to:
Geometric morphometrics, Fourier analysis of otolith shape, and nuclear-DNA markers distinguish two anchovy species (Engraulis spp.) in the Eastern Mediterranean
by Arzu Karahan, Philippe Borsa, Ali Cemal Gucu, İrfan Kandemir, Emel Ozkan, Yesim Ak Orek, Sinan Can Acan, Evren Koban and Inci Togan
Table S1-S3 and Figs. S1-S3 here appended
References
Belkhir, K., Borsa, P., Raufaste, N., Chikhi, L., Bonhomme, F., 2000. Genetix version 4.02, logiciel sous Windows™ pour la génétique des populations. Laboratoire Génome et populations, Université Montpellier 2, Montpellier. Evanno, G., Regnaut, S., Goudet, J., 2005. Detecting the number of clusters of individuals using the software
STRUCTURE: a simulation study. Molecular Ecology 14, 2611–2620.
Falush, D., Stephens, M., Pritchard, J., 2007. Inference of population structure using multilocus genotype data: dominant markers and null alleles. Molecular Ecology Resources 7, 574–578.
Rosenberg, N.A., 2004. DISTRUCT: a program for the graphical display of population structure. Molecular Ecology Notes 4, 137-138.
Table S1. Detection of outlier loci with respect to the distribution of Fis values estimated for two anchovy (Engraulis
spp.) samples from Mersin Bay. To determine the outliers one interquartile range (IQR) (which is defined as the interval between the upper limits of the first and third quartiles) was added to the upper value of the third quartile, and
subtracted from the upper value of the first quartile.
Locus Silver anchovy Blue anchovy
Fis Rank Quartile Fis Rank Quartile
CK6-1 0.273 10 Q4 0.192 9 Q3 CK6-2 0.105 6 Q2 0.304 11 Q4 EeOV04 0.275 11 Q4 0.147 8 Q3 Ee-10 0.042 3 Q1 -0.078 2 Q1 Ee2-91a 0.143 7 Q3 0.059 6 Q2 Ee2-91b 0.057 4 Q2 0.003 4 Q2 Ee2-135 0.167 8 Q3 0.252 10 Q4 Ee2-407 -0.008 2 Q1 0.045 5 Q2 Ee2-452a 0.079 5 Q2 0.076 7 Q3 Ee2-508 0.248 9 Q3 -0.064 3 Q1
Ej27.1 0.502 12 outlier 0.526 12 outlier
Ej41.1 -0.054 1 minimum -0.099 1 minimum
Lower limit -0.175 - - -0.332 - -
Upper limit 0.488 - - 0.521 - -
Table S2. Membership coefficients determined from Bayesian structure analysis (STRUCTURE: Falush et al.,
2007) based on genotype data at two intron and 9 microsatellite loci, for two anchovy samples from Mersin Bay (i.e., samples Blue and Silver, which consisted, respectively, of all blue and silver individuals sampled from the bay), with prior number of populations (K) allowed to range from 2 to 4. Each Cluster is represented by a particular colour in the STRUCTURE diagrams (Fig. S2).
Sample K Cluster to which assigned
Cluster 1 Cluster 2 Cluster 3 Cluster 4
Blue 2 0.50 0.50 - - 3 0.43 0.12 0.45 - 4 0.33 0.21 0.38 0.08 Silver 2 0.57 0.43 - - 3 0.27 0.49 0.24 - 4 0.18 0.24 0.18 0.41
Table S3. Locus-pairwise linkage disequilibrium values [Rij: Weir (1979) in Belkhir et al. (2000)] in Silver anchovy
(below diagonal) and Blue anchovy (above diagonal) from Mersin Bay, north Eastern Mediterranean. No significant value was detected (permutation tests and Bonferroni correction).
Locus Locus
CK6-1 CK6-2 EeOV04 Ee-10 Ee2-91a Ee2-91b Ee2-135 Ee2-407 Ee2-452a Ee2-508 EJ41.1 CK6-1 - 0.105 0.103 0.099 0.101 0.118 0.093 0.112 0.136 0.106 0.112 CK6-2 0.115 - 0.122 0.089 0.104 0.119 0.101 0.114 0.106 0.105 0.120 EeOV04 0.139 0.108 - 0.126 0.106 0.117 0.148 0.114 0.106 0.111 0.112 Ee-10 0.098 0.104 0.108 - 0.109 0.111 0.134 0.112 0.101 0.099 0.110 Ee2-91a 0.098 0.118 0.107 0.114 - 0.124 0.107 0.106 0.109 0.111 0.126 Ee2-91b 0.106 0.096 0.117 0.119 0.146 - 0.130 0.134 0.118 0.123 0.138 Ee2-135 0.083 0.143 0.119 0.121 0.147 0.119 - 0.103 0.104 0.108 0.156 Ee2-407 0.156 0.104 0.103 0.122 0.125 0.124 0.117 - 0.115 0.115 0.128 Ee2-452a 0.108 0.113 0.111 0.112 0.113 0.126 0.125 0.125 - 0.114 0.111 Ee2-508 0.096 0.126 0.110 0.114 0.123 0.126 0.115 0.108 0.127 - 0.123 EJ41.1 0.093 0.126 0.109 0.103 0.114 0.113 0.113 0.105 0.117 0.117 -
Figure S1. Anchovies, Engraulis spp. Size-allele frequencies at 11 nuclear loci in Silver and Blue anchovies from Mersin Bay,
Eastern Mediterranean, and comparison with reference samples from the Western Mediterranean Sea (Ann, Cul, Set) and the southern Atlantic (Ben). Ordinate: allele size (in base pairs).
Fig. S2. Results of Bayesian structure analysis of individual genotypes in anchovy samples (Engraulis spp.) from Mersin Bay and
four other samples from the Atlantic and the Western Mediterranean Sea, based on 11 nuclear loci (EJ27.1 excluded) assuming K=2 to 7 Clusters. Ten replicate simulations were run for each K value, ranging from 2 to 7, using 10,000 burn-in repetitions and a final run of 100,000 Markov chain-Monte Carlo steps under an admixture model with independent allele frequencies. Each individual, represented by a vertical bar, is segmented with assorted colours representing the different clusters to which it was assigned, with segment length proportional to assignment probability. Figures drawn using Distruct v1.1 (Rosenberg, 2004). Abbreviations for
Fig. S3. Delta K values with respect to K, according to the calculation method by Evanno et al.