HAL Id: hal-02656941
https://hal.inrae.fr/hal-02656941
Submitted on 30 May 2020
HAL is a multi-disciplinary open access
archive for the deposit and dissemination of
sci-entific research documents, whether they are
pub-lished or not. The documents may come from
teaching and research institutions in France or
abroad, or from public or private research centers.
L’archive ouverte pluridisciplinaire HAL, est
destinée au dépôt et à la diffusion de documents
scientifiques de niveau recherche, publiés ou non,
émanant des établissements d’enseignement et de
recherche français ou étrangers, des laboratoires
publics ou privés.
Contribution of artificial galleries to knowledge of karstic
system behaviour in addition to natural cavern data
Benjamin Garry, Thibault Blondel, Christophe Emblanch, Christophe Sudre,
Séverine Bilgot, Alain Cavaillou, Daniel Boyer, Michel Auguste
To cite this version:
Benjamin Garry, Thibault Blondel, Christophe Emblanch, Christophe Sudre, Séverine Bilgot, et al..
Contribution of artificial galleries to knowledge of karstic system behaviour in addition to natural
cavern data. International Journal of Speleology, Società Speleologica Italiana, 2008, 37 (1), pp.75-82.
�hal-02656941�
Contribution of artificial galleries to the knowledge of karstic system
behaviour in addition to natural cavern data
Benjamin Garry
1, Thibaut Blondel
1, Christophe Emblanch
1, Christophe Sudre
2,
Séverine Bilgot
3, Alain Cavaillou
2, Daniel Boyer
2, Michel Auguste
2INTRODUCTION
The catchment area of Fontaine de Vaucluse has been already widely studied with more than 120 articles and several PhD theses. Moreover, a lot of hydrochemical measurements have been taken. The Fontaine de Vaucluse is the most famous karstic spring of France and one of the biggest with 23 m3/
s mean flow (Cognard-Plancq et al., 2006). It gives its name to the same outlets, which go out toward a quite-vertical phreatic conduit. Located at about 30 km East of Avignon, the Fontaine de Vaucluse is the main spring of the Sorgues river, which irrigates thanks to its hydrologic network the most fertile part of Vaucluse area. Although the limits of its catchment area are not known very well, the Fontaine de Vaucluse
1 Université d’Avignon et des Pays de Vaucluse, UFR Sciences, Laboratoire d’Hydrogéologie, 33 rue Louis Pasteur, F-84000 AVIGNON. E-mails : Benjamin.Garry@univ-avignon.fr; Thibaut.Blondel@univ-avignon.fr; Christophe.Emblanch@univ-avignon.fr.
2 Laboratoire �outerrain ��� Bas Bruit de �ustrel, Pays d’Apt,Laboratoire �outerrain ��� Bas Bruit de �ustrel, Pays d’Apt, La Grande Combe, F-84400 �U�T�EL. E-mail : lsbb@geoazur. nice.fr
3 Université de Montpellier II, M�E, CC 57, F-34095 MONTPELLIE� Cedex 5, France.
Garry B., Blondel Th., Emblanch Ch., Sudre Ch., Bilgot S., Cavaillou A., Boyer D., Auguste M. 2008. Contribution of artificial galleries to the knowledge of karstic system behaviour in addition to natural cavern data. International Journal of Speleology, 37 (1), 75-82. Bologna (Italy). ISSN 0392-6672.
The study of karstic systems is mainly based on hydrodynamic and hydrochemical data collected at system inlets (rainfall) and outlets (springs). Indeed, some complementary data base coming from speleological and hydrogeological explorations of natural cavities exist. However, they are not completely representative of all the types of flows. These kinds of flow which have a large part in general hydrodynamics of a system are already the result of a structured organization of karst due to complex phenomena of limestone dissolution.
Artificial galleries have the advantage to be easily accessible. Moreover, they cut randomly flows which are much less structured or not. Both types of information seem to be complementary in order to understand a karstic aquifer.
In this paper, we focus on the hydrochemical and hydrodynamic study of unstructured flows of the Low-Noise Underground Laboratory of Rustrel- Pays d’Apt (LSBB), a former military site with 3,4 km of buried galleries.
Keywords
: hydrochemistry, hydrodynamics, karst, artificial gallery, water flowAbstract:
Received 25 September 2007; Revised: 24 December 2007; Accepted 8 January 2008
is the only outlet of a 1130 km² limestone catchment area (Puig, 1987). This aquifer belongs to the lower Cretaceous and is composed of a 1500 m thick limestone series (Masse, 1968) between Necomanian marls and upper Aptian marls. It is made of an 800 m thick unsaturated zone, which has an important hydrodynamic role in the system (Emblanch et al., 2003) and by a 700 m thick saturated zone. Among a list of 600 natural cavities (Gaubert & Le Falher, 1990, 1995), are documented in the studied area, most of them have a quite-vertical development and they have no significant perennial flow. �peleologists have found few perennial ones but they need several hours of expedition to reach it. A good example is the permanent flow called La �ivière d’Albion in the Fontaine de Vaucluse catchment area, with a 100 L/ s base discharge. This interesting flow is located at 600 m depth and eight hours of expedition are needed for experienced speleologists. These conditions make continuous hydrogeological measurements difficult to carry out. However, in the Fontaine de Vaucluse catchment area, a 3.4 km long artificial gallery exists, part of the Low Noise Underground Laboratory of �ustrel Pays d’Apt – L�BB (http://lsbb.unice.fr) (Figure 1). Inside this tunnel, four perennial flows occur. By comparison with classical speleological
International Journal of �peleology 37 (1) 75-82 Bologna (Italy) January 2008
Available online at www.ijs.speleo.it
International Journal of �peleology
76
explorations, these flows can be reached easily in order to perform hydrogeological studies. It is also exceptional to have an access to the unsaturated zone, i.e. to flows which circulate in a not very karstified network, and consequently fill the gap of knowledge about unsaturated zone flows.
STUDY AREA
In the past, the L�BB was in fact part of the French nuclear dissuasive force. It was indeed the arrangement area of ballistic and strategic ground-to-ground missiles. The L�BB is hosted in the limestone of the Grande Montagne massif, located north of Rustrel village. The main tunnel disappears into the massif, and reaches a maximum depth under rock of 519 m. It has a total length of more than 3.3 km (1560 m of 3.7 m wide main gallery and 1760 m of 1.7m wide emergency gallery). The whole wall of it is built in 70 cm thick reinforced concrete, with in places fitted zones.
Initially designed to be resistant to radioactive clouds, thermal impacts, mechanical waves and electromagnetic pulses, the technical assets of the site are numerous:
- an accessible tunnel which cut randomly the unsaturated zone of karst
- few seismic, gravimetric, mechanic, sound background noises in the tunnel
- no traffic within a 2 km radius
- an accessible area of massif on the top of tunnel
- 1500 m.w.e. (Meter Water Are equivalent) of radioactive protection
- electromagnetic reinforcement
- whole site powered, with high-speed internet connection.
Deriving benefits from L�BB location and technical characteristics, coupled experiments concerning dark matter physics, hydrogeology, seismic imaging, seismology and magnetism are conducted within L�BB by different research teams. The interconnections between all these scientific topics must especially be underlined, such as the combination between magnetism, hydrogeology and seismology studies. Indeed, it allows us, for the first time, to compare electromagnetic noise measurements with hydrogeological analysis and seismological measurements.
Future prospects of hydrogeologic, seismologic, magnetic and hydro-mechanic linked measurements can be planned in order to obtain a long database to develop new transversal methods, which can be applied to others systems.
From a geological point of view, the galleries are hosted in a monoclinal dipping towards south-west, which is affected by N-� and NE-�W faults (Fig. 1). The whole site is in the unsaturated zone and it offers an interesting access. Indeed, up to now, this karstic zone has been only accessible thanks to
Fig. 1. Location of the LSBB area, fracturing sketch and drip water points
International Journal of Speleology, 37 (1), 75-82. Bologna (Italy). January 2008
77
certain outlets or avens. The tunnel cuts randomly the karstic network and it permits to observe easily different kinds of flow.
Four perennial significant flows can be found in the emergency gallery, as shown in Figure 1 (thickness under rock: A 440m; B 418m; C 363m; D 30m). A fifth flow is located in an anti-atomic blast gallery (GA� 350 m). It is a temporary flow and the outlet of a leaching trench, which has been formed by the karstification of a first order fault.
These flows correspond to seepages of the rock wall observed by geologists during the digging (Thiebaud, 2003) at several faults zone levels (Figure 1). Considering the location of flow points with regard to the fracturing, we notice that the points A and B are located in a fractured zone, the point C in a crushed zone, the point D at the base of the epikarstic zone and the point GA� on a geologic accident. This diversity of fracturing throughout the gallery allows us to study different kinds of flows in the unsaturated zone. Moreover, in order to avoid possible problems linked to the presence of stored water at the rock-concrete interface level, the rock-concrete wall was drilled through at the sampled flow level.
RESULTS
Figure 2 shows the variations of flow observed in several perennial flows from L�BB. The GA� flow is not represented here because of its very low number of days of operation. This flow comes from a well-developed pipe with a great discharge fluctuation (from one to several L/s), associated with long periods without flow.
The same Figure 2, shows that A, B and D hydrographs are of the same type. This low discharge (less than L / min) remains relatively the same during the year. We notice that small increases appear, as a result of heavy rain pulses. This type of discharge is mainly due to circulation in fractured rocks rather than in karstified ones.
Flow C appears to be intermediate between the GAS and A, B, D groups. Its hydrograph looks like a classic karst spring. This point seems therefore corresponding
to a discharge point with the development of karstification making the transfer of pressure easier, and thus high flow rates during rainy periods. But it also reflects areas with relevant decrease, allowing a continuous discharge even during base flow period.
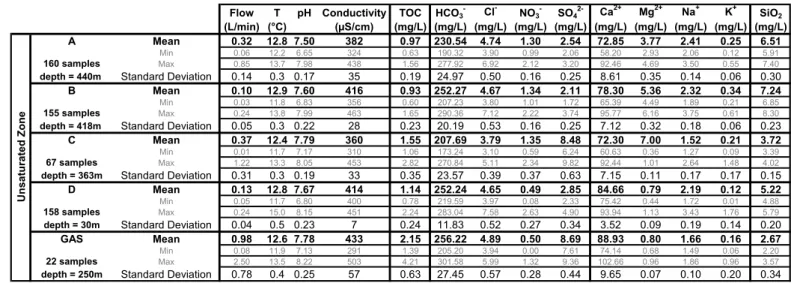
Table 1 shows the mean, minimum and maximum values of the main physical and chemical parameters: discharge (Q); temperature (T); electrical conductivity (EC), pH and chemical components (Total Organic Carbon –TOC-; major anions; major cations; �iO2).
These results derive from 670 samples collected from October 2003 to June 2006 in the different sampling points of the unsaturated zone. These data show a mean annual variation of EC of 56µ�/cm, between all sampled points, which is significant but not very important. This could be explained by the fact that about 90% of the EC values are due to calcium and bicarbonates. In our sample points, pCO2 stays quite the same, so the
calcium and bicarbonate concentrations are quite the same too. In this case, most of the EC differences are only due to ions with low concentration.
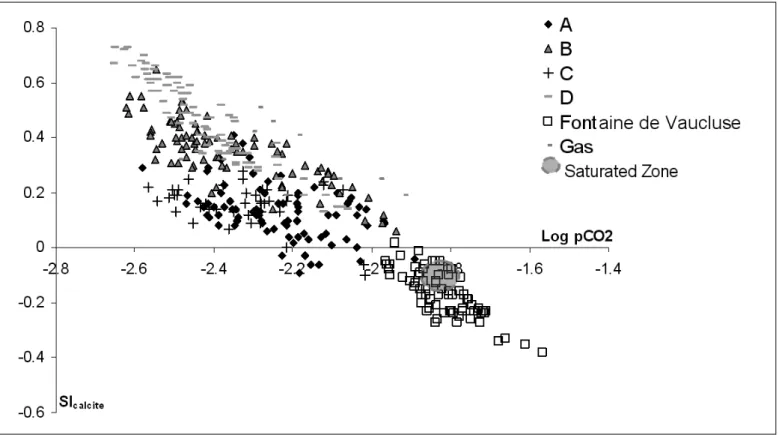
The calcite saturation index (�Ic) and pCO2 are two
Fig. 2. Time series of daily rainfall and discharge for A, B, C and D points.
Table 1: Some statistical data of the main physico-chemical parameters of drip waters
Flow T pH Conductivity TOC HCO3- Cl- NO3- SO42- Ca2+ Mg2+ Na+ K+ SiO2
(L/min) (°C) (µS/cm) (mg/L) (mg/L) (mg/L) (mg/L) (mg/L) (mg/L) (mg/L) (mg/L) (mg/L) (mg/L) A Mean 0.32 12.8 7.50 382 0.97 230.54 4.74 1.30 2.54 72.85 3.77 2.41 0.25 6.51
Min 0.06 12.2 6.65 324 0.63 190.32 3.90 0.99 2.06 58.20 2.93 2.06 0.12 5.91
160 samples Max 0.85 13.7 7.98 438 1.56 277.92 6.92 2.12 3.20 92.46 4.69 3.50 0.55 7.40
depth = 440m Standard Deviation 0.14 0.3 0.17 35 0.19 24.97 0.50 0.16 0.25 8.61 0.35 0.14 0.06 0.30
B Mean 0.10 12.9 7.60 416 0.93 252.27 4.67 1.34 2.11 78.30 5.36 2.32 0.34 7.24
Min 0.03 11.8 6.83 356 0.60 207.23 3.80 1.01 1.72 65.39 4.49 1.89 0.21 6.85
155 samples Max 0.24 13.8 7.99 463 1.65 290.36 7.12 2.22 3.74 95.77 6.16 3.75 0.61 8.30
depth = 418m Standard Deviation 0.05 0.3 0.22 28 0.23 20.19 0.53 0.16 0.25 7.12 0.32 0.18 0.06 0.23
C Mean 0.37 12.4 7.79 360 1.55 207.69 3.79 1.35 8.48 72.30 7.00 1.52 0.21 3.72
Min 0.01 11.7 7.17 310 1.06 173.24 3.10 0.59 6.24 60.63 0.36 1.27 0.09 3.39
67 samples Max 1.22 13.3 8.05 453 2.82 270.84 5.11 2.34 9.82 92.44 1.01 2.64 1.48 4.02
depth = 363m Standard Deviation 0.31 0.3 0.19 33 0.35 23.57 0.39 0.37 0.63 7.15 0.11 0.17 0.17 0.15
D Mean 0.13 12.8 7.67 414 1.14 252.24 4.65 0.49 2.85 84.66 0.79 2.19 0.12 5.22
Min 0.05 11.7 6.80 400 0.78 219.59 3.97 0.08 2.33 75.42 0.44 1.72 0.01 4.88
158 samples Max 0.24 15.0 8.15 451 2.24 283.04 7.58 2.63 4.90 93.94 1.13 3.43 1.76 5.79
depth = 30m Standard Deviation 0.04 0.5 0.23 7 0.24 11.83 0.52 0.27 0.34 3.52 0.09 0.19 0.14 0.20
GAS Mean 0.98 12.6 7.78 433 2.15 256.22 4.89 0.50 8.69 88.93 0.80 1.66 0.16 2.67
Min 0.08 11.9 7.13 291 1.39 205.20 3.94 0.00 7.61 74.14 0.68 1.49 0.06 2.20
22 samples Max 2.50 13.5 8.22 503 4.21 301.58 5.99 1.32 9.36 102.66 0.96 1.86 0.96 3.57
depth = 250m Standard Deviation 0.78 0.4 0.25 57 0.63 27.45 0.57 0.28 0.44 9.65 0.07 0.10 0.20 0.34
Unsaturated Zone
78
interesting indicators in karstic aquifers because they vary in accordance with calco-carbonic balance. In figure 3, we can observe that �Ic measured in L�BB are all oversaturated. In addition, the pCO2 appears systematically lower than Fontaine de Vaucluse which is the outlet of the system. These two observations seem to put in doubt the validity of such data. Because of their direct opening to the exterior, the pCO2 of the cave air is often lower than within the system. This phenomenon leads to an immediate release of CO2 at the arrival of water in the gallery and probably even in the last centimeters before arrival (�pötl et al., 2005). This process enables the development of speleothems. Thus the L�BB gallery is affected by the same phenomenon. This is not rare because, in addition to natural ventilation, L�BB has a system of artificial ventilation increasing this phenomenon. Without adequate systems of collection, pCO2 and �Ic can not be used reliably in our measurements.
Taking into account these observations, we are focussing on two types of natural tracers: those showing the greatest variation, such as Total Organic Carbon (TOC) and Magnesium (Mg2+), concentrations;
and tracers that display lower global variation but clear information such as �iO2, NO3-, �O
42- and Na+.
Due to slow dissolution kinetics, high concentrations in Mg2+ are usually considered as representative of
long residence time (Mudry, 1987). For Mg2+, mean
annual concentrations, which are quite low due to absence of dolomitic limestone (Masse, 1968), ranged from 0.71 mg/l for the C-point to 5.35 mg/l for the water from B-point in the unsaturated zone (UZ). These concentrations in UZ waters seem to stay quite steady as the mean calculated standard deviations vary from 0.07 for the GA�-point to 0.34 for the A-point.
Organic matter, used as a tracer of fast circulation in karstic systems, associated with chemical components like Mg2+, NO
3- and �iO2-concentrations, enables to
understand the hydrogeological functioning of the aquifers (Emblanch, 1997; Emblanch et al., 1998a, 1998b; Batiot et al., 2002; Batiot et al., 2003). TOC mean annual variation ranged from 0.93 mg/l for the B-point to 2,15 mg/l for the GA�-point, in unsaturated zone, and the mean calculated standard deviations vary from 0.19 for the A-point to 0.63 for the GA�-point.
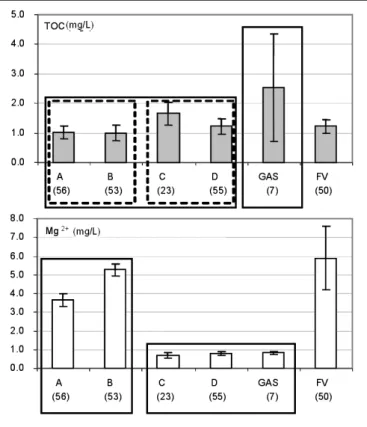
Figure 4 shows a bar chart of mean annual and standard deviation of TOC and Mg2+ concentrations
for each sampled point. Mg2+ permits to distinguish
two groups of samples. The first one includes A and B drip water points with Mg2+ concentrations greater
than 3.5 mg/l. The second one brings together C, D and GA� flows, with concentrations lower than 1 mg/l. Figure 4 also shows mean concentrations of TOC and their standard deviations for the different collected flows. Concentrations of TOC are all between 0.5-4 mg/l, and standard deviations are lower than 0.3 mg/l for sustainable flows. We can also notice 2 different groups: the first one with A, B, C and D flows with mean annual concentrations lower than 2 mg/l and the second one defined by the GA� flows with a mean annual concentration higher than 2 mg/l and a higher standard deviation (nearly 0.9). There are two sub-groups inside the first one, namely one with A and B flows (concentrations lower than 1 mg/l), and the other including C and D discharges (concentrations from 1.2 and 1.7 mg/l).
Chloride only comes from rainfall in lack of human pollution or evaporitic sediments, as can be found in the karstic massif of La Grande Montagne at the L�BB level. This context explains that mean annual
Fig. 3. Relationship between Calcite Saturation Index and pCO2 for the different points monitored in LSBB and Fontaine de Vaucluse.
International Journal of Speleology, 37 (1), 75-82. Bologna (Italy). January 2008
79
concentrations were lower than 5 mg/l for the UZ system drip water points (from 3.79 mg/l for the C-point to 4.89 mg/l for the GA�-flow). The four C-points have quite similar average (A, B, D and GA�) close to 4,7 mg/l. C-point mean value is 3,79 mg/l, shows a significant difference probably due to particular hydrogeologic behaviour or to difference in the catchment area. The same observation could be done on the Na+ content but in this case the GA�-point
shows also a low mean value. On the other hand, GA� and C points show mean average value of �O42- higher
than A, B and D points.
�iO2 is often used as a tracer of the long residence time, and gives globally the same information as Mg2+.
A and B are the most concentrated points, while C and GAS have lower values. But D point has relatively high value.
DISCUSSION
The study of TOC - Mg2+ relationship, in which
two mean residence time tracers of water intervene, is useful to establish water types in the karstic unsaturated zone. Indeed because these two tracers give information on different scales, three kinds of flows can be differentiated in the unsaturated zone.
The Mg2+ contents of A and B discharges are
much higher than those observed at C, D and GA� points. This difference cannot be explained by a heterogeneity of the aquifer, because the geologic formation of the aquifer is constituted by a large limestone bank without relevant dolomitic limestone or dolomites rocks (Masse, 1972). Thus, the magnesium distribution can be considered as
homogeneous (Masse, 1968) and the differences in Mg2+ content of drip water should be explained as
difference of the residence time.
Waters with very low residence time are characterised by low Mg2+ mineralization and high
TOC concentrations (GA�). Then, waters with high residence time have typical high Mg2+ concentrations.
They correspond to very slow flows, which supply A and B drip water points. Intermediate flows are characterised by low Mg2+ and TOC concentrations.
They correspond to low residence time waters that have stayed long enough in the aquifer to allow decomposition of TOC (C and D). This first classification of unsaturated zone waters, thanks to mean concentrations of these two tracers, clearly shows the large variability of flow types which are found in the unsaturated zone. Now three groups of residence time can be suggested. The lower one is represented by GA� (fast circulation), the second one (C and D) represents a karstic evolution. Finally, the third one corresponds to a more fractured karstic discharge (represented by A and B).
The L�BB investigation raises the problem of the representatively of data at the system scale. By using five measuring points, the results show high variability. Mathematically, by using two parameters, we could not find more than three sets. In fact, by using two tracers (TOC and Mg2+) we have obtained
three kinds of flow: from karstic to fractured circulations with an intermediate one.
What would be the conclusion if we have more points and more tracers? Probably we would expect more different types of behaviours. For example, with our five points, data of chloride (Table 1), sulphate and sodium permit to distinguish A, B and D points from C and GA� points. In fact, fractured (A, B) and epikarstic (D) discharges, which are often considered as having piston flow behaviour, are distinct from classic karstic flow (C, GA�). Adding also �iO2, three groups can be differentiated: A - B, C - GA� and D. This particular position of D-point could be explained by the presence of clays in the epikarst. The variation of these tracer concentrations can be explained by hydrogeological behaviours, but also by other phenomena (anthropic pollution, Cl- Na+ �O
42-;
natural heterogeneity, �iO2; …).
The aim of hydrogeologists must be to synthesise the observations and not to complicate them. We need to make a clear choice between two ways, either to develop a physically complex model, with a limited range scale transfer and based on practical applicability, or to build a global model which could be adapted according to the studied system. In other words, we have to look for common characteristics, or highlight the specificity of each studied system. Like for a porous aquifer, we could find a few common characteristics for karstic aquifers and few efficient tools to study them. We have therefore chosen the second view, that’s why we are going to use our three classes obtained by Mg2+ and TOC combination. Other
authors have also chosen to work with few families of water (Tooth & Fairchild, 2003 ; Baldini et al., 2006).
Fig. 4. Average Mg2+ and TOC concentrations, standard deviations, and number of samples collected at A, B, C, D, GAS and Fontaine de Vaucluse spring during 2003-2004 hydrological cycle
80
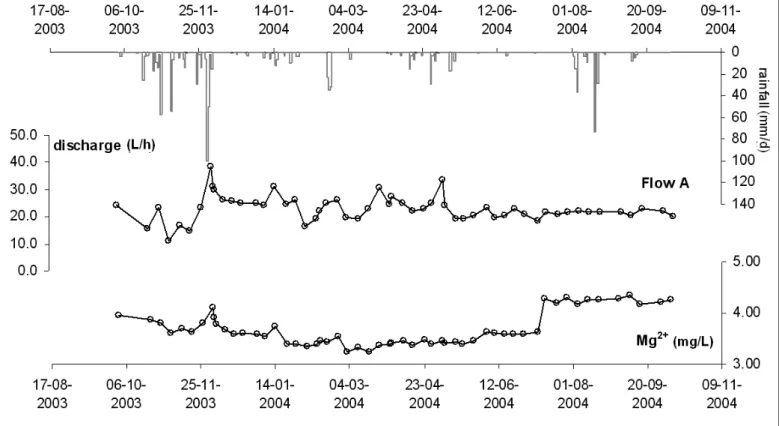
For A-point (figure 5), we can see that, for the low water period of the year 2003, the Mg2+ concentration
seems to show a decrease after the first precipitations. However, after important precipitations of December 1st and 2nd 2003, which accumulated nearly 150 mm
during two days, the three groups of concentrations of this element increase at the same time with the flow peak. As Mg2+ is a tracer of long retention time waters
(Mudry, 1987; Emblanch, 1997; Batiot et al., 2002), these sudden concentration increases find expression in more mineralised water comings, which have stayed for a longer mean residence time in the aquifer than the water flowing just before the event. This sudden participation also concerns waters, which do not participate during usual hydrodynamic rate of flow. It seems to be obvious that major fissures, through which water flows toward the outlet, cannot contain water. These high mineralised resources take place consequently in UZ levels where high discharge losses restrict their flow participation when the hydraulic gradient is low.
These remarks are essential because the events, which are described above, were underlined before by Emblanch et al. (1999) at the outlet of the Fontaine de Vaucluse system and supposed by Fernández-Cortés et al. (2006) in the Cueva del Agua (Granada, southern �pain). Here we show clearly that this phenomenon exists already in the unsaturated zone.
At this point of the paper, we must honestly take into account that the L�BB, despite all its advantage is not a natural cave and, consequently, we can not make a direct comparison between the information collected in the L�BB system and a natural cave. In natural caves, the sampling points are located in an organised system. The existence of a natural
cave is due to complex phenomena of dissolution of limestone and organisation of karstic discharges. �ome authors (Tooth & Fairchild, 2003 and Baldini et al., 2006) propose data considered as representing a fractured pole. But these measurements show a higher variability than our points. This highest variability could be explained by a slight participation of karstic flow. �o in natural caves, a sampling point, even if it flows from a small fracture inside the cave, could be a structured discharge. The L�BB is an artificial gallery, which allows us to observe easily a randomly cut karstic flow. According to the model proposed by Trček (2007), Kiraly et al. (1995), Gunn (1983), Williams (1983) and Klimchouk (1995), a part of this water is rapidly drained through large fractures into the karst conduit network discharge (C and GA�). Another part is retained and stored in the epikarst zone (D). This water slowly seeps through tiny fractured rock blocks and diffusely recharges lower parts of the aquifer (A and B).
In fact the aim is not to compare natural or artificial cave sampling, but to combine them. Tunnels permit to observe diffuse discharge and natural caves allow us to observe more or less organised systems in the epikarst and in the unsaturated zone of the karstic aquifers. All this information is complementary, and gives information at different levels of the UZ organisation (figure 6).
In a first approximation, we can consider that an artificial cave such as L�BB completes and produces interesting and relevant additional explanations to the classical observations done by natural cave studies. Indeed, we don’t want to contrast speleological and hydrogeological approach, but rather to combine them. In the future, we have to use other approaches like Ground Penetrating �adar (GP�), which has already
Fig. 5. Time series of daily rainfall, discharge and Mg2+ content for A-point.
International Journal of Speleology, 37 (1), 75-82. Bologna (Italy). January 2008
81
been used by Al-fares et al. (2002) in order to obtain more information about the epikarst structure.
CONCLUSION
The L�BB data can give information on the behaviour of karstic systems. First of all, this contribution shows the interest of artificial galleries to study the unsaturated zone of karstic systems. The combined use of TOC and Mg2+ contents is
very relevant to distinguish different families of water. These tracers complete the hydrodynamic observations and permit to characterize three families of water coming from high karstified to fractured networks and an intermediate one (Figure 6). This kind of classification has been already proposed in natural caves. However, by using artificial galleries, which cut randomly the karstic network, we could really observe the flow in the fractured family. This observation seems to be difficult in natural caves because, even if a sampled point flows from a small fracture inside the cave, it could be a structured discharge.
Artificial galleries and natural caves are both hosted in the same hydrogeologic object (karstic system). For this reason, we must combine all the existing data (hydrogeologic data from caves and galleries but also all other sources of information to build conceptual models of the unsaturated zone. Then, these models can be included in a global one, which could be adapted to all karstic systems, and not only for a case study.
Al-fares W., Bakalowicz M., Guérin �. & Dukhan M., 2002 - Analysis of the karst aquifer structure of the Lamalou area (Hérault, France) with ground penetrating radar. Journal of Applied Geophysics,
51 (2-4): 97-106.
Baldini J.U.L., McDermott F. & Fairchild I.J., 2006 - Spatial variability in cave drip water hydrochemistry: Implications for stalagmite paleoclimate records. Chemical Geology, 235: 390-404.
Batiot C., Linań C., Andreo B., Emblanch C., Carrasco F. & Blavoux B., 2003 - Use of TOC as a tracer of diffuse infiltration in a dolomitic karstic system : the Nerja Cave (Andalusia, Southern Spain). Geophysical �esearch Letters, 30 (22): 2179-2183.
Batiot C., Mudry J., Blavoux B. & Emblanch C., 2002 - Total Organic Carbon (TOC) variability at the outlet of karstic aquifers under different climatic and environmental contexts (southeastern and eastern France). 2nd Nerja Cave geological symposium, Malaga, �pain: 131-138.
Cognard-Plancq A.L., Gevaudan C. & Emblanch C., 2006 - Historical monthly rainfall-runoff database on Fontaine de Vaucluse karst system : review and lessons, Karst, cambio climatico y aguas subterraneas, Malaga, �pain: 465-475. Emblanch C., 1997 - Les équilibres chimiques
et isotopiques du carbone dans les aquifères karstiques : étude en région méditerranéenne de montagne, Université d’Avignon et des Pays de Vaucluse, 198 p.
Fig. 6.Sketch of karst behaviour and localization of sample points observed in L.S.B.B.
Contribution of artificial galleries to the knowledge of karstic system behaviour in addition to natural cavern data
82
Emblanch C., Blavoux B., Puig J.M. & Couren M., 1998a - Le marquage de la zone non saturee du karst a l’aide du carbone 13: The use of carbon 13 as a tracer of the karst unsaturated zone. Comptes Rendus de l’Academie des �ciences - �eries IIA - Earth and Planetary �cience,
326 (5): 327-332.
Emblanch C., Blavoux B., Puig J.M. & Mudry J., 1998b - Dissolved organic carbon of infiltration within the autogenic karst hydrosystem. Geophysical Research Letters, 25 (9): 1459-1462.
Emblanch C., Puig J.M., Zuppi G.M., Mudry J. & Blavoux B., 1999 - Comportement particulier lors des montées de crues dans les aquifères karstiques, mise en évidence d’une double fracturation et/ou de circulation profonde: Exemple de la Fontaine de Vaucluse. Eclogae GeologicaeEclogae Geologicae Helvetiae: 251-257.
Emblanch C., Zuppi G.M., Mudry J., Blavoux B. & Batiot C., 2003 - Carbon 13 of TDIC to quantify the role of the unsaturated zone: the example of the Vaucluse karst systems (Southeastern France). Journal of Hydrology,Journal of Hydrology,
279 (1-4): 262-274.
Fernández-Cortés A., Calaforra J.M., �ánchez-Martos F. & Gisbert J., 2006 - Stalactite drip rate variations controlled by air pressure changes : an example of non-linear infiltration processes in the ‘Cueva del Agua’ (Spain). Hydrological Processes, 21 (7): 920-930.
Gaubert G. & Le Falher B., 1990 - Hydrologie et spéléologie des territoires alimentant en eau la Fontaine de Vaucluse: Tome 1, les cavernes d’Albion. Association de �echerches et d’Etudes Hydrologiques du Plateau d’Albion, 231 p.
Gaubert G. & Le Falher B., 1995 - Hydrologie et spéléologie des territoires alimentant en eau la öFontaine de Vaucluse: Tome 2, les arcanes de Vaucluse. Association de �echerches et d’Etudes Hydrologiques du Plateau d’Albion, 238 p.
Gunn J., 1983 - Point recharge of limestone aquifers - a model from New Zealand karst. Journal of Hydrology,
61: 19-29
Kiraly L., Perrochet P. & �ossier Y., 1995 - Effect of the epikarst on the hydrograph of karst springs : a numerical approach. Bull Hydrogeól, 14: 199-220
Klimchouk A.B., 1995 - The nature and principal characteristics of epikarst. In: Proceedings of 12th international Congress of speleology, La Chaux-de-Fonds, 306 p.
Masse J.P., 1968 - L’Urgonien de Sault (Vaucluse). Bulletin de la �ociété Géologique de France, 4: 495-496.
Masse J.P., 1972 - Structures cryptalgaires libres dans un complexe carbonaté de plate-forme: les calcaires urgoniens (Barrémien) de Provence (Sud-Est de la France). 24th International Geological Congress, Montreal, 7: 572-585.
Mudry J., 1987 - Apport du traçage physico-chimique naturel à la connaissance hydrocinématique des aquifères carbonatés, UF� des �ciences et Techniques de Franche Comté-Besançon, Besançon, 381 p. Puig, J.M., 1987 - Le système karstique de la Fontaine de
Vaucluse. Hydrogéologie Thesis, Faculté des �ciences d’Avignon, Avignon, 208 p.
�pötl C., Fairchild I.J. & Tooth A.F., 2005 - Cave ai� control on dripwater geochemistry, Obir Caves (Austria): Implications for speleothem deposition in dynamically ventilated caves. Geochimica et Cosmochimica Acta,Geochimica et Cosmochimica Acta,
69 (10): 2451-2468
Thiebaud E., 2003 - Etude structurale et hydrogéologique du site du Laboratoire Souterrain à Bas Bruit de Rustrel, Université de Franche-Comté, Besançon, 50 p.
Trček B., 2007 - How can the epikarst zone influence the karst aquifer hydraulic behaviour? Environmental Geology, 51: 761-765.
Tooth A.F. & Fairchild I.J., 2003 - Soil and karst aquifer hydrological controls on the geochemical evolution of speleothem-forming drip waters, Crag Cave, southwest Ireland. Journal of Hydrology, 273: 51-68.
Williams P.W., 1983 - The role of the subcutaneous zone in karst hydrology. Journal of Hydrology, 61 (1-3): 45-67
International Journal of Speleology, 37 (1), 75-82. Bologna (Italy). January 2008