1
µ-ViP :customized virtual phantom for quantitative magnetic resonance
micro-imaging at high magnetic field
C. Rondeau-Mouroa,b,*,R.Kovrlijaa,b,G.Gambarotac,d, H. Saint-Jalmesc,d,e
a
Irstea, UR OPAALE, 17avenue de Cucillé, CS 64427, F-35044 Rennes, France
b
Université européenne de Bretagne, France
c
INSERM, UMR 1099, Rennes, France
d
LTSI, Université de Rennes 1, 35000 Rennes, France
e
CRLCC, Centre Eugène Marquis, Rennes, France
Correspondingauthor: Corinne Rondeau-Mouro, Irstea, UR OPAALE, CS 64426, 17 avenue
de Cucillé, 35044 Rennes, Cedex, France Tel: 33 (0)223482143; fax: 33(0)223482115.E-mail address: [email protected]
Keywords :MRµI, MRI, reference signal, virtual phantom
Abstract
The applications of Magnetic Resonance micro-Imaging (MRI) cover nowadays a wide range of fields. However few of them present quantitative measurements when the sample of interest changesover time or in case of a long acquisition time.In this domain, two challenges have to beovercome: the introduction of a phantom as a reference signal and the guarantee that this signal is stable over the experiment duration while some conditions such astemperature and/or the moisture are varied. The aim of the present study was to implement a dedicated experimental set-up to generate a virtual phantom (ViP) signal in a vertical-bore 11.7 T NMR spectrometer, equipped with a micro-imaging probe. This study shows that the generation ofa micro-imaging-dedicated ViP (µ-ViP) signal is ofgreat benefit for on-line quality control of the spectrometer performance during acquisition in the case of real-time experiments. Thus, µViP represents a step towards improvement of the magnetic resonancesignalquantification in small samples.
2
1. Introduction
In the field of MRI, reference signals are important for quantitation of many phenomena[1-4]. Reference signals are typically obtained by using physical phantoms, positioned in the MR scanner bore next to the object of interest; however, there are some drawbacks in the use of physical phantoms. Indeed, to exploit the reference signal originating from physical phantoms, it is necessary to meet two self-evident conditions: 1) the physical phantom has to be positioned in such a way that it will be within the field of view (FOV) chosen for the MR images; 2) the reference signal needs to be stable – at least during the time duration of the experiment. In some situations, on the other hand, it could be challenging to meet these conditions. With respect to the first condition, in certain MR micro-imaging (MRI) experiments, for instance, it might be unfeasible to add a reference physical phantom to the experimental set-up. The applications of MRI cover nowadays a wide range of fields; typically, MRI allows for microstructure investigations of small objects, with a resolution on the order of 10 µm. MRI is usually performed at very high fields with NMR systems where the bore size (or the available space within micro-imaging probes) is limited to a few millimeters. Thus, introducing a reference physical phantom -in addition to the object of interest- within this limited space might not be always feasible.
With respect to the second condition (i.e., the stability of the reference signal), there are a number of NMR experiments where, due to the nature of the experimental set-up, the reference signal of typical physical phantoms changes during the duration of the experiment. This is the case, for instance, for experiments where the temperature and/or the moisture is varied. Examples of this type of studies include real-time MRI measurements of cooking phenomena in cereal products [5-9] or meat[10-12]. As a matter of fact, for the development of food products, it is of great interest to monitor the water ingress and transfer in various substances as a function of temperature [13-16]. It should be noted here that, in general, MRI and MRI investigations of water ingress/transfer are also common to other fields such as pharmaceutical sciences, where the objects of interest are tablets and other similar pharmaceutical products[17, 18].
Recently, an alternative approach to the use of physical phantoms for generating MRI reference signals has been proposed[19]. This approach was referred to as virtual phantom (ViP) MRI and consisted in the implementation of a dedicated experimental set-up to generate MR images of virtual phantoms. This approach (Virtual Phantom Magnetic Resonance Imaging, ViP MRI) is the extension of the ‘Electronic REference To access In vivo
3 Concentrations’ (ERETIC)method, which has been largely used in NMR spectroscopy [1]. As for ERETIC, the ViPMRImethod is based on the generation of a reference signal (the k-space lines) by radiofrequency (RF) electronics; this reference signal is transmitted by a dedicated RF coil (the ViP coil) to the MR scanner bore, where it is acquired by the receiver coil of the MR scanner during the data acquisition. The feasibility of ViP MRI was demonstrated in a 4.7 T MR system dedicated to preclinical research, with a 30-cm horizontal-bore[19, 20]. The ViP MRI method could be an attractive alternative to physical phantoms, particularly in situations where one of the two aforementioned conditions is not satisfied [20].
Given the growing interest in MRI studies, with multiple applications to different scientific fields, we sought to investigate the feasibility of ViP MRI for a vertical-bore 11.7 T NMR spectrometer, equipped with a micro-imaging probe.
We addressed the challenges of implementing the ViP MRI method for MRI experiments, including, for instance, the very limited space available in the vertical-bore of the NMR spectrometer; to this aim, a micro-imaging-dedicated ViP(µ-ViP) coil was designed and built. Two studies were performed: in the first study, MRI measurements were done at different temperatures, whereas in the second study the temperature was kept constant throughout the experiment but the object of interest soaked water over time.
2. Materials and methods
A first sample(Tube 1)called model sample was composed of two separated compartments :a 5mm diameter NMR tube containing 200 µL of anhydrous milk fat (AMF, gift of Locmaria, France) was introduced and centered into one 10 mm diameter NMR tube (Cortecnet, France), this later filled with 600µL distilled doped and deuteratedwater (CuSO4 1g/L, D2O/H20 80/20
v:v). The second sample (Tube 2) contained distilled doped water mixed with deuterated water (CuSO4 1g/L, D2O/H20 80/20 v:v). The third sample (Tube 3) consisted in
astarch-glycerol extrudate immersed in deuterated water (CuSO4 1g/L, D2O/H20 80/20 v:v). The
preparation of the extrudatewere reported in Belveirt et al. (2014)[21]. It was composed of potato starch purchased from Roquette (Lestrem, France) and glycerol (Merck, purity >98%) at a ratio of 20% in wet basis (gift from D. Lourdin, INRA Nantes, France). MRI experiments were performed on a 11.7T MR spectrometer (Avance III, Bruker, Wissembourg, France) equipped with a dedicated micro-imaging probe with a 10 mm 1H insert coil and 3 T/m gradients on each axis . The temperature of the micro-imaging probe was regulated by a
4 water cooling system (BCU20, Bruker, France). TheParaVisionsoftware (PV6, Bruker, France)was used for the acquisition and processing of data.
The experimental set-up of the µ-ViP method was based on the concept carried out in Saint-Jalmes et al.[19]. A home-built8 mm x 35 mmrectangular RF coil (the ‘ViP coil’) was connected to the waveform signal generator (Redstone, Tecmag Inc., Houston, TX, USA) with a coaxial cable that passed through the NMR spectrometer bore and was fixed at the top of the NMR tube at a distance of 8.5 cm from the probe RF coil (Figure 1), this latter being employed to receive the RF signal of the sample as well as that of the virtual phantom. A low quality factor (~5) ensured that ViP coildid not interfere with the probe RF coil. The carrier frequency of the waveform generator was adjusted to the main frequency of the spectrometer (500.152 MHz).The µ-ViP RF signal was played in synchronism with the MRI data acquisition using the RF unblank line of the MR console to trigger the waveform generator. First, a "go setup" scanning instruction (GSP) was run in order to check the amplitude and the position of the µ-ViP signal in real time into the acquisition window of a FLASH sequence. Then, the timing was fine-tuned in the ViP sequence by adjusting the time delay in the waveform generator allowing the acquisition of the µ-Vip signal to fit that of the signal originating from the physical object. In other words, the time delays of the Bruker pulse sequence were not modified.Theµ-ViP signal stability was measured in two manners. The first measurement consisted in evaluating the signal mean value and the corresponding standard deviation of the µ-ViP signal and those ofthe model sample components over two hours. Imaging acquisition was based on 2D single-slice FLASH using the following parameters: TR = 30ms, TE = 3 ms, flip angle = 30°, matrix size = 128*128, FOV = 14 mm2, slice thickness= 1 mm, and dwell time = 20 µs. The µ-ViPstability was also checked during the acquisition of a Multi-Slice-Multi-Echo Sequence (MSME) on the starch-glycerol extrudate at 22°C.The parameters used for this experiment were : TR = 1500 ms, TE = 5 ms, echo spacing = 5ms, 32 echoes, matrix size = 128*128, FOV = 14 mm2, one slice, slice thickness= 1 mm, and dwell time = 20 µs.Four ROIs were selected under ParaVision (Bruker, France): ROI1 for µ-ViP, ROI2 for doped water, ROI3 for water imbibed starch-glycerol extrudate and ROI4 for non-imbibed starch-glycerol extrudate. The signal intensity of each ROI was fitted under ParaVisionusing one or two exponential functions following equation 1 :
) T / t exp( I ) t ( I 2j 2 1 j j
equation (1)5 where I(t) is the intensity of the total relaxation signal at time t, T2j the spin–spin relaxation
time of component j and Ij the associated signal intensity. An estimation of T1 relaxation times
was also performed by acquiring images with TR values ranging from 30 to 2000 ms. At each time point, the µ-ViP, water and AMF signals from the model sample were reported from specific ROIs selected manually on homogeneous regions within the sample images using ImageJ software [22].
3. Results and Discussion
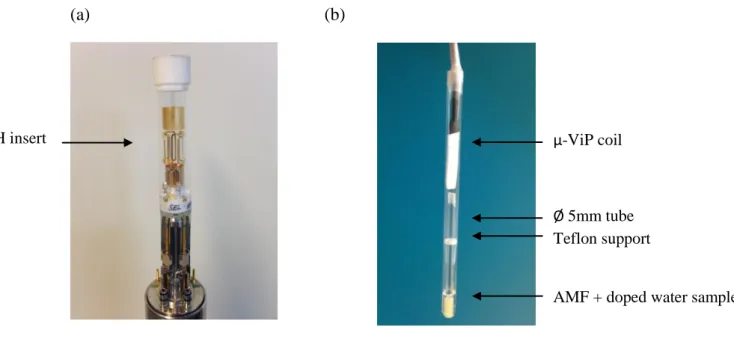
Figure 1 shows the head of the micro-imaging probe (a) and the model sample (b), which consisted of a 5mm diameter tube filled with AMF inside a 10mm diameter tube containing doped and deuterated water (Tube 1). The -ViP coil (in white in figure 1b) was placed close to the transmitter-receiver RF coil in order to transmit the k-space lines of the virtual phantom.inside the image field of view of the object of interest. First, frequency and phase stability of the µ-ViP signal with respect to the MR signals must have been insured at the carrier frequency (500.152 MHz). This was challenging due to the very short cycle time and the corresponding phase shift of 180°per ns of jitter.
(a) (b)
Figure 1 :Micro-imaging probe (a) and model sample (b). The model sampleconsists of a
5mm diameter tube filled with AMF, held by a teflon support inside a 10mm diameter tube containing doped water (Tube 1). The µ-ViP coil (white) is placed and fixed at the top of the 5mm tube before the complete system is introduced into the micro-imaging 1H insert.
µ-ViP coil
Ø 5mm tube Teflon support
AMF + doped water sample
1
6 However, this was achieved thanks to the high stability of both reference frequencies (Bruker and Tecmag hardware). Once the complete system was installed, the µ-ViP coil could be rotated with respect to the transmitter-receiver RF coil in order to adjust the µ-ViP signal strength and to ensure that it broadly matched the real NMR signals. In addition, further fine adjustments of the µ-ViP signal strength could be achieved by changing the transmit gain of the waveform generator.
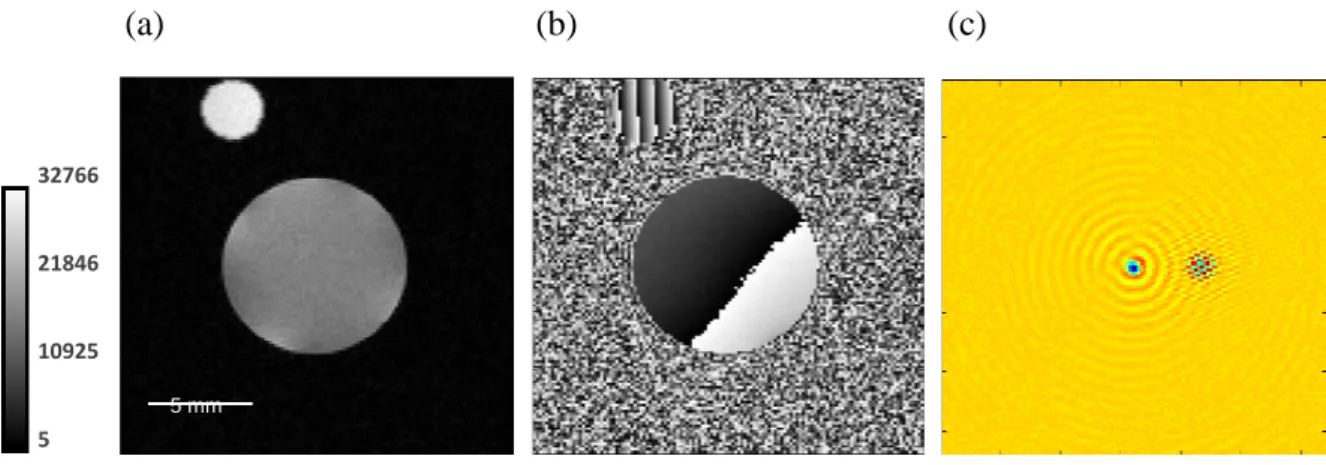
Application of this novel technology is illustrated in Figure 2,where the virtual phantom is positioned near the border of the field of view and the object of interest is a cylindrical tube filled with water (Tube 2). Both the magnitude (Figure 2a) and the phase (Figure 2b) MR imagesare shown. The k-space image (Figure 2c) indicates a slight shift between the k-space center of the object of interest and the k-space center of the virtual phantom. This shift has no effect on the magnitude image; on the other hand, it is responsible for a phase-wrapping, as illustrated in Figure 2b. With a fine tuning of the µ-ViP k-space transmission, it is possible to eliminate this shift (see the Materials and Methods section).Note that in the current study, MRµI was performed using pulse sequences with a Cartesian sampling of the k-space. In the case of MRµI with a non-Cartesian k-space sampling (spiral, radial, etc.), it is still possible to construct a µ-ViP as long as the exact k-space trajectory of the MR pulse sequence is known.
Figure 2 :MR image (magnitude and phase, (a) and (b), respectively) of a cylindrical tube
filled with water (Tube 2) and virtual phantom. The corresponding k-space image is also illustrated in (c). The k-space of the virtual phantom is slightly off-center. FOV=19 mm², matrixsize =128*128. 32766 21846 10925 5 (a) (b) (c) 5 mm
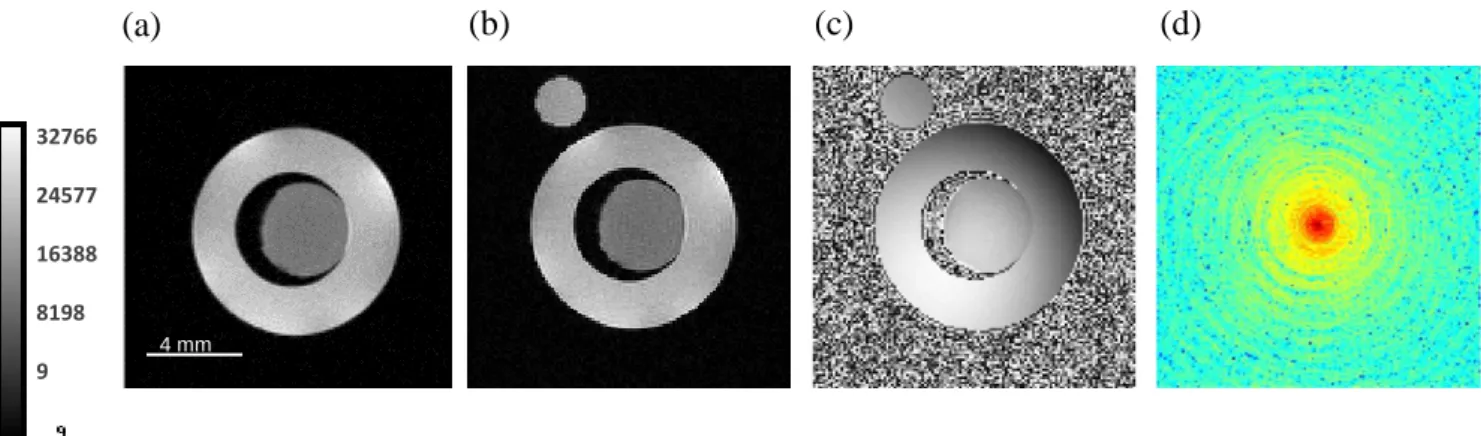
7 Application of this methodology is illustrated in Figure 3 onthe model sample at 15°C (Tube 1). Figure 3a shows the corresponding magnitude MR image while in Figure 3b,the µ-ViP signal was generated on the top and left of the model sample.Achemical shift displacement effect is observed here, due to the chemical shift difference between water and AMF and to the the acquisition parameters used here. The fine tuning of the µ-ViP k-space transmission (Figure 3d) yielded a uniform phase, as shown in Figure 3c. This could be of interest in cases where a phase reference signal, in addition to a magnitude reference signal, is needed.
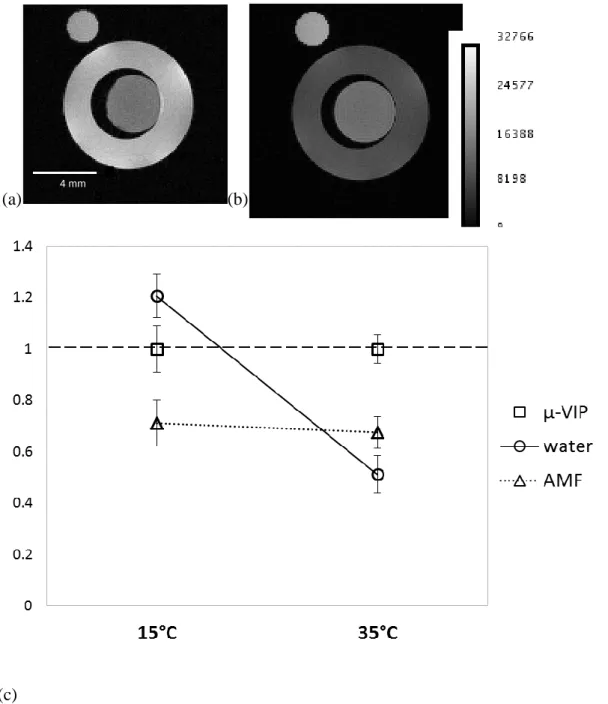
Now, we consider the case where the physical phantom cannot be used as a reference signal. Figure 4 shows images of AMF (object of interest) surrounded by a physical phantom (water) with the generation of µ-ViP at 15°C (Figure 4a) and 35°C (Figure 4b). The problem of using a physical phantom when varying the temperature is related to the well-known Curie’s law which states that the total magnetization is inversely proportional to temperatureTherefore, for a molecule in the same physical state, the temperature increasing induces theMR signal decreasing[23]. This effect is well demonstrated in Figure 4 showing the MR images and the corresponding signal intensity of water, AMF and µ-ViP. Water showed a large signal decreasing, from 1.20 ± 0.08 a.u. at 15°C to 0.51 ± 0.07 at 35°C (Figure 4c). This signal loss was larger than the expected 6.8% decrease (0.34% per °C) expected from the Curie’s law when heating water from 15 to 35°C.This decrease indicates for water a strong T1 variation
with temperature exhibited by the short repetition time (30 ms) used in the FLASH experiment[24]. This is confirmed by the large variation ofthe T1 relaxation time of doped
water, measured at 275 ms at 15°C versus 438 ms at 35°C.
Figure 3 :MR image of the model sample (Tube 1) at 15°C in magnitude mode (a), with ViP
(b), in phase mode with ViP (c) and the corresponding k-space image (d). The k-space of the virtual phantom is well centered with respect to the k-space of the object of interest. FOV=14 mm², matrix=128*128. (a) (b) (c) (d) 4 mm 32766 24577 16388 8198 9
8 By varying the system temperature,the molecules can also changetheir physical state as it occurs in the AMF sample (object of interest), making very difficult theinterpretation of the signal intensity changes. These changesare often observed for temperature-dependent real-time measurements as fat crystal melting for instance.At 15°C, AMF is characterized by a mixture of fat molecules in crystalline (around 10% w:w) and liquid states, while at 35°C, crystals melt and all the fatty components are in liquid state. This characteristic is used in food science for recombination of various dairy products, but also for the chocolate tempering and ice cream manufacturing. This phase transition can be quantified by assessing the MR signal changes of AMF. The raw data (i.e., non-normalized with respect to the µ-ViP signal) for AMF indicated a signal increasing from 14200 ± 650 a.u to 19600 ± 650a.u. at 15 and 35°C, respectively. This 38 % signal increasing is not coherent with the expected decreasing of 6.6% measured in low-field NMR when heating the sample from 15 to 35°C (data not shown). Once data normalization was performed (Figure 4c), the normalized signal of AMF was 0.71 ± 0.09 a.u. at 15°C compared to 0.67 ± 0.06 a.u. at 35°C. This variation is very close to the expected fat signal loss of 6.6 % measured in low-field NMR. Therefore, the data normalization relative to the µ-ViP signal intensity (which is temperature independent) allows for eliminating the confounding factor of the receiver-chain signal fluctuations.
To validate the time stability of the µ-ViP signal, repeated measurements were performed over two hours, the necessary time to regulate the sample temperature with the cooling system of the micro-imaging equipment. The time course of the signal mean value taken in ROIs for the µ-ViP signal, water and AMF is illustrated in Figure 5. The µ-ViP signal and the model sample components (doped water and AMF) were evolving in the same way and stabilities were in the same range (µ-ViP standard deviation 2.8 %, water std 3.4%, AMF sdt 3.3%). These fluctuations are in agreement with previous experiments [2], and could be attributed to instabilities of the imaging system due to drifts or temperature variations. When normalizing the water and AMF signals relative to the µ-ViP signal, their relative fluctuations were reduced by a factor of three (standard deviation of 1%). This cancellation of a large part of the signal fluctuations shows that most of these variations affect equally the µ-ViP and signals from physical objects (doped water and AMF). Therefore, the fluctuations certainly comes mainly from the receiver chain of the spectrometer as already shown by Franconi et al. [2]. This experiment confirms that µ-ViP can be used for quality control and performance measurements of the spectrometer receiver chain.
9
(a) (b)
(c)
Figure 4 :MR images of the model sample (Tube 1) with the µ-ViP signal at 15°C (a) and
35°C (b). Variation in the signal intensity of water and AMF in the model sample at 15 and 35°C (c). Data normalized relative to the µ-ViP signal intensity. FOV=19 mm², matrix=128*128.
10
Figure 5 :Signal stability over 2h at 35°C for µ-ViP (square), doped water (circle) and AMF
(triangle) signals in the model sample (Tube 1).
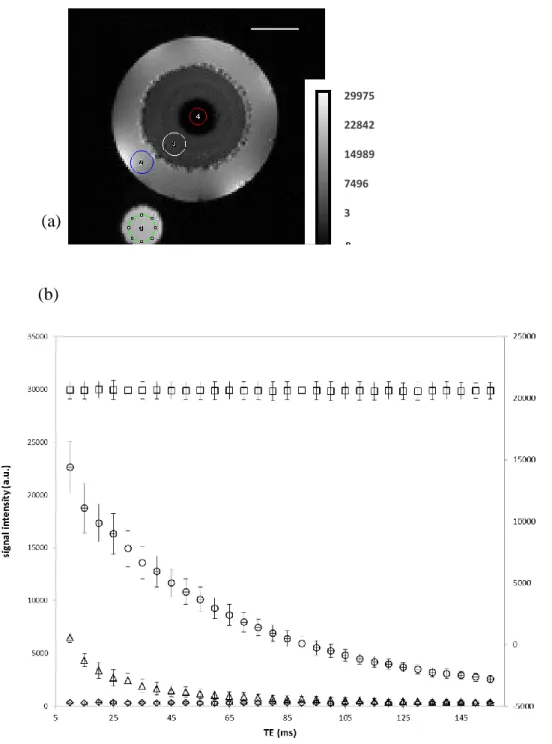
A further application of the µ-ViP technology has been carried out for monitoring the water ingress in a starch-glycerol extrudate (Tube 3). The investigation of the solvent transport phenomenon in solid material such as pharmaceutical excipients and foodstuffs is of interest for many reasons. The process of solvent penetration into solid and porous materialsinvolves a diffusion processgoverned by the concentration gradient of the solvent into the solid matrix but it can also react with the solvent by releasing some molecules (drug relase for example), by swelling or diluting into the medium[25, 26]. The starch-glycerol extrudate studied here was chosen for its memory-shape property and its insoluble character in water[21].Generation of the µ-ViP signal was performedfor each RF pulse of a multi spin echo experiment. The results of this experiment are shown in Figure6for a starch-glycerol extrudateafter three hours of imbibition in doped and deuteratedwater at 22°C. It can be noted that the position of the µ-ViP is different than that in Figure 4. As a matter of fact, one of the advantages of µ-µ-ViP is that the virtual phantom can be placed anywhere in the field of view. Its intensity can also be easily adapted to match that of the observed object in a way to preserve the dynamic range of the image. Four ROIs were selected in order to quantify the signal intensity of µ-ViP, doped
11 water, the water imbibed starch-glycerol matrix, and the intact non-imbibed starch-glycerol part.
(a)
(b)
Figure 6 : MR image of the starch-glycerolextrudate imbibed in doped water at 22°C(Tube 3)
and ROIs (a) used for the calculation of signal intensities as a function of the echo time TE in a multi spin echo experiment (b). ROI1 for µ-ViP (square), ROI2 for doped water (circle), ROI3 for water imbibed starch–glycerol extrudate (triangle) and ROI4 for non-imbibed starch-glycerolextrudate (diamond). A second axis was introduced for the µ-ViP signal points to avoid their overlapping with those of the starch extrudate + water. FOV = 14 mm², matrix=128*128. 29975 22842 14989 7496 3 3 mm
12 The first point of the multi spin echo was deliberately removed from Figure 6, and excluded from data analysis, because ofthe well-know phenomenon of stimulated echo, which affects all echoes except the first one[27]. While the µ-ViP and non-imbibed starch-glycerol signals were stable in intensity, the doped water and water imbibed starch-glycerol extrudate showed an exponential decrease over the acquisition of the echo train. The signal exponential decrease is due to T2 spin-spin relaxation phenomena which yielded T2 values at 53.1 ± 1.9 ms for
doped water (ROI2), while two T2 values, at 5.2 ± 0.5 ms and 30.5 ± 1.5 ms were necessary to
adjust the data of ROI3 from the imbibed starch-glycerol extrudate. These values were coherent with expected T2 values, in particular that measured for doped water imbibing the
extrudate (ROI2) which was lowered compared to pure doped and deuterated water, due to glycerol leaching during the starch-glycerol extrudate imbibition.
4. Conclusion
The issue of this study was the generation of a virtual imaging phantom when there is no sufficient space into the probe to introduce an additional physical phantom. This is the case of micro-imaging probes that are characterized by a limited available space due to the small bore of the magnet further restricted by the gradient coil insert around the RF coil. The major advantage of µ-ViP at high frequency (500 MHz in our case) is to correct for electronic fluctuations over time. Once the µ-ViP is calibrated (signal power and position), it may be used for quantitative measurement without additional adjustments, independently of the sequence used.Despite the MR quantification confounding factors that cannot be taken into account by the µ-ViP method (T1-effects or RF inhomogeneities, for instance), this method
represents a step towards improvement of the MR signal quantification in small samples.Other advantages of the µ-ViP method include its use as a reference signal for real-time experiments while the temperature or moisture is changed or for acquisitions using long multi pulse sequences.
5. Acknowledgements
This work was performed using the NMR facilities of the PRISM Research Platform (Rennes, France). The access to the 11.7 T spectrometer and especially his manager, A. Bondon (Université Rennes 1, France) is kindly acknowledged. The authors thank the Regional
13 Council of Brittany (Rennes, France) and the GIS IBISA (Infrastructures en Biologie, Santé et Agronomie, France) for their financial support (PhD grant and waveform signal generator, respectively).
6. References
[1] L. Barantin, A. LePape, S. Akoka, A new method for absolute quantitation of MRS metabolites, Magnetic Resonance in Medicine 38 (1997) 179-182.
[2] F. Franconi, C. Chapon, L. Lemaire, V. Lehmann, L. Barantin, S. Akoka, Quantitative MR renography using a calibrated internal signal (ERETIC), Magnetic Resonance Imaging 20 (2002) 587-592.
[3] H. Desal, N.P. Alonso, S. Akoka, Electronic reference for absolute quantification of brain metabolites by H-1-MRS on clinical whole-body imaging, Journal of Neuroradiology 37 (2010) 292-297.
[4] A.B. Boizan, G. Gambarota, F. Noury, H. Saint-Jalmes, A Single Phantom to Mimic H-1 MR Spectra of Different Tissues, Concepts in Magnetic Resonance Part A 43 (2015) 138-145. [5] T.I. Kojima, A.K. Horigane, M. Yoshida, T. Nagata, A. Nagasawa, Change in the status of water in Japanese noodles during and after boiling observed by NMR micro imaging, Journal of Food Science 66 (2001) 1361-1365.
[6] K.L. McCarthy, J.J. Gonzalez, M.J. McCarthy, Change in moisture distribution in lasagna pasta post cooking, Journal of Food Science 67 (2002) 1785-1789.
[7] A.K. Horigane, H. Motoi, K. Irie, M. Yoshida, Observation of the structure, moisture distribution, and oil distribution in the coating of tempura by NMR micro imaging, Journal of Food Science 68 (2003) 2034-2039.
[8] H.M. Lai, S.C. Hwang, Water status of cooked white salted noodles evaluated by MRI, Food Research International 37 (2004) 957-966.
[9] F. Bonomi, M.G. D'Egidio, S. Iametti, M. Marengo, A. Marti, M.A. Pagani, E.M. Ragg, Structure-quality relationship in commercial pasta: A molecular glimpse, Food Chemistry 135 (2012) 348-355.
[10] M. Bouhrara, S. Clerjon, J.-L. Damez, C. Chevarin, S. Portanguen, A. Kondjoyan, J.-M. Bonny, Dynamic MRI and Thermal Simulation To Interpret Deformation and Water Transfer in Meat during Heating, Journal of Agricultural and Food Chemistry 59 (2011) 1229-1235. [11] M. Bouhrara, S. Clerjon, J.-L. Damez, A. Kondjoyan, J.-M. Bonny, In Situ Imaging Highlights Local Structural Changes during Heating: The Case of Meat, Journal of Agricultural and Food Chemistry 60 (2012) 4678-4687.
[12] M. Bouhrara, B. Lehallier, S. Clerjon, J.-L. Damez, J.-M. Bonny, Mapping of muscle deformation during heating: in situ dynamic MRI and nonlinear registration, Magnetic Resonance Imaging 20 (2012) 422-430.
[13] D. Bernin, T. Steglich, M. Roeding, A. Moldin, D. Topgaard, M. Langton, Multi-scale characterization of pasta during cooking using microscopy and real-time magnetic resonance imaging, Food Research International 66 (2014) 132-139.
14 [14] A. Mohoric, F. Vergeldt, E. Gerkema, A. de Jager, J. van Duynhoven, G. van Dalen, H. Van As, Magnetic resonance imaging of single rice kernels during cooking, Journal of Magnetic Resonance 171 (2004) 157-162.
[15] M. Wagner, S. Quellec, G. Trystrarn, T. Lucas, MRI evaluation of local expansion in bread crumb during baking, Journal of Cereal Science 48 (2008) 213-223.
[16] M.J. Wagner, M. Loubat, A. Sommier, D. Le Ray, G. Collewet, B. Broyart, H. Quintard, A. Davenel, G. Trystram, T. Lucas, MRI study of bread baking: experimental device and MRI signal analysis, International Journal of Food Science and Technology 43 (2008) 1129-1139. [17] M.D. Mantle, Quantitative magnetic resonance micro-imaging methods for pharmaceutical research, International Journal of Pharmaceutics 417 (2011) 173-195.
[18] M.D. Mantle, NMR and MRI studies of drug delivery systems, Current Opinion in Colloid & Interface Science 18 (2013) 214-227.
[19] H. Saint-Jalmes, P.-A. Eliat, J. Bezy-Wendling, A. Bordelois, G. Gambarota, ViP MRI: virtual phantom magnetic resonance imaging, Magnetic Resonance Materials in Physics Biology and Medicine 27 (2014) 419-424.
[20] R. Salvati, E. Hitti, J.J. Bellanger, H. Saint-Jalmes, G. Gambarota, Fat ViP MRI: Virtual Phantom Magnetic Resonance Imaging of water-fat systems, Magnetic Resonance Imaging 34 (2016) 617-623.
[21] A. Beilvert, F. Chaubet, L. Chaunier, S. Guilois, G. Pavon-Djavid, D. Letourneur, A. Meddahi-Pelle, D. Lourdin, Shape-memory starch for resorbable biomedical devices, Carbohydrate Polymers 99 (2014) 242-248.
[22] C.A. Schneider, W.S. Rasband, K.W. Eliceiri, NIH Image to ImageJ: 25 years of image analysis, Nat Meth 9 (2012) 671-675.
[23] V. Rieke, K. Pauly, MR Thermometry, Journal of magnetic resonance imaging 27 (2008) 376-390.
[24] A. Abragam, The principle of Nuclear Magnetism Clarendon Press:Oxford (1961). [25] C.A. Fyfe, A.I. Blazek-Welsh, Quantitative NMR imaging study of the mechanism of drug release from swelling hydroxypropylmethylcellulose tablets, Journal of Controlled Release 68 (2000) 313-333.
[26] B. Narasimhan, Mathematical models describing polymer dissolution: consequences for drug delivery, Advanced Drug Delivery Reviews 48 (2001) 195-210.
[27] C.S. Poon, R.M. Henkelman, Practical T2 quantitation for clinical-applications, Journal of Magnetic Resonance Imaging 2 (1992) 541-553.