HAL Id: hal-00091874
https://hal.archives-ouvertes.fr/hal-00091874v2
Submitted on 8 Sep 2006HAL is a multi-disciplinary open access archive for the deposit and dissemination of sci-entific research documents, whether they are pub-lished or not. The documents may come from teaching and research institutions in France or abroad, or from public or private research centers.
L’archive ouverte pluridisciplinaire HAL, est destinée au dépôt et à la diffusion de documents scientifiques de niveau recherche, publiés ou non, émanant des établissements d’enseignement et de recherche français ou étrangers, des laboratoires publics ou privés.
An original methodology of measurements for ozone
detection in a mix (O3,NO2) with pseudo-schottky
Pd-InP gas sensor
Lionel Mazet, Christelle Varenne, Jerome Brunet, Alain Pauly, Katarzyna
Wierzbowska, Laure Berry
To cite this version:
Lionel Mazet, Christelle Varenne, Jerome Brunet, Alain Pauly, Katarzyna Wierzbowska, et al.. An original methodology of measurements for ozone detection in a mix (O3,NO2) with pseudo-schottky Pd-InP gas sensor. 2005, pp. �hal-00091874v2�
AN ORIGINAL METHODOLOGY OF MEASUREMENTS
FOR OZONE DETECTION IN A COMPLEX GASEOUS PHASE (O
3, NO
2)
WITH PSEUDO-SCHOTTKY Pd-InP GAS SENSOR.
L. MAZET, C. VARENNE*, J. BRUNET, A. PAULY, K. WIERZBOWSKA, L. BERRY.
LASMEA, UMR 6602 du CNRS,Université Blaise Pascal, Clermont-Ferrand II, 24 avenue des Landais 63177 Aubière Cedex, France
email:christelle.varenne@lasmea.univ-bpclermont.fr
Phone : 334.734.07246 / Fax : 334.734.07340
Abstract : This article deals with Pseudo-Schottky diode consists of InP-p gas sensor with metallized layer of
Palladium. In a first time, original results of carbon monoxide action (CO) on metallized layer are shown. It can be seen that Pseudo-Shottky diode submission to CO avoided the degradation of gas sensor parameters by ozone. Then an original methodology of measurements that takes avantages of gas sensor selectivity towards ozone, to follow in real time variations of concentration, is described.
Keywords: gas sensor, Schottky diode, ozone
1. INTRODUCTION
In the field of solid-state chemical sensors, Schottky diodes and related devices (MOSFET, MIS structures,..) incorporating catalytic metallization, have been widely studied for their sensing potentialities towards hydrogen and hydrogen-containing gases. The detection mechanism is in the consequence of the modification of the metal work function [1]. In the case of Schottky diodes, this modification reflects on the Schottky barrier height of the rectifying contact.
In our team, the Pseudo-Schottky diode based on similar reaction processes as the Schottky diodes, to detect Ozone (O3) and Nitrogen
Dioxide (NO2), were developed.
2. EXPERIMENTAL
The measurement are based on an original Schottky diode gas sensors : Pseudo-Schottky junctions on p-type InP substrates. Such devices were realised by sequential evaporations of Palladium (Pd) and Germanium (Ge) layers on the p-type substrate, followed by a gradual annealing process which enables the Germanium to diffuse and thus create a thin n-type layer. This thin n-type InP layer, inserted between the Schottky metallization and the p-type InP substrate, permits to increase the Scottky barrier diode [2].
After electrical characterizations, the Pseudo-Schottky diodes were pasted onto alumina heating substrates and then fixed on a TO-8 socket. Gas test experiments were performed in a stainless steel measuring cell, by recording current variations of the structure polarized under a fixed bias voltage of 1Vdc, at an optimum working temperature of 100°C.
3.RESULT
Preliminary results, exposed in a previous article [3], have shown that this structure presents good sensitivity to different concentrations NO2 (20, 50, 80, 100ppb
diluted in purified air) and a low threshold of detection.
As sensitivity decreases and response time becomes shorter when operating temperature increases, an optimum temperature of 100°C have been chosen for future experiments. 3.1. Sensor response of mix of NO2-O3
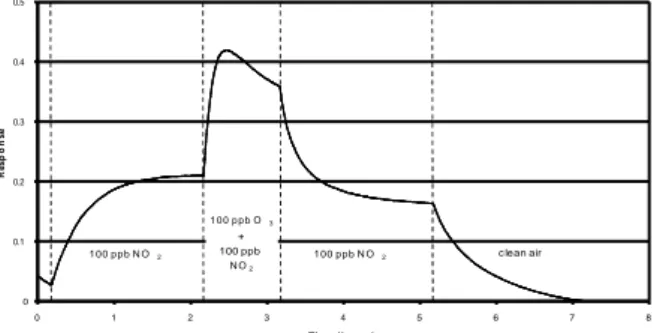
This first experiment consists in structure submission to 100 ppb of N02 during 5 hours .
Then a supplementary concentration of 100 ppb of O3 is superposed during 1 hour (figure
1).
The increase of intensity during ozone exposure came from the occupation of free adsorption sites and/or sites with higher energy than these occupied by nitrogen
dioxide.
Fig. 1. Sensor response to 100 ppb of NO2 for 5h, and
additional 100 ppb of O3 during 1h. 0 0.1 0.2 0.3 0.4 0.5 0 1 2 3 4 5 6 7 8 Tim e ( hours ) R e s p o n s e 100 ppb N O2 1 0 0 p p b O3 + 100 ppb N O2 c lean air 100 ppb N O2
The second experiment consists in structure submission to a constant ozone concentration (20 ppb) during 3 hours. 100 ppb of NO2
during 1 hour was added to study the competition between these two gases (figure 2).
A weak more number of adsorption sites is therefore requested during the exposure to this additional concentration of NO2. We can
assume that adsorption sites usually solicited by nitrogen dioxide molecules are occupied by ozone species. This phenomenon is linked to the facility of the ozone, gas with character more oxidizing than NO2, to occupy active
sites of absorption.
Fig. 2. Sensor response to 20 ppb of O3 for 3h, and
additional 100 ppb of NO2 during 1h.
Nitrogen dioxide, chemically more stable than ozone, exhibits therefore a less oxidizing power and is chemically less active ; a same ozone concentration as nitrogen dioxide allows therefore to solicit sites of adsorption supplementary of energy superior, and induces a more important reponse of the sensor.
In a gas mixture where these two species coexist simultaneously, we can therefore detect selectively ozone.
3.2. Sensor response of O3- Regeneration
Figure 3 represents intensity variations of a structure submitted to 10 consecutive ozone levels. During each cycle sensor is submitted during 2 hours to 100 ppb of ozone steady by 3 hours of desoprtion under clean air at 100°C. This figure shows an irreversible increase of the baseline from the first submission to ozone, linked to the increase of the metal work function, illustrating the poisonous effect of ozone on the palladium metallization.
Fig. 3. Response of the sensor submitted to 10 successive levels of 100ppb of ozone at 100°C
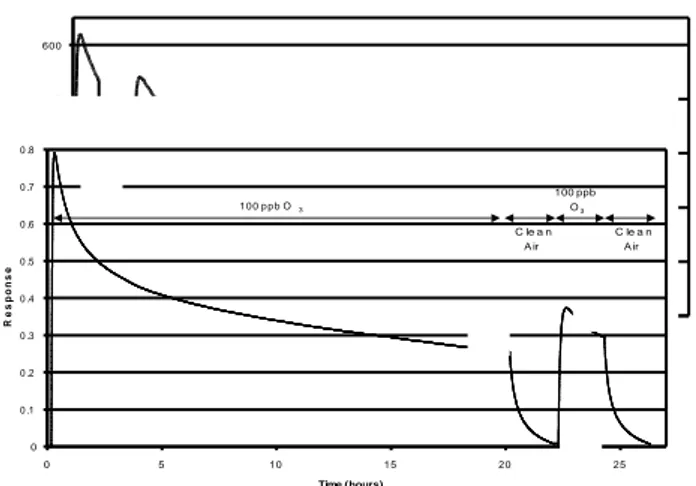
All phenomena occuring in ozone/Pd-InP interaction are pointed up on the figure 4, which represents the response of a Pseudo-Schottky diode to 100 ppb of ozone during 20 hours, followed by an identical concentration level of 2 hours at 100°C.
Fig. 4. Sensor response to 100 ppb of O3 for 20h and
after 100 ppb of O3 during 2h.
The response can be explained by different steps: from A to B, the fast increase of the response is due to the adsorption of O3
molecules on surface actives sites which increases the palladium work function.
Curve between B and C, corresponds to subsurface oxygen creation, due to the migration of oxygen species under the surface.This displacement of atoms entails a decrease of Pd work function, and consequently a decrease of sensor current. Following a desorption under clean air during 2 hours (from the point C to the point D) the constant time of desorption of the last phenomena is so important that we are at E point for the next submission.
We can therefore notice that Pseudo-Schottky diodes realized with palladium shows, during their submission to ozone, two reversible phenomena: adsorption of ozone molecules which have a desorption constant time very short and the formation subsurface oxygen which present a desorption constant time more important.
To reduce influence of subsurface oxygens, a regeneration of the structure by submission to
400 440 480 520 560 600 0 10 20 30 40 50 Time (hours) I n t e n s it y ( n A ) 0 0 .1 0 .2 0 .3 0 .4 0 1 2 3 4 5 6 T ime ( h ou rs ) R e s p o n s e 2 0 p p b O3 2 0 p p b O3 + 1 0 0 p p b N O2 2 0 p p b O3 c lean air 0 0 .1 0 .2 0 .3 0 .4 0 .5 0 .6 0 .7 0 .8 0 5 10 15 20 25 Time (hours) R e s p o n s e 1 0 0 p p b O3 100 ppb O3 C le a n A ir C le a n A ir
reducing gas such as carbon monoxide (CO) [4], has been investigated.
Figure 5 represents sensor response to 100 ppb of O3 : a) initial response, b) after many
O3 submissions and c) after regeneration
under CO. We can notice that the curves (a) and (c) are nearly overlaid. Effect of CO on subsurface oxygens seems sufficient to realize successive reproducible measurements in presence of ozone.
Fig. 5. Sensor response to 100 ppb of O3 : a) initial
response, b) response after many O3 submissions and c)
after regeneration under CO.
4. METHODOLOGY OF MEASUREMENT
4.1.MethodologyThe principle of this methodology consists in cyclic measurement under oxidizing gas and regeneration process of the sensor associating the increase of the temperature to the action of the reducing gas CO. Time of submission will be optimized to take advantage of the great kinetic of sensor response after the first minute exhibition.
This methodology of measurement can be dissociated in 5 steps illustrated by figure 6 : - Step I : sensor was exposed, at low temperature (100°C), to ozone. During this period, the variation of intensity through the structure was measured (I).
- Step II and III : sensor was submitted under clean air mixed with CO allowing to reduce partially or totally the subsurface oxide layer. - Step IV : “cleaning” of the layer at high temperature (180°C), under clean air. It allows to favor the desorption of the major parts of gaseous species produced during the reduction process.
- Step V : its objective is to stabilize the sensor responses under clean air at working temperature (100°C) so as to determine the initial intensity.
Fig. 6. Typical intensity variations of a Pseudo-Schottky structure during the cycle of measurement with the new methodology.
Therefore, to implement this methodology, we have developed a micro-system, ordered by a microprocessor.
4.2.Result
This microsystem ensures to follow O3
concentrations variations, in a range of 20 to 100 ppb (figure 7) in agreement with O3 rate
present in atmosphere.
Fig. 7. Variation of sensor intensity submitted alternatively to various ozone concentrations and cycle of regeneration under CO.
It results from the curve that the relative dispersion remains weak, it represents 3% the measure, it insures a good reproductibility of measurements. The resolution of our device has been evaluated to 10 ppb of ozone.
5. CONCLUSION
It was shown that the presented in this article sensor structure is characterized by predominant sensitivity to O3 in presence of a
mix of O3 and NO2.
Also, it was shown that the treatment with CO of Pseudo-Schottky diode permits the regeneration of the sensitive layer and leads to reproducible ozone measurements.
Therefore, an original microsystem involving alternate cycles of ozone submission and
0 0 .1 0 .2 0 .3 0 .4 0 .5 0 .6 0 .7 0 .8 0 0 .5 1 1 .5 2 2 .5 3 3 .5 4 T i m e (h o u rs ) R e s p o n s e i n i ti a l
aft er oz one submission
aft er C O reduction 10 11 12 13 14 15 16 17 0 10 20 30 40 50 60 C ycle number In t e n s it y v a r ia t io n s ( n A ) 0 20 40 60 80 100 120 O zo n e c o n c e n t r a t io n ( p p b )
active layer cleaning have been developed. Results obtained with this original microsystem allow to insert this sensor into pollution investigation of the urban atmosphere.
REFERENCES
1. I. Lundström, C. Svensson, Solid State Chemical
Sensors, (Academic Press, Inc., 1985).
2. L.Talazac, F. Barbarin, C. Varenne, L. Mazet, S. Pellier, C. Soullier, Sensors and Actuators B, 83 (2002), pp 149-159.
3. L. Mazet, C. Varenne, A. Pauly, J. Brunet, J.P. Germain, Sensors and Actuators B, 103 (2004), pp 190-199.
4. V.A. Bondzie, P.H. Kleban, D.J. Dwyer, Surface