HAL Id: halshs-01217417
https://halshs.archives-ouvertes.fr/halshs-01217417
Preprint submitted on 19 Oct 2015HAL is a multi-disciplinary open access archive for the deposit and dissemination of sci-entific research documents, whether they are pub-lished or not. The documents may come from teaching and research institutions in France or abroad, or from public or private research centers.
L’archive ouverte pluridisciplinaire HAL, est destinée au dépôt et à la diffusion de documents scientifiques de niveau recherche, publiés ou non, émanant des établissements d’enseignement et de recherche français ou étrangers, des laboratoires publics ou privés.
Take in the Context of Uncertainty in Crude Oil Prices:
The Case of Chad
Guy Dabi Gab-Leyba, Bertrand Laporte
To cite this version:
Guy Dabi Gab-Leyba, Bertrand Laporte. Oil Contracts, Progressive Taxation and Government Take in the Context of Uncertainty in Crude Oil Prices: The Case of Chad. 2015. �halshs-01217417�
C E N T R E D'E T U D E S E T D E R E C H E R C H E S S U R L E D E V E L O P P E M E N T I N T E R N A T I O N A L
SÉRIE ÉTUDES ET DOCUMENTS
Oil Contracts, Progressive Taxation and Government Take in the
Context of Uncertainty in Crude Oil Prices: The Case of Chad
Guy Dabi Gab-Leyba
Bertrand Laporte
Études et Documents n° 25
October 2015
To cite this document:
Gab-Leyba G. D., Laporte B. (2015) “Oil Contracts, Progressive Taxation and Government
Take in the Context of Uncertainty in Crude Oil Prices: The Case of Chad”, Études et
Documents, n°25, CERDI.
http://cerdi.org/production/show/id/1741/type_production_id/1
C
ERDI65
BD.
F.
MITTERRAND63000
CLERMONT FERRAND–
FRANCE TEL.
+
33
4
73
17
74
00
FAX
+
33
4
73
17
74
28
2
The authors
Guy Dabi Gab-Leyba
PhD Student
Clermont Université, Université d'Auvergne, CNRS, UMR 6587, CERDI, F-63009 Clermont Fd.
Email :
Guy_Dabi.Gab-Leyba@etu.udamail.fr
Bertrand Laporte
Associate Professor
Clermont Université, Université d'Auvergne, CNRS, UMR 6587, CERDI, F-63009 Clermont Fd.
Email:
bertrand.laporte@udamail.fr
Corresponding author: Guy Dabi Gab-Leyba
This work was supported by the LABEX IDGM+ (ANR-10-LABX-14-01) within the program “Investissements d’Avenir” operated by the French National Research Agency (ANR).
Études et Documents are available online at: http://www.cerdi.org/ed
Director of Publication: Vianney Dequiedt Editor: Catherine Araujo Bonjean
Publisher: Mariannick Cornec ISSN: 2114 - 7957
Disclaimer:
Études et Documents is a working papers series. Working Papers are not refereed, they constitute
research in progress. Responsibility for the contents and opinions expressed in the working papers rests solely with the authors. Comments and suggestions are welcome and should be addressed to the authors.
3 Abstract
Concession Contracts (CC) and Production Sharing Contracts (PSC) have quite different implications for Government Take and the properties of the tax system, such as progressivity. In general, taxation via CC introduces significant distortions in activity, particularly due to the balance of royalties which tax production irrespective of the profitability of the project. So CC is normally regressive while PSC is normally progressive, because PSC taxation depends more directly on the profitability of the project. Chad has the distinction of having introduced PSC in the 2007 Chad oil code, while maintaining a royalty on production. Despite this feature, we show with a Cash Flow model and Monte Carlo simulations that the application of the 2007 oil code introduced more progressivity into taxation. This feature is particularly interesting in the current context of falling crude oil prices, because it maintains a favorable tax regime for exploration and exploitation by multinational oil companies. As a result, the Chad government should reactivate a counter-cyclical policy of oil revenue reserves when the crude oil price increases again.
Keywords: Government Take ; Oil revenues ; Oil tax ; Monte Carlo simulation ; Uncertainty ; Chad.
JEL Code : E27, E62, H21, N5.
Acknowledgment: Our thanks go to Denis Paye (Expertise France) and Céline de Quatrebarbes (FERDI) for their comments.
4 Introduction
Industries such as those in the oil extraction sector can generate considerable income. Applying a tax system that captures a big part of the rent while providing incentives for exploration and development of new oil fields by International Oil Companies (IOCs) is therefore the priority of oil producer Developing Countries. There is a specific tax system in the oil sector because of the sector’s special features, including massive investment and a necessarily complex technology controlled by IOCs
(Petermann et al, 2007). The issue of rent sharing, and therefore the tax system, is a major challenge
for Chad, whose economy is heavily dependent on oil. In 2013 oil accounted for over 70% of Chad’s tax revenues, 90% of total exports, and 30% of nominal GDP (IMF, Report No. 13/284).
The discovery of oil in Chad goes back more than 40 years, but political tensions and major logistical barriers to the export of oil delayed the exploitation of crude until 2003. From 2000, the World Bank support accelerated the construction of a pipeline. At a cost of USD 4.2 billion, this pipeline then represented the biggest private investment in Sub-Saharan Africa. Chad had proven reserves of crude of around 1.5 billion barrels at end 2013, which puts it in 10th place in Africa. After reaching a peak of 173,000 barrels per day in 2005, production steadily declined to 91,000 barrels per day in 2013.The inauguration of new fields in 2014 stopped the downward trend in oil production. These fields should stabilize the production level at around 88 million barrels in 2017 (IMF, Report No. 14/282). In the absence of new discoveries, production will decrease gradually and be completed by 2034.
A few years after the beginning of oil extraction, a major disagreement occurred between the government and the IOC consortium1 about the oil revenue-sharing agreements. The 19882Agreement covers the extraction of oil from three of the original Doba fields3. The Petroleum Code of 1962, which gives the outlines of the contractual relationship between Chad and the IOCs, is based on CC. The two main tax instruments are royalties and corporate tax.
The low Government Take4 is due to the taxation arrangements which were designed to attract IOCs because of the low quality of Chad crude oil, high transport costs (no coastline, construction of a pipeline), and generally high operating risks (Leenhardt, 2005). The government’s inexperience in negotiations with the IOCs is another reason which explains that this share was deemed unfair by the government (Margonelli, 2007).
1Initially Chevron, Exxon Mobil, and Petronas.
2The first version of this agreement of the CC kind was signed on December 19th 1988. This version was
amended on May 19th 1993, March 12th 1997 and finally October 16th 1999.
3Komé, Miandoum and Bolobo. 4
The Government Take for a given field, a concession or a basin is the ratio of the sum of the undiscounted net cash flow accruing to the State over the entire commercial life of the deposit based on the total net Cash flow generated by oil operations (including related research investment deposit, concession or basin). (Leenhardt B.,
5
In 2004 the government tried to renegotiate the tax system of the 1998 Agreement. Despite the 1.6 million USD in legal aid provided by the World Bank, the renegotiation has not resolved the disagreement on Government Take, because of a non-retroactivity clause which locks the key provisions of the 1988 Agreement (Gary and Reisch, 2004).This disagreement crystallized following the rise in crude oil prices since 2004, which allowed a rapid return on investment5. To modify the terms of sharing of oil revenues, the new 2007 oil code substitutes the Production Sharing Contract (PSC) for the CC.
There is no "standard" CC or PSC. These are different instruments and methods of taxation that impact differently in the way they approach oil revenue sharing. Both types of contract can therefore, in principle, enable the Government to achieve its objectives of oil revenue sharing. Given the importance of oil to the Chad economy and the need for further exploration activities and field development, despite the unfavorable economic climate and the fall in oil prices, this paper compares the two kind of contracts used in Chad mainly through Government Take and the incentive nature of the tax design. The rest of the paper is organized in three sections. The first section presents the oil tax design and its evolution. The second part presents the literature and describes the methodology and data used in our model. The third gives the results and analyzes the changes between the two agreements.
The tax regime design for the upstream oil sector in Chad: Concession Contract versus Production Sharing Contract
Chad's oil tax regime is defined by its 2007 oil code (Act No. 006/PR/2007 of 2 February 2007), supplemented by Decree No. 796/PR/PM/MPE/2010 which lays down detailed rules, and Ordinance No. 001/PR/2010 approving the PSC. If these texts constitute the institutional framework for reference in legal and tax matters for the sector, the CC signed before 2007, under the Ordinance No.007/PC/TP/MH February 3rd 1962, remains in effect. These are primarily the agreements signed in December 1998 and May 2004 concerning the operation of the Doba field, the agreement signed in February 1999 confirmed in 2012 by the CNPCIC, and the agreement signed in January 2006 confirmed in 2012 by OPIC Africa (Taiwanese national oil company).
Concession Contract Agreements
For the operations of the Doba basin, three legal documents bind the IOC Consortium, Chad, and Cameroon. Firstly the establishment of the two agreements for the operating companies for; a. the Cameroon side Chad pipeline downstream, and b. "research convention, exploitation and transportation of hydrocarbons” upstream, both dating from 1988 and which were subject to later
5
According to the 2012 Exxon Mobil Annual Report, the rise in crude prices starting in 2004 allowed a rapid return on investments, and early payment of Corporate Tax in 2006 (Project Update No. 33).
6
revision (amendment No. 2, March 1997), these two documents set out the modalities for the management of the pipeline (royalties, taxation and law, litigation between the parties, etc.). The third between Chad and the Consortium only, establishes the taxes levied on operations.
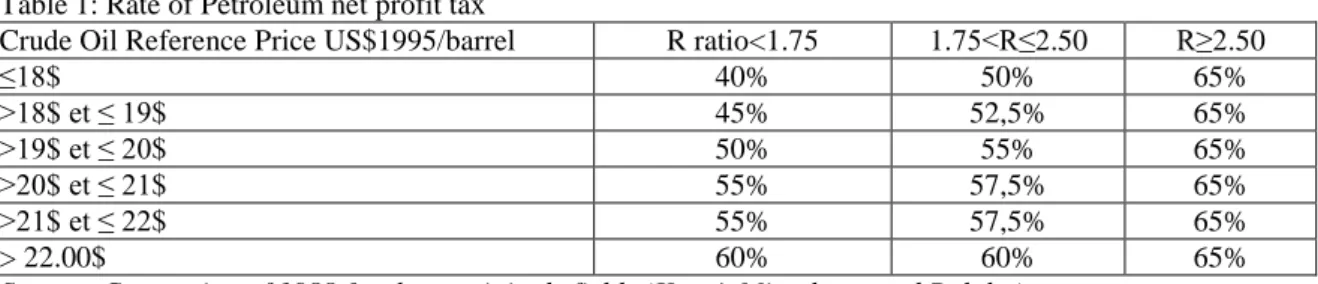
The Convention of 1988, supplemented by the 2004 agreement, based on the 1962 oil code enshrines the concession system as the sharing mode for oil revenues. The tax provisions of the Code concern mainly the application of a royalty and a net profit tax (corporate tax). The royalty rate is fixed in the 1962 code at 12.5%. It was increased in 2004 to 14.25% at the signing of the agreement governing the new fields of Timbré and Maikeri. The net profit tax rate depends on the field. Apart from the Nya and Moundouli fields to which is applied a single rate of 50%, the other fields are subject to a rate that varies with the price of crude and an R factor, calculated as the ratio between revenue accumulated net after-tax upstream of the investor and the investors’ cumulative upstream investment costs.
Table 1: Rate of Petroleum net profit tax
Crude Oil Reference Price US$1995/barrel R ratio<1.75 1.75<R≤2.50 R≥2.50
≤18$ 40% 50% 65% >18$ et ≤ 19$ 45% 52,5% 65% >19$ et ≤ 20$ 50% 55% 65% >20$ et ≤ 21$ 55% 57,5% 65% >21$ et ≤ 22$ 55% 57,5% 65% > 22.00$ 60% 60% 65%
Source: Convention of 1988 for three originals fields (Komé, Miandoum and Bolobo)
These agreements allow for several exemptions - the contractual minimum tax (IMF), patent fees, land tax, Value Added Tax (VAT), duties and taxes on petroleum products, vehicle taxes, levies on dividend distributions, and technical assistance. Lastly, the 1988 Convention contains a stability clause (Article 34) which “fixes” the terms of sharing of oil revenues.
Production Sharing Contract Agreements
The 2007 oil code and the application laws that followed were initiated to increase the share of oil revenues collected by the Government. The 2007 oil code maintains a royalty on production at rates ranging from 14.25 to 16.5% and introduces a public capital stake of the Societé des Hydrocarbures du Tchad (SHT)6 in the capital of the private operator, which may not exceed 20%. The maximum public capital stake was set in 2014 at 25% in future farm projects following the renegotiation of exploration contracts with the China National Petroleum Corporation International (CNPCIC). This state participation is made in return for payment without interest in proportion to the costs of the search and development operations of oil fields (Paragraphs 4a and 4b of the Petroleum Code’s Article 14).
7
The production sharing contract between SHT and the private operator shares net crude oil production that is the crude oil production less the amount of crude oil which covers production costs (cost oil). The code states that these costs cannot exceed 70% of crude oil production minus the royalties levied on all contractual areas. The remainder of the crude oil production, the profit oil, is split between the private operator and the SHT according to an R factor (Table 2). The numerator is the amount of sales accumulated since the beginning of the operation until the last quarter before the quarter for the sale, less accumulated operating costs (operational costs and investments) in the same period. The denominator is the sum of the accumulated costs of development operations and costs of exploratory activities conducted.
Table 2: Profit Oil distribution scheme
R Factor <2.25 2.25<R<3 >3 IOC's share in the Profit Oil 60% 50% 40% OPC’s share in the Profit Oil 40% 50% 60%
Source: PSC between Chad and PETROCHAD MANGARA.
A statistical royalty is also levied on the value of oil exports. Its tax base is the value of exported crude oil, which is slightly different from the production of crude oil due to the existence of an amount taken from the pipeline to operate the pumping centers. The statistical royalty rate is 1% for the 1998 agreement, and 1.5% for the 2004 agreement. The 2007 oil code introduced two types of bonuses. The Signature Bonuses whose amount is not fixed, and Attribution Bonuses for an exclusive operating license whose amount is set at $ 2 million. These two types of bonuses are considered as an unrecoverable oil cost.
8 Table 3: List of oil exploitation in Chad and nature of contract
companies in production
Operator Bloc Partner Nature of contract Date of signature International Oil Companies
1 Esso E&P CHAD (40%) Chari Bolobo
Chari Komé Chari Maikeri Chari Timbré Chari Moundouli Chari Miandoum Chari Nya
Petronas Caligari (35%) and Chevron Petroleum Chad (25%)
Concession Contract December 1988 and June
2004 EXXONMOBIL (United States) 2 CNPCI (100%) H (Rônier) H (Mimosa) H (Madiago)
Concession Contract February 1999 CNPC (China)
3 GLENCORE ENERGY (75%) DOB
DOI
SHT (25%) Production Sharing Contract Glencore-Xstrata
(Switzerland)
Companies in exploration
1 CNPCIC (100%) H (Bongor Est)
H (BongorOuest) H (Chari Ouest) H (Lac Tchad) H (Madiago Est) H (MadiagoOuest) H (Sédigui)
Concession Contract February 1999 CNPC (China)
2 OPIC (70%) Chari Ouest III (50%)
Chari Sud II Lac Tchad I
SHT (30%) Concession Contract January 2006 CPC (Taiwan)
3 ERHC ENERGY (100%)
ERHC ENERGY (100%) ERHC ENERGY (100%)
BDS-2008
Chari Ouest III (50%) Manga
Production Sharing Contract ERHC Energy Inc.
(United States)
4 GLOBAL PETROLEUM (100%) Djado III
DOE DOF DOG Largeau V
Production Sharing Contract Nigeria
5 GLENCORE ENERGY (100%)
GLENCORE ENERGY(100%) GLENCORE ENERGY(100%)
Borogop Chari Est Doséo DOH
Production Sharing Contract Glencore-Xstrata
(Switzerland)
9 PETRA BV (100%) PETRA BV (75%) PETRA BV (75%) PETRA BV (75%) PETRA BV (75%) PETRA BV (100%) Erdis 2008 Erdis V Lac Tchad MD-2008 Siltou I Siltou II SHT (25%) SHT (25%) SHT (25%) SHT (25%) STR GROUP (Brazil)
8 SAS PETROLEUM (75%) Erdis IV SHT (25%) Production Sharing Contract
9 SIMBA ENERGY (100%) Chari Sud I
Chari Sud II (50%) Erdis III
Production Sharing Contract SIMBA ENERGY
(Canada)
10 TCA ENERGY (GTI) (75%) DOA
Largeau IV WD2-2008
SHT (25%) Production Sharing Contract GTI SA
Nigeria 11 UNITED HYDROCARBON (75%) UNITED HYDROCARBON (75%) UNITED HYDROCARBON (75%) UNITED HYDROCARBON (100%) DOC DOD
Lac Tchadwithout Sédigui Largeau III
SHT (25%) SHT (25%) SHT (25%)
Production Sharing Contract UNITED
HYDROCARBON INTERNATIONAL CORP.
(Canada)
12 VIKING EXPLORATION (100%) DOC
DOD Erdis Siltou I Siltou II
Production Sharing Contract 7
13 OIL TREK (100%) DOC
DOD
Production Sharing Contract 8
Carriage of hydrocarbons (pipeline)
1 TOTCO
2 COTCO
DOWNSTREAM ( OIL REFINERY)
1 CNPCIC (60%) Rônier and Mimosa SHT (40%) July 2011 CNPC (China)
Source: ETIE-Chad, 2012 Report, Fair Links. Update for the years 2013 and 2014.
7
Contract cancelled in March (ETIE-Chad, 2012 Report, Fair Links.)
10
Methodology and data
The evaluation of tax design for natural resources has been the subject of an abundant literature both theoretically and empirically. Smith (2012) provides a broad review of work highlighting the wide variety of methods and models. Blake and Roberts (2006), following Lund (1992), use the approach known as "contingent claim analysis"9 to compare 5 tax systems10. In a context of uncertainty about prices and using Monte Carlo simulation techniques, they classify these tax regimes according to the economic distortions they cause. Lund (1992), in an application to the Norway tax regime shows that the application of concession contracts lead to significant distortions for the Norwegian economy. Many authors use more empirical methods based on the development of scenarios. A basic scenario defines the volume of reserves, the scope and the investment period, the number of wells, the drilling rate success, the intensity of development, the initial production rate (or decline), the variable operating costs, etc. Based on assumptions about oil prices and the main taxes, it is then possible to calculate the cash flow and the Government Take over the project lifetime, for different scenarios.
The Peaceman model (1977) is based on the simulation of the crude extraction rate of gas and water from a reservoir. Reservoir characteristics are obtained by exploiting the geophysical modeling and three-dimensional geology to capture heterogeneous reservoir features. By simulating the physical and financial consequences of an alternative drilling program, this approach allows for optimization of the value of the resource. The investor's behavior can be studied after the introduction of a tax which would change the structure of net cash flows, regardless of the anticipated development plan of the field. Uhler (1979) built an integrated model of the exploration and extraction process which, when applied in its simplest form to a homogeneous reservoir leads directly to a model of exponential decline in which the rate of production of each field decreases in a constant rate each period. This approach also takes into account the pressure injection operations that can slow the rate of decline and increase the volume of recoverable reserves. Jacoby and Smith (1985), Helmioskoui and others
(1992), and Rao (2000) have refined the model by incorporating other variables such as the
heterogeneity of reservoirs and pressure.
There is a wide variety of papers on how taxation affects different aspects of the development of oil projects. These papers include a variety of methods to analyze the behavior of IOCs. Like Poterba
(2010), Smith (201211) considered the ideal approach would be to model a comprehensive tax system
9This approach allows consideration of the cash flows as a nonlinear function of the value of the underlying
asset.
10 These regimes include those of the Province of Alberta in Canada which consists of a Corporate Income Tax
and a Royalty; the pre-2003 regime of Papua New Guinea (PNG) based on the traditional Rate of Return (RR); the joint project of Sao Tome and Principe & Nigeria based on a PSC (SNDJZ); the Tanzanian hybrid system based on RR /PSC; and the PSC regime of Trinidad and Tobago.
11
based on a robust production model of an extractive industry. Smith (2012) proposes a modeling technique which specifically permits the analysis of how IOCs would adjust the intensity of exploratory activities, the timing and intensity of the initial development of the fields, the timing and intensity of enhanced recovery, and the eventual abandonment of fields in unfavorable conditions due to lower prices. This is a simple exploration and development model for studying the performance of an alternative tax system, and to identify potential distortions. The performance of a natural resource tax system depends on (i) its ability to increase government revenues; (ii) potential distortions that reduce the value of the after tax cash flows; (iii) the allocation of risk between the Government and the IOC.
To compare the two different agreements in Chad, we use a cash-flow model applied to real data from the Doba project, covering its technical features and cost structure. The analysis focuses on the Government Take, the progressivity in taxation, and the Internal Rate of Return (IRR) for the private operators of the two oil agreements, after making a series of assumptions about changes in oil prices and the rate of extraction (Monte Carlo simulations).
Production Profile
During the initial extraction, the extraction rate is determined by natural forces in the reservoir (pressure, permeability of reservoir rocks, viscosity of crude trapped, etc.) (Smith, 2012). Production (Qt) then decreases from the initial production level (Q0) at a fixed rate (a) during that initial
production phase:
𝑄
𝑡= 𝑄
0𝑒
−𝑎𝑡𝑡 ≥ 0 (1)
The production falls due to the drop in pressure in the reservoir as the volume of crude decreases (Uhler, 1979). The depletion rate, and therefore the rate of decline, is determined by the intensity of the operator's development effort (number of wells drilled in the reservoir, drilling platforms, and water injectors).
The volume of primary reserves (R) is given by the following formula:
𝑅 = ∫ 𝑄
0∞ 𝑡𝑑𝑡 =
𝑄𝑎0(2)
According to the equation (2), 𝑄0= 𝑎 × 𝑅 .The rate of decline (a) and the extraction rate are identical. It follows from this equation that the volume of the remaining reserves in the reservoir (Rt) at time t is
given by:
𝑅
𝑡=
𝑄𝑎𝑡= 𝑅𝑒
−𝑎𝑡(3)
The first year of production is given by the formula:
12
q1
=a×R, (4)
and production for the following years by the formula:
qt+1= (1-a)×qt. (5)
The cash-flow model
The Net Present Value (NPV) of the project before government tax can be calculated from the following formula:
NPV = ∑
𝑍𝑡−𝐶𝑡−𝐾𝑡(1+𝑖∗)𝑛
𝑇
𝑡=0
(6)
𝑍𝑡 is the expected turnover from the sale of crude oil, Ct the unit operational cost expressed in $/b, Kt
the capital cost for the initial development of operations and the maintenance of production.
The internal rate of return (IRR) is used to assess the profitability of the project. The OIC compares it to the minimum threshold expected to develop the business (Macey 1998). In this sector, OICs develop the fields only if feasibility studies show an IRR greater than or equal to 100% at the latest during the seventh year of production. That is explained by the fact this big return on investment is needed to minimize project risks. It is therefore a decision tool for investment. The before tax IRR of a project is obtained from the following equation:
NPV = 0 = ∑
𝑍𝑡−𝐶𝑡−𝐾𝑡(1+𝑖)𝑛
𝑇
𝑡=0
(7)
It corresponds to the yield or compound interest rate that cancels the NPV.
To estimate the tax rent generated during all the life of a project, we used the Average Effective Tax Rate (AETR) which is the ratio of the sum of all the parts of the rent collected under the various provisions of taxation and the before NPV of the project. It is given by:
𝐴𝐸𝑇𝑅 =
∑𝑇𝑡=0𝐹𝑡∑𝑇𝑡=0𝑍𝑡−𝐶𝑡−𝐾𝑡 (8)
Ft represents the sum of government tax levies.
Oil price projection and Monte Carlo simulation
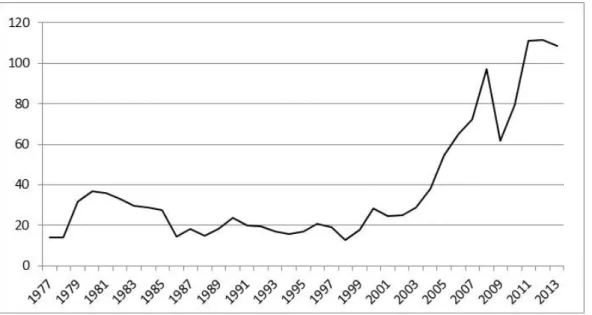
The forecasting of future crude prices is an important step in the evaluation of oil tax regimes in a context of uncertainty. The high volatility of crude prices does not permit to detect a long-term relationship describing the evolution of the price.
That why in this paper, the Brent oil price which constitutes the reference for the Doba oil project is forecasted on the basis of a Geometric Brownian Model (GBM). Lund (1992), and Blake and Roberts
13
the Auto Regressive models (AR). Our model is derived from the model developed by Hull (2000) whose functional form is:
𝑃(𝑇) = 𝑃(0)exp{[𝑟 − 𝛼 − (
µ22)] 𝑇 + µ𝛽√𝑇}(9)
Where T represents time at the end of each tax cycle, P (T) and P (0) the price of Brent at the period T and 0,
𝛼 the net marginal convenience yield from storage (convenience yield less marginal storage
costs), and r the nominal risk free interest rate.The standard deviation (µ) and the average annual price of Brent (β) over the 1977 to 2013 period are 29.9% and $ 39.75 per barrel respectively. The nominal rate of interest without risk is approximated as in Blake and Roberts (2006) by the rate of return of United States bonds for the 30 years corresponding to the life of the project. The data used to generate the price projections are shown in the table below.
Table 4: Parameters used in GBM model
Parameters Values µ 29.9% β
$ 39.75
P(0) 50 α 4% r 4.75%Given the extreme volatility of crude oil prices, including the sudden climb from 2005 when prices rose from $ 54 to more than $ 111 per barrel in 2012, our simulations are based on 5 price scenarios with 10,000 simulations per scenario. This Monte Carlo approach takes into account the uncertainty of the variables that influence the project profitability by using probability distributions.
Chart 1: Changes in Brent oil price ($/barrel)
14
Data and sources
Our model uses economic data for the main field in the Doba basin, called Komé, whose proven reserves were estimated at 588 million barrels. This basin has 6 other fields, the most important in terms of reserves are Miandoum and Bolobo, with respectively 227 and 135 million barrels of oil. The 588 million barrels of the principal field, Komé, are spread over two reservoirs, one with 560 million barrels in the geological layer of the Upper Cretaceous, and one with 28 million barrels in the Lower Cretaceous. The recovery factor was set at a maximum of 40%. Estimates of operating costs are based on data observed in the Doba project. The main features of this field and the model are detailed in Box 1.
15
Box 1: Basic parameters of the oil fields and tax systems used in the model Proven reserves (Millions (Millions of Barrels) : 588
Rate of extraction (%) : 7.2
Development investment level of the field (USD MM) : 942.4212 Exploratory cost ($ MM) : 435.5
Unit Operating Cost per barrel, OPEX ($/b) : 5 13 Unit Capital Cost, CAPEX ($/b) : 1114
Discount rate r (%) : 8
Base case Brent price per barrel ($) : 50 Discount of Doba crude oil (%) : 10 Transportation Cost per barrel ($/b) : 10
Two kinds of tax regimes are analyzed in the model :
The PSC applied in the Doba Project includes the following tax terms : Production Royalty (RP) with a rate of 12.5%
Corporate Tax (CT) with a rate between 40 and 65% and according to the Brent oil price.
The Production Sharing Contract is based on the agreement concluded in 2011 for the exploitation of Badilla and Mangara fields located in the Dosseo basin. It involves the following tax terms :
Cost Oil must not exceed 70%
Profit Oil is shared between the OIC and the government through the national oil company SHT. The share is done according to a share rate depending on the R factor. The sharing of Profit Oil between the two partners is done as follows:
o If R< 2.25 then the government share of Profit Oil is 40% o If 2.25<R< then the government share of Profit Oil is 50% o IF R>3 then the government share of the Profit Oil is 60% Public participation in the capital of the consortium is 25%
We ignored the signature bonuses, statistical royalty and surface fees, taxes on wages, and license fees for which revenues can be considered as negligible.
Results and analysis
The sharing of oil revenues can only be considered if the tax system has enough incentive for investors to engage in the search for oil fields and in their operation. The tax system of the various contracts is evaluated in three dimensions: the share of oil revenues collected by the government, the government revenue, and the incentive nature of the tax system through the rate of IRR for the investor and the progressivity in taxation.
12 It corresponds to the total development expenditure weighted by the size of the project field reserves. The
same treatment is used for exploratory investments.
13 The unit operating cost is an average unit cost over the period 2003-2008. 14
This is an average over the period 2003-2008. It is relatively high according to the consortium, due to an increased presence of water in reservoirs requiring the drilling of new wells to maintain the production level.
16
The analysis of the results initially covers the basic scenario in which a Brent price of 50 USD per barrel is used, followed by a sensitivity analysis with three other price scenarios. Based on 10,000 simulations, the average NPV of the project is USD 5.9 billion, and the average IRR before tax is 105.5% for the base case.
Analysis of tax regimes under the base case scenario
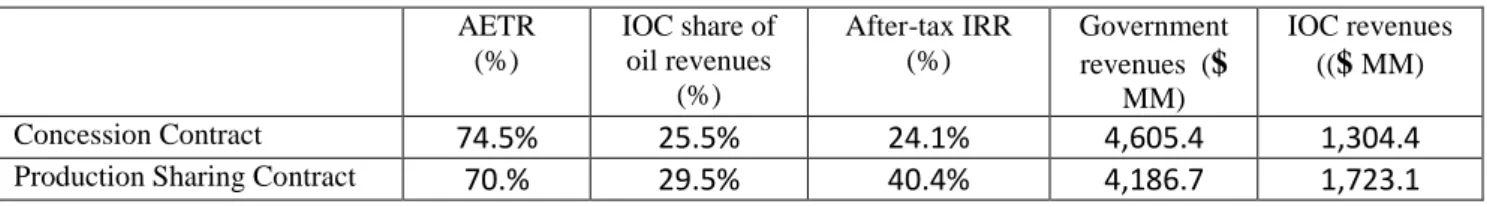
The Average Effective Tax Rate (AETR), which represents the share of oil revenues collected by the government, is relatively higher for the CC (74.5%) than for the PSC (70.5%). The government revenues are lower under the PSC than the CC. The After-tax IRR is lower under the CC (24.1%) than the PSC (40.4%) (Table 5).
Table 5: Economic results in the base case AETR (%) IOC share of oil revenues (%) After-tax IRR (%) Government revenues ($ MM) IOC revenues (($ MM) Concession Contract 74.5% 25.5% 24.1% 4,605.4 1,304.4
Production Sharing Contract 70.% 29.5% 40.4% 4,186.7 1,723.1
Analysis of other price scenarios
By taking into consideration various price scenarios, we can assess the progressivity of the two tax systems. The AETR of the CC decreases as the price rises. The AETR of the PSC rises as the price rises. When the oil price increases from $ 50 to $ 110, the AETR decreases from 74.5% to 66.9% with CC, whereas it rises from 70.5 to 74.7% with the PSC. The state’s revenues are greater for the PSC than the CC, except for low oil prices (Table 6).
Table 6: Economic performance under the other price scenarios
Price Scenario Oil price : $/b 110 Oil price : $/b 90 Oil price : $/b 70 Oil price : $/b 50
Before tax IRR (%) 525% 358% 220% 105%
NPV (Million USD) 22,868.0 17,215.3 11,547.6 5,909.8
AETR CC (%) 66.9% 67.7% 69.3% 74.5%
Share of the IOCCC (%) 33% 32% 31% 25%
After tax IRR (%) 159% 107% 63% 24%
Government revenues CC (Million USD) 15,497.5 11,860.6 8,215.8 4,605.4 IOC revenues CC (Million USD) 7,370.4 5,354.7 3,331.8 1,304.4
AETRCPP (%) 74.7% 74.5% 73.9% 70.5%
IOC share of the PSC (%) 25% 25% 26% 29%
Before tax IRR (%) PSC (%) 168% 129% 88% 40%
Government revenues PSC (Million USD) 17,032.0 12,769.3 8,451.3 4,186.7 IOC revenues PSC (Million USD) 5,836.0 4,445.9 3,096.3 1,723.1
17
The tax system based on the CC is regressive while that based on the PSC is progressive (Chart 3). The AETR of the CC curve clearly decreases whereas that for CPP increases slightly before stabilizing.
Chart 2 : Evolution of the progressivity of the two tax regimes
The After-tax IRR of the PSC is always higher than that of the CC, although the two curves converge at high oil prices (Chart 4). The two contracts are equivalent for the investor at high prices but diverge significantly at low prices.
100 simulations at each dollar level of price between $ 57 and $ 61 per barrel were conducted to determine the price at which government revenues and the AETR of the PSC become higher than those of the CC. For this price level, government revenues are around 5.8 billion of $ for an after-tax IRR of 36.4%.
Table 7: Approximation of barrel price at which the METR (CPP) becomes higher than the METR (CC) Crude oil price ($/b) AETR CC (%) AETR CPP (%) Gap between CC and CPP (%)
56 72.2% 70.9% +1.32% 57 71.7% 71.6% +0.14% 58 71.4% 71.8% -0.37% 59 71.1% 72.1% -1.00% 60 70.9% 72.3% -1.47% 61 70.6% 72.6% -1.99% 62 70.5% 72.9% -2.39%
18
Chart 3: Evolution of the after tax project profitability
The gap between the before, and after IRR increases sharply when the Brent price increases. In absolute terms, the government revenue increases sharply with the increase in the price of Brent, but in a smaller proportion with the PSC than with the CC.
19
Conclusions
There is no real "standard” CC and PSC. Each country defines the tools and methods of taxation it intends to apply through these contracts. The instruments and modalities of the contracts determine the properties of the tax system. In general, taxation instruments accompanying concession contracts introduce significant distortions in activity, particularly due to the effect of royalties as a taxation instrument, because royalties tax production activity irrespective of the profitability of the project. So CC taxation is often regressive. The "pure" PSC is normally progressive because oil revenues are mainly based on profits tax, often with a rate which varies depending on the profitability of the project.
Chad has the specificity of having introduced into its legislation the PSC while maintaining royalties. Although deductible on profit, this royalty is contrary to the expected progressivity of a tax system based on a PSC. Despite this feature, the application of Chad oil code 2007 allows the government to capture a larger share of oil revenues, compared to the 1988 agreement, but also a gradually increasing share as the profitability of the oil field improves. This feature is particularly interesting in the current context of falling crude oil prices, because it balances risks between State and Consortium, and maintains a favorable tax regime for exploration and exploitation by IOCs. As a result, the Chadian government should reactivate a counter-cyclical policy of oil revenue reserves when the crude oil price increases again.
20
References
Blake Andon J. and Roberts Mark C., 2006, “Comparing petroleum fiscal regimes under oil uncertainty,” Resources policy, Volume 31, pp.95-105.
Baker, M.., Roberts Scott, and Parson, J., 1998, "Alternative Models of Uncertainty Commodity Prices for Use with Modern Asset Pricing Methods ", The Energy Journal, 19(1), 115-148.
Bradley, P., 1998, “On the use of MAP for comparing alternative royalty systems for petroleum development projects”, The Energy Journal, 19(1), pp. 47-82.
Chad Export Project, 2012, “Year End Report,” Update report No. 33, 23 p.
Chad export Project, 1999, “Reservoir management,” Project description Supporting documents, volume 1, Chapter, 8 p.
Chad export Project, 1999, “Project overview,” Project description Supporting documents, volume 1, Chapter 1, 5p.
Fair Links, 2012, “Rapport ITIE Tchad,” 93 p.
Ian Gary and Nikki Reisch, 2004, “Le pétrole tchadien : miracle ou mirage? Suivre l’argent au dernier-né des pétro-États d’Afrique, ” Catholic Relief Services et Bank Information Center, 2004), p. 124. Helmioskoui, B., R. Narayanan, T. Glover, and K. S. Lyon, 1992, “Optimal Extraction of Petroleum Resources: An Empirical Approach,” Resources and Energy, 14, pp. 267–85.
Hull, J.C., 2000, “Options, Futures and Other Derivative Securities,” fourth ed. Prentice Hall, New Jersey.
International Monetary Fund, 2014, “Chad: Request for a Three-Year Arrangement Under the Extended Credit Facility-Staff,” Report; Press Release; and Statement by the Executive Director for Chad,Country Report No. 14/282 , 94 p, also available at
http://www.imf.org/external/pubs/ft/scr/2014/cr14282.pdf
International Monetary Fund, 2013, “Chad: Staff-Monitored Program,” Country Report No. 13/284, also available, 45 p, at http://www.imf.org/external/pubs/ft/scr/2013/cr13284.pdf
International Monetary Fund, 2012, “Régimes fiscaux des industries extractives: conception et application”, Département des finances publiques, 91 p.
Jacoby, H. D., and J. L. Smith, 1985, “The Effects of Taxes and Price Regulation on Offshore Gas,” Energy Journal, Special Tax Issue.
Johnston, D., 2003, “International Exploration Economics, Risk, and Contract Analysis, Pennwell, Tulsa.
Kemp, A. G., 1987, “Petroleum Rent Collection around the World,” South Halifax: Institute for Research on Public Policy.
Laughton, D. G., 1998, “The Potential for Use of Modern Asset Pricing Methods for Upstream Petroleum Project Evaluation: Introduction. The Energy Journal, 19(1), pp.149-153.
21
Leenhardt Blaise, 2005, “Fiscalité pétrolière au sud du Sahara : la répartition des rentes ", Afrique contemporaine, 2005/4 no 216, pp.65-86.
Lund Diderik, 1992, “Petroleum taxation under uncertainty: contingent claims analysis with an application to Norway,” Journal of Economics Energy, Volume 14, Issue 1, pp.23–31.
Margonelli Lisa, 2008, “Oil on the brain, Petroleum's Long, Strange Trip to Your Tank,” Broadway Book, Reprint Edition, 352 p.
Otto, James, John Cordes , Maria L. Batarseh. 2000, “Global Mining Taxation Comparative Study,”2nd ed. 92, Golden CO: Colorado School of Mines.
Peaceman, D. W., 1977, “Fundamentals of Numerical Reservoir Simulation,” Developments in Petroleum Science, 6, Elsevier Scientific Publishing Company, 173 p.
Petermann A., Ignacio G.J. and Tilton J. 2007, “Mining and corruption”, Resources policy, vol.32 issue 3, pp. 91-103.
Poterba, J., 2010, “The Challenge of Tax Reform and Expanding the Tax Base,” Economic and Social Review, 41:2, pp. 133–48.
Rao, R. D., 2000, “An Integrated Modeling Framework for Exploration and Extraction of Petroleum Resources,” Resources Policy, 26:3, pp. 133–43.
Schiozer, R. F., and S. B. Suslick, 2003, “An Evaluation of a Royalty Relief Model for Mature Fields,” AAPG International Conference, Barcelona, available online at:
http://www.searchanddiscovery.com/abstracts/pdf/2003/intl/extend/ndx_81913.pdf.
Smith, James L., 2013, “Issues in extractive resource taxation: A review of research methods and models” Resources Policy, 38, pp. 320-331.
Smith, James L., 2012, “Modeling the Impact of Petroleum Exploration and Development,” IMF WP/12/278 November.
Tordo, S., 2007, “Fiscal Systems for Hydrocarbons: Design Issues,” World Bank Working Paper No. 123 (Washington: World Bank).
Van Meurs, P., 1988, “Financial and Fiscal Arrangements for Petroleum Development: An Economic Analysis,” in Petroleum Investment Policies in Developing Countries, by T.W. Wälde, and N. Beredjick (eds.), (London: Graham and Trotman).
Uhler, R. S., 1979, “The Rate of Petroleum Exploration and Extraction,” Advances in the Economics of Energy and Resources, Vol. 2, R. S. Pindyck (ed.), pp. 93–118, (Greenwich: JAI Press, Inc.).
i
Appendix 1: Mathematical formulae of the tax provisions used in the model
OPEXt=oQt CAPEXt=cQt PBt=(1-D)Pt Concession Contract 1. BTCF𝑡= 𝑃𝐵𝑡𝑄𝑡 − 𝐶𝐴𝑃𝐸𝑋𝑡− 𝑂𝑃𝐸𝑋𝑡− 𝑇𝐴𝑋𝑡 Where 2. TAX𝑡= 𝑅𝑃𝑡+ 𝐼𝑆𝑡 3. PR𝑡 = 𝑟1(𝑃𝐵𝑡𝑄𝑡 ) 4. CT𝑡 = 𝑟2(𝑃𝐵𝑡𝑄𝑡 − PR𝑡 − 𝐶𝐴𝑃𝐸𝑋𝑡− 𝑂𝑃𝐸𝑋𝑡− 𝐷𝐴𝑀𝑡)
Production Sharing Contract
5. PR𝑡 = 𝑟3(𝑃𝐵𝑡𝑄𝑡 )
6. CS𝑡 = 70%(𝑃𝐵𝑡𝑄𝑡 − PR𝑡)
7. CO𝑡= 𝐶𝐴𝑃𝐸𝑋𝑡+ 𝑂𝑃𝐸𝑋𝑡 𝑖𝑓 CO𝑡 < CS𝑡 ;
Otherwise 70%(𝑃𝐵𝑡𝑄𝑡 − PR𝑡) for the first period
8. CO𝑡= 𝐶𝐴𝑃𝐸𝑋𝑡+ 𝑂𝑃𝐸𝑋𝑡+ (CO𝑡−1− CS𝑡−1) 𝑖𝑓 CO𝑡< CS𝑡 ;
Otherwise 70% (𝑃𝐵𝑡𝑄𝑡 − PR𝑡) for the other periods
9. R =∑ 𝐶𝐴𝑃𝐸𝑋𝑡+ 𝑂𝑃𝐸𝑋𝑡+ 𝑃𝐵𝑡𝑄𝑡 𝑛 𝑡=0 ∑𝑛 𝐶𝐴𝑃𝐸𝑋𝑡 𝑡=0 10. If ( 𝑅 < 2.25 0 ⇒ 𝑟4= 40% 2.25 < 𝑅 < 3 0 ⇒ 𝑟4= 50% 𝑅 > 3 0 ⇒ 𝑟4= 60% ) 0 11. PO𝑡 = 𝐶𝐴𝑡 − RP𝑡− CO𝑡
ii 12. POE𝑡 = 𝑟4 PO𝑡
13. PE𝑡= 𝑟5(PO𝑡0− POE𝑡)
14. POC𝑡 = PO𝑡− POE𝑡− PE𝑡
Appendix 2: Glossary of terms used in the equations
o : The unit operating per barrel c : The unit capital cost per barrel D : Discount of Doba crude oil
r1 : Production royalty in the CC (12.5%). r2 : Corporate Tax (CT) rate at period t ( 60%).
r3 : Production royalty in the 2014 CC and PSC (14.25%). r4 : The profit oil sharing rate based on the R factor at period t. r5 : The State's participation rate in the consortium set at 25%.
Pt : Brent annual average price which is the reference for oil from the Doba fields
BFCFt : Before-tax Cash-Flows at period t
Tt : Turnover in period t which corresponds to the annual oil production (Qt) multiplied by the oil
price of Doba Blend (PBt).
CAPEXt : Total of Capital Cost paid in period t.
OPEXt : Total of Operating Cost paid in period t.
RPt : Production Royalty paid in period t.
DAMt : Depreciation in period t. CTt : Corporate Tax paid in period t. TAXt : total of taxes paid in period t. COt : Cost Oil paid in period t. CSt : Cost Stop paid in period t. POt : Profit Oil realized in period t. POEt : State share of Profit Oil in period t. POCt : IOC share of Profit Oil in period t.
PEt : Dividends from the share capital of the state in the consortium in period t. Rt : R factor in period t.
iii
Appendix 3: Comparisons between the tax provisions of CC and PSC
Nature of contract Concession Contract Production Sharing Contract Laws Ordinance No. 07/PC/TP/MH of 3
February 1962
Law No. 006 /PR / of 2 May 2007 Decree No. 796/PR/PM/MPE/2010 Ordinance No. 001/PR/2010
Production royalty Fixed rate of 12.5% Variable rate between 14.25% and 16.5% Corporate tax Range between 40 and 65% and
according to two parameters:
The price of benchmark Brent The R Factor rate
Range between 40% and 60% and according to the R factor
Surface area (??)Tax 100$/km2 200$/km2
State participation No state participation State participation up to 25% Exemptions Value Added Tax (VAT)
Duties and taxes on petroleum products
Vehicle taxes
Levies on dividends and technical assistance
Total exemption for all imports of the Project.
Idem
Others fiscal terms Presence of the Stability Agreement clause
Stop Cost cannot exceed 70%
Appendix 4: Fiscal positions for the 7 fields in the Doba Basin
1998 Agreement 2004 Agreement
Field Komé, Miandoum,
Bolobo
Nya and Moundouli
Maikeri and Timbré
Production royalty 12.50% 14.25%
Statistic Royalty 1.0% 1.5%
Corporate Tax 40%-65% 50% 50%-65%
iv
Appendix 5: Production profile of the three original fields
Source : Chad export Project, 1999, Chapter 2.0 reservoir management, «Project description Supporting document.
v Appendix 6: Statistical Simulations
Oil price of 110 $/b Before Tax IRR (%) Before Tax NPV ($ MM) AETR CC IOC share of rent CC (%) Before tax IRR CC Government revenues CC ($ MM) IOC revenues CC ($ MM) AETR PSC Consortium sharing PSC (%)
After tax IRR PSC Government revenues PSC ($ MM) IOC revenues PSC ($ MM) Average 525.3% 22,868.0 66.9% 33.1% 159.5% 15,497.5 7,370.4 74.7% 25.3% 167.7% 17,032.0 5,836.0 Standard deviation 78.7% 1,611.5 0.1% 0.1% 21.3% 1,047.4 564.5 0.1% 0.1% 15.4% 1,206.9 408.4 CV15 15.0% 0.1 0.2% 0.4% 13.4% 0.1 0.1 0.2% 0.5% 9.2% 0.1 0.1 Maximum 740.8% 29,295.1 67.6% 33.5% 226.0% 19,675.7 9,619.4 75.0% 25.9% 218.2% 21,797.5 7,497.6 Minimum 363.4% 17,525.9 66.5% 32.4% 109.9% 12,034.3 5,491.7 74.1% 25.0% 131.5% 12,919.3 4,542.8 Oil price of 90 $ /b Before Tax IRR (%) Before Tax NPV ($ MM) AETR CC IOC share of rent CC (%) Before tax IRR CC Government revenues CC ($ MM) IOC revenues CC ($ MM) AETR PSC Consortium sharing PSC (%)
After tax IRR PSC Government revenues PSC ($ MM) IOC revenues PSC ($ MM) Average 357.5% 17,215.3 67.7% 32.3% 107.1% 11,860.6 5,354.7 74.5% 25.5% 128.9% 12,769.3 4,445.9 Standard deviation 53.4% 1,300.2 0.2% 0.2% 14.5% 844.8 455.7 0.3% 0.3% 13.1% 985.4 323.8 CV 14.9% 0.1 0.3% 0.6% 13.5% 0.1 0.1 0.3% 1.0% 10.2% 0.1 0.1 Maximum 499.2% 22,189.5 68.7% 32.9% 151.2% 15,097.6 7,091.8 75.2% 26.3% 164.8% 16,593.4 5,596.1 Minimum 242.1% 12,650.8 67.1% 31.3% 70.9% 8,896.4 3,754.4 73.7% 24.8% 95.5% 9,304.0 3,346.8 15
vi Oil price of 70 $ /b Before Tax IRR (%) Before Tax NPV ($ MM) AETR CC IOC share of rent CC (%)
Before tax IRR CC Government revenues CC ($ MM) IOC revenues CC ($ MM) AETR PSC Consortium sharing PSC (%)
After tax IRR PSC Government revenues PSC ($ MM) IOC revenues PSC ($ MM) Average 220.0% 11,547.6 69.3% 30.7% 62.5% 8,215.8 3,331.8 73.9% 26.1% 87.7% 8,451.3 3,096.3 Standard deviation 34.4% 1,025.7 0.4% 0.4% 9.2% 666.5 359.4 0.5% 0.5% 11.4% 798.9 235.3 CV 15.6% 0.1 0.6% 1.3% 14.7% 0.1 0.1 0.7% 1.9% 13.0% 0.1 0.1 Maximum 313.3% 15,615.8 71.3% 31.8% 92.7% 10,875.1 4,740.7 75.8% 29.6% 118.5% 11,618.7 4 080,4 Minimum 141.4% 7,821.0 68.2% 28.7% 38.3% 5,785.1 2,035.9 70.4% 24.2% 58.0% 5,471.9 2,349.1 Oil price of 50 $ /b Before Tax IRR (%) Before Tax NPV ($ MM) AETR CC IOC share of rent CC (%) Before tax IRR CC Government revenues CC ($ MM) IOC revenues CC ($ MM) AETR PSC Consortium sharing PSC (%)
After tax IRR PSC Government revenues PSC ($ MM) IOC revenues PSC ($ MM) Average 105.5% 5,909.8 74.5% 25.5% 24.1% 4,605.4 1,304.4 70.5% 29.5% 40.4% 4,186.7 1,723.1 Standard deviation 19,2% 728,7 1,4% 1,4% 5,2% 472,8 256,4 1,0% 1,0% 8,6% 506,3 225,4 CV 18.2% 0.1 1.8% 5.4% 21.6% 0.1 0.2 1.4% 3.4% 21.2% 0.1 0.1 Maximum 164.1% 8,584.0 84.2% 28.7% 45.4% 6,338.2 2,246.0 77.6% 32.2% 68.7% 6,183.0 2,446.8 Minimum 58.5% 3,178.0 71.3% 15.8% 6.9% 2,856.6 321.3 67.8% 22.4% 16.7% 2,483.4 694.6