1
“Optimization-based Evaluation of USAID/OFDA’s
Global Logistics Capacity”
Final Report
Dr. Alexander Rothkopf, Chelsey Graham, & Dr. Jarrod Goentzel September, 30, 2020
2
Management Summary
This final report summarizes the research methods and results in the project “Optimization-based Evaluation of USAID/OFDA Global Logistics Capacity”. This research was a part of the MIT Comprehensive Initiative on Technology Evaluation (CITE).
Throughout the period of performance from May 2019 to September 2020 a research team from the Massachusetts Institute of Technology’s Humanitarian Supply Chain Lab worked with the Office of Foreign Disaster Response, which was merged with USAID’s Food for Peace into the new Bureau of Humanitarian Assistance (BHA), to research a model, methods, inputs, and outputs to support inventory decision-making for disaster response operations. In Phase I of the project the team worked to understand BHAs operational processes during disaster responds and collected data and information to characterize the operations. Key results are summarized in a report for Phase I and an accompanying presentation. Phase I revealed the complexities of planning disaster response operations at BHA. The team settled on researching model support for two key operational decisions: (1) How much inventory should BHA hold in each of the four global warehouses for disaster response, and (2) How much inventory in total should BHA carry in their system? The team also aimed to support decision-making through metrics that shed light into system performance and provide easy access and comparability among options.
The team developed a stochastic linear program, relying on various data sets required for inputs, and created multiple methods to merge and extract important information relevant for modelling. The team created a model that supports strategic inventory decision-making in multiple ways. Results show that BHA can rely on the model to answer the strategic inventory allocation decisions raised above and use six key metrics to compare preparedness options: (i) Inventory balance metric, (ii) average time, (iii) average cost, (iv) % TAP served, (v) % fully served, and (vi) the inventory allocation metric.
Over the course of the project BHA became convinced that the model can support critical decision-making. The team outlined a path towards implementing a decision-support tool and identified how a systematic decision-making process is a key prerequisite for effective implementation. Inspired by the sales & operations planning process (S&OP) used widely in the private sector, the team researched and developed a concept note for S&OP process for BHA’s disaster-response-planning activities. It highlights how such planning processes, especially in conjunction with a well-defined supply chain strategy, provide the framework for developing robust decision-support tools in the future.
The work also revealed multiple interesting insights into operational strategies. For example, the research team was able to show that the number of people BHA typically seeks to serve relative to the total inventory in the system effects the level of inventory consolidation that is optimal in the network. This also underlined the importance of the disaster portfolio approach and the need for an appropriate estimation of the sets of disasters in this portfolio. The research team outlined an approach for using predictive analytics to determine a forward-looking disaster portfolio.
This final report is accompanied by a set of documents that provide further details on model, methods, data, and results: (i) Phase I results presentation, (ii) Phase II results presentation, and a (iii) BHA S&OP document.
3
Introduction
The United States Agency for International Development’s (USAID’s) Bureau for Humanitarian Assistance1 (BHA) collaborated with the Massachusetts Institute of Technology’s Humanitarian Supply Chain Lab (HSCL) at the Center for Transportation and Logistics (CTL) in the project “Optimization-based Evaluation of BHA’s Global Logistics Capacity”. This collaboration intends to provide data-driven, model-based recommendations to optimize BHA’s global response capabilities.
The project ran from May 2019 until September 2020 and comprises two phases. In Phase I the project team conducted preliminary analyses to develop a deeper understanding of BHA’s operations and collected necessary information for modelling purposes. This phase also comprised of a preliminary model which was used to showcase outputs and recommendations of a more tailored modeling approach. In Phase II the project team developed a tailored optimization model that included specific operational conditions for BHA’s disaster response supply chain and conducted analyses to develop recommendations on where to locate inventory in the existing network.
In an effort to determine effective implementation of the model for BHA, the team determined that a process structure that promotes coordinated, cross-functional planning should be developed. From this standpoint, sales and operations (S&OP) decision models were applied to identify a process that methodically incorporates the model outputs in a way that can improve BHA’s non-food item response network.
Problem Description
In May 2019, the HSCL was approached by BHA to support their efforts in designing a model that measures and improves BHA’s disaster response capacity. BHA was looking for a mathematical modelling approach that could provide decision making support. The team decided on a two-phased approach. Phase I was dedicated to understanding BHA’s disaster response operations and the available data that could support a modelling approach. Phase II was intended to develop and test a model tailored to the operational structure at BHA.
In Phase I the project team collected information on BHA’s operations from different internal and external sources to better understand the operations, to build a database of inputs for the model, and to determine
1 The project started with USAID’s Office of Foreign Disaster Response (OFDA) which was merged with Food for
4
additional information requirements. This was not a trivial exercise because BHA’s data collection efforts only started to be rigorous in the last decade (i.e. 50 disaster responses were recorded, and despite these efforts the data is still fragmented and incomplete). Nevertheless, the project team used the available information to develop insightful analyses. The accompanying presentation to this report presents the analyses and findings in detail.
The research team derived from the preliminary analysis in Phase I that BHA has two core questions to answer. On one hand, they have to identify how much inventory should be carried in the entire network. This is not a simple question because BHA does not know when the next disasters require assistance or how many people will be affected. In addition, BHA’s inventory levels need to be sufficient to serve multiple disasters because resupply lead times are longer than the typical time between disasters. Clearly, higher inventory levels increase BHA’s ability to respond to a disaster. However, BHA has to trade off the ability to respond to disasters with the requirements for working capital, storage costs, and space. HSCL had previously developed an insurance-driven modelling approach for other response agencies. The approach relies on the idea that a response agency maintains assets (such as inventory, warehouse space, modal mix) to insure against a disaster portfolio of unknown timing, location, size, and type. In an effort to provide answers specific to these core questions regarding BHA’s non-food item supply chain, the project team developed a model tailored to the operations of the organization. In particular, this model captures the fact that resupply lead times take longer than the inter-arrival times of different disasters. This is a key difference in BHA’s emergency response operations compared to other humanitarian organizations. In addition, the model allows for different modes of transportation and measures and balances the trade-off between the cost and response times. The model supplies recommendations on (i) how much inventory BHA should hold, and (ii) where in the current or an alternative network of warehouses the inventory should be located. To support strategic decision-making the project team developed metrics that characterize BHA’s responsiveness against a portfolio of disasters and allow for the comparison of strategic options. This modelling exercise was intended to research and test a methodology and an approach that could make its way into BHA’s decision-making processes in the future. Core results can also be found in the accompanying presentation in the Phase II section.
During Phase II, USAID realized their plans to merge Food for Peace and the Office of Foreign Disasters (OFDA) into the new Bureau of Humanitarian Aid (BHA). This was a catalyst for USAID’s interest to evaluate how the methodology that was developed and tested could augment the decision-making process. Due to the nature of the types of disasters that BHA has historically responded to, it is inherently difficult to
5
plan without knowing when or what the next disaster will be or how large of an impact it will have. As such, the project team developed a structured planning process based on for-profit sector Sales & Operations Planning methods, and showcased how the inventory allocation model can be embedded into an integral planning process. A detailed description of this process can be found in the accompanying S&OP document. To this end, our research also revealed how critical disaster prediction is as an input to the modeling. For the purpose of this research project, BHA’s historical response data – more specifically, the total affected population - was used to generate a wide range of disaster scenarios in an effort to simulate disasters that BHA might respond to. However, since historical response data was limited, HSCL began to explore options for developing a forward-looking, predictive disaster portfolio. This ongoing work may have applications that extend beyond supply chain planning and requires additional funding in order to test the methodology that has been developed and move to the proof of concept phase.
Modelling Approach
To answer the two main questions - how much inventory to hold and how to allocate the inventory - the research team opted for an approach that mixes prescriptive (optimization) and descriptive (simulation) models. The prescriptive portion of this model is as follows:
The model minimizes the time to respond to a portfolio of disaster scenarios subject to multiple constraints (Eq. 1). Equations (2) ensures that demand can only be filled from on-hand inventory. Equations (3) ensures that all disaster demand including a dummy node are filled. Last, Equations (4) ensures that transportation costs do not exceed a predetermined budget.
6
Many of the inputs to this model were acquired directly from BHA in a larger data inquiry and cleaning effort over Phase I and Phase II of this project, such as item categories, logistics specifications (volumes, weights), and inventory locations. A large amount of time was attributed to the collection and analysis of transportation information from BHA and third-party sources. Distances were acquired using Google’s distance API and fixed travelling speeds and costs were estimated for individual modes of transportation. To determine the disaster portfolio and include varying lead times, the research team opted for a simulation approach. The research team acquired individual disaster occurrences from BHA’s past response activities and organized this data sequentially by date of occurrence. The team also collected supply lead times across BHA’s suppliers and estimated a supply lead time distribution. By sampling random supply lead times, the team was able to create random sets of disasters. Each set of disasters within a random lead time constitutes a disaster scenario that BHA faces within the disaster portfolio. To determine the affected population in each individual disaster, the research team relied on a subset of disasters for which information on the served population was available. Using linear regression, we developed an estimator function to determine the typical share of people served by BHA given the disaster size. This was then used to scale the total affected population of all disasters in the portfolio to the people that BHA typically plans to serve.
The above approach allows BHA to determine where to best allocate inventory at each warehouse location for a given total inventory level in the network, and thereby answers one of the core research questions. In the results section we will outline how a simulation-based approach of varying inputs helps to answer the second research question, and how other various questions can be addressed using this modeling approach.
Model results
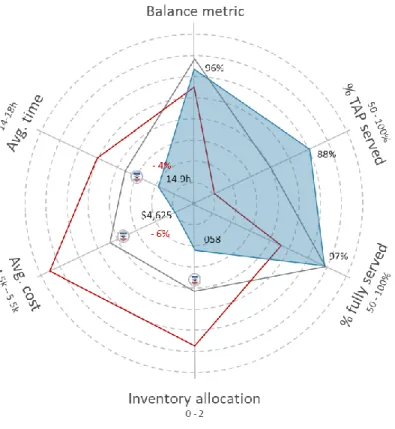
To answer the first research question, of “Where should BHA locate their inventory?”, the project team aimed to equip BHA with planning metrics that allow easy access to the benefits of inventory optimization. The project team developed and tested six key metrics:
1. Inventory balance metric – compares the total time to serve a given disaster portfolio with the optimal inventory allocation to the total time to serve a given disaster portfolio with BHA’s current inventory allocation (i.e. how “close” the current network is to the optimal network). 2. Average time – shows the average time to serve disasters with one unit of the commodity with
7
3. Average cost – shows the average cost to serve a disaster with one unit of the commodity with optimal inventory allocation. Units in USD.
4. % TAP served – indicates the percentage of the population in all disasters in the set served with the available inventory.
5. % fully served – indicates the percentage of disaster scenarios that can be fully served with the available inventory.
6. Inventory allocation metric – indicates how equally inventory is distributed across the entire network. A lower value represents a more evenly distributed network.
Figure 1: Illustrative optimization results for three risk portfolios variations and the corresponding metrics
The balance metric reveals the overall expected benefits from reallocating inventory from its current distribution to the optimum as recommend by the model. It thereby provides the ultimate measure of improvement. Values of the balance metric close to zero indicate substantial response time reductions through inventory reallocation. As such, one minus the balance metric shows the percentage reduction in response time from reallocation.
The average time and average cost metrics provide a better understanding of the time it takes to serve a disaster on average and the associated costs. The percentage of the population served metric shows how much of the population can be reached on average, and the percent of disaster scenarios fully served indicate if BHA is able to serve all needs on average within the disaster scenarios.
8
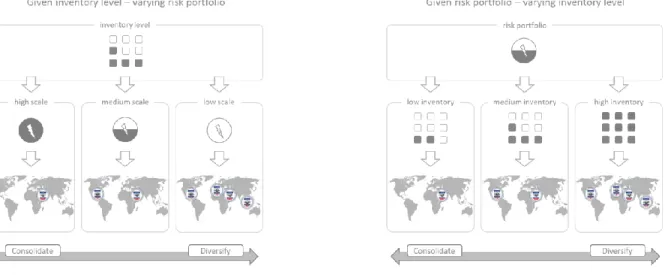
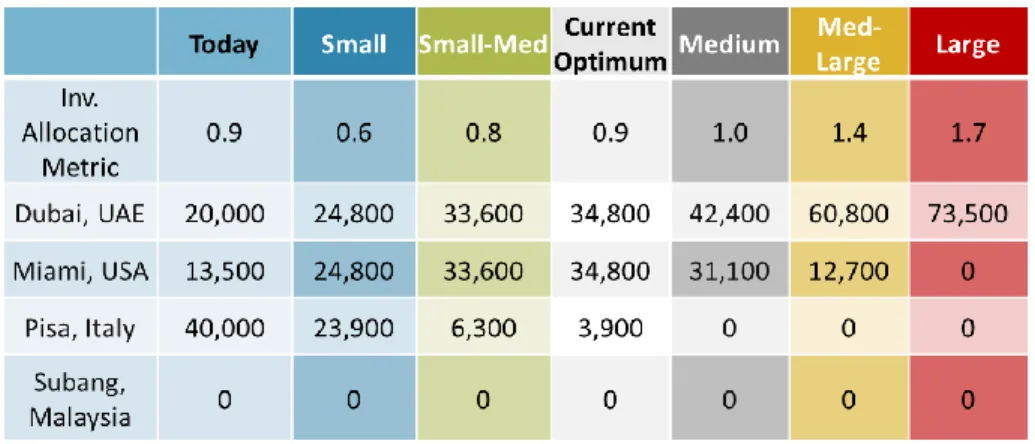
The analysis of all commodities revealed that the disaster portfolio plays an important role for BHA’s inventory allocation choice. If BHA aims to serve larger amounts of those impacted by the disasters (i.e. high scale disaster scenarios) with a given inventory, the model recommends to consolidate the inventory in locations that provide low response times to most areas. Whereas, if BHA serves a smaller portion of the total affected population then the model recommends to diversify the inventory across multiple available locations. This effect can be observed in Figure 1 in the inventory allocation metric. As the total affected population to be served increases (blue = low, grey = medium, red = high), the inventory allocation metric increases indicating that more inventory is consolidated in one location. As a result, it is important to correctly estimate the number of people BHA expects to serve. For the currently available inventory, the project team evaluated multiple disaster scale scenarios for each commodity to explain this effect and highlight the consequences to the network.
Figure 2: Inventory consolidation effects in varying disaster scales
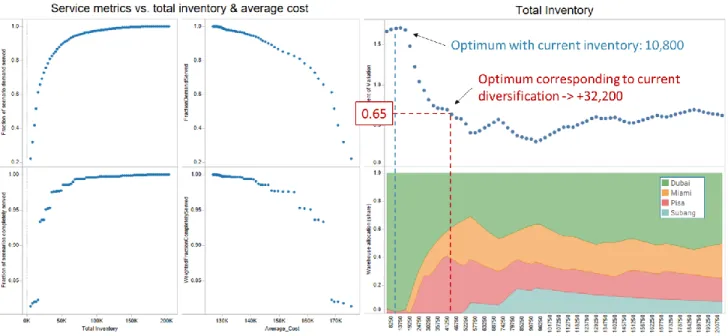
As an alternative to evaluating how many people BHA plans to serve, BHA can also consider to adjust the available inventory in the system. That is, for a given disaster scale portfolio, the organization may want to increase or decrease the total inventory in the system. This change in inventory will impact the diversification of inventory across different nodes and as a consequence impacts the responsiveness of the network. In the sample analysis shown in Figure 3, we show that increasing the total inventory in the system in the two right hand plots decreases the inventory allocation metric and allows the model to allocate inventory more evenly across the network.
9
Figure 3: Varying inventory and impact on inventory allocation metric (upper right); allocation share for different locations (lower right); and service metric impact (four figures on the left)
The research team also worked to better understand, how this model can serve beyond the inventory-level and -allocation scenario analyses present above. For example, the research team modified the model inputs to include alternative inventory locations in Sub-Saharan Africa to showcase how the model can inform the benefits of the joint utilization of inventory locations between the food-related supply chains (previously operated by Food for Peace) and the non-food supply chains previously operated by OFDA. In this analysis, we also explained how the model enables a decision-maker to evaluate a mix of different transportation capacities and how regional warehouses can benefit BHA’s response network. For example, the research team showed that the model can quantify the value of utilizing a warehouse located in Africa combined with trucking as a mode of transport, and its potential impact on the global footprint of warehouses.
Disaster Portfolio
Initially, the research team developed a methodology to create a backward-looking disaster portfolio (see above) which was built from historical disaster response data. To consider changes in BHA’s response activities, a forward-looking, predictive disaster portfolio would make the model and planning process (see below) more robust. In an effort to address this, the team began to develop a methodology for a forward-looking disaster portfolio that not only draws upon existing probabilistic data to determine potential hazards, but also quantifies the vulnerability of the people in the impacted region in order to predict the total affected population.
10
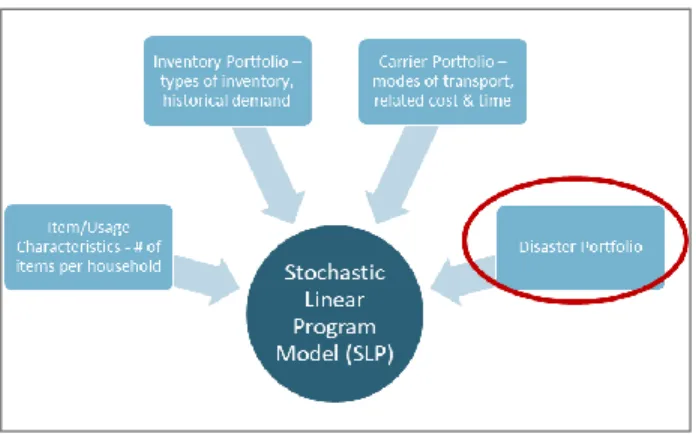
Figure 4: Inputs to existing SLP Model; red circle indicates forward-looking disaster portfolio
HSCL researched existing methodologies to assess potential natural hazards, regional exposure, and vulnerabilities in order to optimize the bureau’s global logistics capacity for non-food items. To improve the accuracy of the inventory optimization model, the team determined that more predictive inputs are needed. Current early warning platforms in combination with regression models2 have been used to determine rapid needs assessments, but this typically occurs in a shorter timeframe leading up to a disaster or immediately after it has occurred. While this type of information is useful post-disaster for needs assessments, it does not allow for long-term planning.
Figure 5: IPCC approach to quantifying and therefore reducing disaster risk
Three key inputs to measure risk are the probability of a disaster or hazard, exposure, and vulnerability. An example can be seen in Figure 2, which was included in the special report from Intergovernmental
11
Panel on Climate Change (IPCC), titled Managing the Risks of Extreme Events and Disasters to Advance Climate Change Adaptation3.
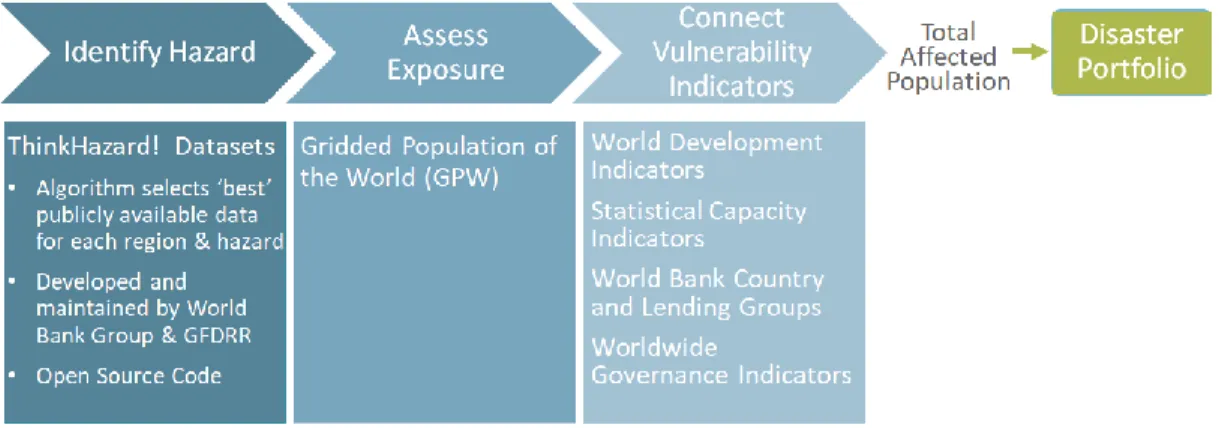
This figure illustrates disaster risk as the intersection of weather and climate events, exposure, and vulnerability. After reviewing such approaches to disaster risk modeling and existing datasets, the HSCL team developed an initial concept as depicted in Figure 6. The concept consists of first identifying a specific hazard dataset from the World Bank’s ThinkHazard! database4 – an online hazard platform that identifies global, regional, and local risk profiles by aggregating available models and accessible datasets – in combination with other weather-event related archives (e.g. Global Active Archive of Large Flood Events5), and then overlaying the gridded population of a region to understand the total number of people exposed to each hazard. This result, combined with mathematically determined vulnerability indicators based on country of hazard, would be used to calculate the total affected population in a wide range of scenarios culminating in a predictive portfolio of disasters. This model would make risk tangible by quantifying the number of affected people in a given region.
Figure 6: Proposed Approach
The next steps would involve choosing one disaster type (i.e. floods) and a region in an effort to develop, test, and train a model that could then be further developed to automate data pulls for many disaster types across the globe. In addition, applicability of vulnerability indices to other disaster-region combinations would need to be determined. The team would attempt to categorize the appropriate indicators by leading socio-economic factors (i.e. the World Bank Income groupings). This work would require additional resources, and thus, additional funding to proceed.
3IPCC, 2012 – Field, C.B., V. Barros, T.F. Stocker, D. Qin, D.J. Dokken, K.L. Ebi, M.D. Mastrandrea, K.J. Mach, G.-K. Plattner, S.K. Allen, M. Tignor, and P.M. Midgley (Eds.) Available from Cambridge University Press, The Edinburgh Building, Shaftesbury Road, Cambridge CB2 8RU ENGLAND, 582 pp. Available from June 2012.
4https://thinkhazard.org/en/
12
Planning Process
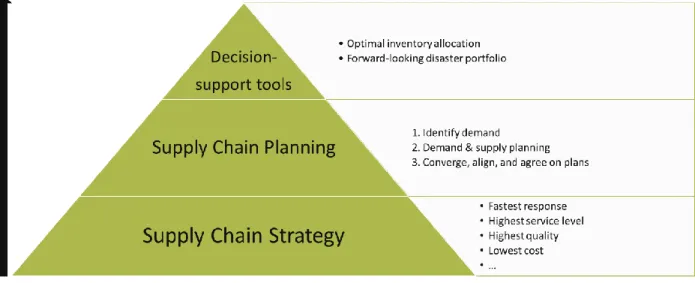
To make the model and methods developed throughout this project more effective, the research team recognized the need to embed them in a supply chain planning process at BHA. The figure below demonstrates an approach that would best capitalize on software tool development to ensure that the tools that are developed properly support the mission of the organization and build upon key performance indicators that guide the organization. With this in mind, the research team drew upon established sales and operations planning (S&OP) methods to outline BHA planning processes that leverage the model.
Figure 7: Prerequisite for turning research into action
Current BHA Disaster Response Process
Other than short-term efforts to do disaster response planning prior to an emergency (e.g. hurricanes in the Caribbean), BHA does not currently have a holistic planning process that takes place pre-disaster. This is in part due to the nature of the types of disasters that BHA typically responds to with non-food items, as well as the simple fact that predicting and planning for disasters yet to occur is difficult. Figure 8 below depicts the existing response process by which demand is determined and downstream inventory management processes take place within BHA for non-food items. Currently, needs are assessed for each invidual disaster in the field, the headquater (in Washington D.C.) and the field detrmine supply and lead times and the determine the inventory allocation and distribution methods.
Figure 8: BHA non-food disaster planning process
1. Needs Assessment DART (Field)
2. Determine supply and lead times Supply Chain (Field, D.C.)
3. Determine inventory allocation Supply Chain (Field, D.C.)
13
Proposed BHA S&OP Process
Business units that are typically part of private sector S&OP processes include Demand Planning and Procurement, Supply Management, and Operations. While roles and responsibilities within BHA may not directly translate to the traditional sense of the S&OP process, it can provide a structured approach to coordinate and align all relevant stakeholders of BHA. This section translates a traditional business S&OP to the humanitarian context that attempts to alleviate the planning challenges presented by the sheer nature of disaster response.
Figure 9: Three-step S&OP procedure
1. Identifying Demand. In this step, the Country Office (CO) and Regional teams assess potential hazard level threats and the vulnerability of the population in order to determine expected demand over a longer time horizon and prior to the occurrence of a disaster.
2. Demand and Supply Planning. In this step, the BHA Supply Chain team analyzes current supply levels
across BHA and external organizations. This is then paired against the anticipated demand that is generated in the first step in order to understand potential supply gaps. This provides the Supply Chain team with the information required to effectively manage inventory and place orders in a timely manner. The BHA Supply Chain team will also produce a commodity level forecast based on historical data. This forecast serves as a “top-down” forecast as opposed to the country-level, “bottom-up” forecast that is generated in step one. Marrying these two forecasts through discussion – step three – results in well-rounded demand and supply plans that can be reconciled with existing budget allocations. At the end of this step, demand and operational plans, which include order frequency, inventory allocation, and distribution details by region will be developed. In doing so, BHA Supply Chain ultimately plays a role in both ‘Sales’ and ‘Operations’ in the traditional sense of the S&OP process.
14
Figure 10: An S&OP Process Is Driven by a Baseline Demand Forecast; Source: Larry Lapide, 2006.
3. Converge, align and agree on plans. This is the crucial stage of the S&OP process that seeks to breakdown silos between teams and the stages of the planning process. Often times, demand is determined using inputs that the Supply Chain teams might not be aware of, such as monitoring and evaluation reports or partner requests. It is critical that forecasting takes new data points such as these into consideration in order to improve accuracy and match supply with demand growth (Figure 5). This final step should take the Operating Year Budget into consideration, as plans will need to be reconciled with budgets. The financial plan should provide both Program and Logistics teams with the guidance needed to determine the disaster scale (percentage of demand served) that the organization should consider during the finalization of demand plans and inventory allocation. The S&OP process provides a discrete mechanism that establishes clear guidelines and an avenue for such collaborative discussions.
Data-driven Decision Tools
In an effort to fully harness the data that BHA has at its disposal, MIT has developed technology and analytical tools to bolster the proposed demand, supply, and distribution plans that are generated through the S&OP process. More specifically, the model can be directly linked to both step one and step two in the proposed S&OP process by assisting with disaster prediction (forecasting) and inventory allocation optimization (demand and supply planning). The model seeks to improve these steps by providing BHA with the unbiased tools necessary to optimize their inventory network based on existing inventory levels and desired scope, scale, and budgetary criteria, which will be established and/or discussed during the S&OP process. The model will help BHA Supply Chain with demand planning by identifying target inventory levels that provide the lowest cost given a set of constraints, and will help tie planning to
15
operations and execution. The tool will also assist with forecasting and the quantification of the disaster “scaling” mechanism and the impact of both on inventory allocation.
Ultimately, the model can help facilitate discussion between various teams across BHA at the global, regional, and country-level. Historical data (such as total population served by BHA) can be analyzed through the model by generating risk portfolio scenarios and highlighting the inventory requirements associated with each (Figure 6). The more features (i.e. additional warehouses, modes, predicted TAP) added to the model in the future, the more intuition can be built by managers to aid with decision-making.
Figure 11: Optimal Inventory Allocation – All
Implementation
In traditional S&OP process implementation, planning review cycles typically occur monthly. BHA may benefit from incorporating the S&OP process (and thereby the MIT model) at a number of different points throughout the year. The team recommends that BHA begin with a 6-month review cycle, and determine the need for additional reviews once the process has been fully adopted. Other review considerations include the restocking process, which provides BHA with the perfect opportunity to incorporate the regional inventory allocation outputs of the model. It is at this stage that the model can contribute to the inventory and capacity balancing act (Figure 1) that the S&OP process seeks to fulfill.
Additional review periods may also provide BHA with a chance to ensure that the supply chain is setup to respond quickly and efficiently to disasters and that inventory is optimized across the network. These review periods could align with ordering cycles or simply serve as guide posts throughout the year as plans are updated with real-time disaster data.
16
• Quarterly Review: Model updates may include new disaster data or inputs. These types of updates could consider additional disaster data (non-BHA response), additional warehouse locations, and / or additional mode considerations.
• Ad hoc review: Business decisions may generate network change, such as changes to “scale”, target fill rates, and / or changes to BHA’s inventory profile.
• Metric review: Business decisions may generate budgetary changes that would impact model constraints or the optimization objective function.
Future Work
Extension of this research or future work could include the development of a user-friendly tool that the organization could incorporate into their planning processes. In order to do this, the organization would ideally define a supply chain strategy and planning process that would provide a stable environment that could produce a range of fixed parameters that such a tool could support. In addition to this, future research on predictive analytics to develop a disaster portfolio would enhance BHA’s supply chain planning as well the decision-support tools that augment such planning. This work could have other applications outside of supply chain, such as programmatic planning of budgets for future awards. The team would be motivated to pursue this future work provided additional resources and funding at a later point in time.
Attachments
1. Presentation of results from Phase I: 20190916_OFDA_MIT_Phase_I_Analyses.pdf 2. Presentation of results from Phase II: 20200930_BHA_MIT_Phase_II_Report.pdf 3. S&OP description: 20200926_S_and_OP