HAL Id: hal-03176486
https://hal.sorbonne-universite.fr/hal-03176486
Submitted on 22 Mar 2021
HAL is a multi-disciplinary open access
archive for the deposit and dissemination of
sci-entific research documents, whether they are
pub-lished or not. The documents may come from
teaching and research institutions in France or
abroad, or from public or private research centers.
L’archive ouverte pluridisciplinaire HAL, est
destinée au dépôt et à la diffusion de documents
scientifiques de niveau recherche, publiés ou non,
émanant des établissements d’enseignement et de
recherche français ou étrangers, des laboratoires
publics ou privés.
Laurenske Visser, Celine Louapre, Carin Uyl-de Groot, William Redekop
To cite this version:
Laurenske Visser, Celine Louapre, Carin Uyl-de Groot, William Redekop. Health-related quality of
life of multiple sclerosis patients: a European multi-country study. Archives of Public Health, BioMed
Central, 2021, 79 (1), pp.39. �10.1186/s13690-021-00561-z�. �hal-03176486�
R E S E A R C H
Open Access
Health-related quality of life of multiple
sclerosis patients: a European multi-country
study
Laurenske A. Visser
1*, Celine Louapre
2,3, Carin A. Uyl-de Groot
1,4and William K. Redekop
1,4Abstract
Background: Inconsistent use of generic and disease-specific health-related quality of life (HRQOL) instruments in multiple sclerosis (MS) studies limits cross-country comparability. The objectives: 1) investigate real-world HRQOL of MS patients using both generic and disease-specific HRQOL instruments in the Netherlands, France, the United Kingdom, Spain, Germany and Italy; 2) compare HRQOL among these countries; 3) determine factors associated with HRQOL.
Methods: A cross-sectional, observational online web-based survey amongst MS patients was conducted in June– October 2019. Patient demographics, clinical characteristics, and two HRQOL instruments: the generic EuroQOL (EQ-5D-5L) and disease-related Multiple Sclerosis Quality of Life (MSQOL)-54, an extension of the generic Short Form-36 (SF-36) was collected. Health utility scores were calculated using country-specific value sets. Mean differences in HRQOL were analysed and predictors of HRQOL were explored in regression analyses.
Results: In total 182 patients were included (the Netherlands: n = 88; France: n = 58; the United Kingdom: n = 15; Spain: n = 10; living elsewhere: n = 11). Mean MSQOL-54 physical and mental composite scores (42.5, SD:17.2; 58.3, SD:21.5) were lower, whereas the SF-36 physical and mental composite scores (46.8, SD:22.6; 53.1, SD:22.5) were higher than reported in previous clinical trials. The mean EQ-5D utility was 0.65 (SD:0.26). Cross-country differences in HRQOL were found. A common predictor of HRQOL was disability status and primary progressive MS.
Conclusions: The effects of MS on HRQOL in real-world patients may be underestimated. Combined use of generic and disease-specific HRQOL instruments enhance the understanding of the health needs of MS patients.
Consequent use of the same instruments in clinical trials and observational studies improves cross-country comparability of HRQOL.
Keywords: Quality of life, Multiple sclerosis, Health utility, Disease-specific measure, EQ-5D Background
Multiple sclerosis (MS) is a chronic disease with neuro-logical dysfunction of the central nervous system, affect-ing 700,000 people in Europe and some 2.3 million people worldwide [1, 2]. While the survival of MS
patients has improved [2], they still have lower health re-lated quality of life (HRQOL) compared to the general population [3] and patients with other chronic diseases [4,5]. HRQOL measures the impact of an illness or dis-ease on the quality of life of patients as how they per-ceive it and its measurement helps to determine the effects of a treatment on HRQOL.
Many different generic or disease-specific HRQOL in-struments have been used in MS-related randomized © The Author(s). 2021 Open Access This article is licensed under a Creative Commons Attribution 4.0 International License, which permits use, sharing, adaptation, distribution and reproduction in any medium or format, as long as you give appropriate credit to the original author(s) and the source, provide a link to the Creative Commons licence, and indicate if changes were made. The images or other third party material in this article are included in the article's Creative Commons licence, unless indicated otherwise in a credit line to the material. If material is not included in the article's Creative Commons licence and your intended use is not permitted by statutory regulation or exceeds the permitted use, you will need to obtain permission directly from the copyright holder. To view a copy of this licence, visithttp://creativecommons.org/licenses/by/4.0/. The Creative Commons Public Domain Dedication waiver (http://creativecommons.org/publicdomain/zero/1.0/) applies to the data made available in this article, unless otherwise stated in a credit line to the data.
* Correspondence:l.a.visser@eshpm.eur.nl
1Department of Health Technology Assessment, Erasmus School of Health
Policy & Management, Erasmus University Rotterdam, P.O.Box 1738/ 3000 DR, Rotterdam, The Netherlands
controlled trials (RCTs), observational studies and patient registries [6,7]. Whilst generic instruments make it possible to compare HRQOL results to those of the general public and other diseases, disease-specific instru-ments can provide results that are more tailored to the disease in question [8]. Commonly used generic instru-ments in MS clinical studies and economic evaluations are the Medical Outcomes Study Short Form-36 (SF-36) and the EuroQOL 5 dimensions questionnaire (EQ-5D) [6, 8–10]. A hybrid HRQOL instrument that combines aspects of the generic SF-36 with MS-specific domains, such as questions about bladder/bowel function and sexual function, is the Multiple Sclerosis Quality of Life (MSQOL)-54 instrument [11]. While it is advisable to use both generic and disease-specific instruments to in-form health technology assessment of treatments [12], it is uncommon to include both instruments in RCTs or observational studies [6]. To be able to inform both healthcare professionals and policy makers about the HRQOL of MS patients outside a clinical setting, it is therefore interesting to collect so-called real-world data.
The use of diverse HRQOL instruments in different MS studies limits the comparability of outcomes between these studies [13]. To the best of our know-ledge, there has been no recent comprehensive European study of the HRQOL of MS patients in a real-world setting using both a generic and disease-specific HRQOL instrument. The aim of this study is threefold: 1.) to investigate the real-world HRQOL of patients with MS in several European countries in-cluding the Netherlands, France, the United Kingdom, Spain, Germany and Italy, 2.) to compare HRQOL among these countries, and 3.) determine factors as-sociated with HRQOL.
Methods
Study design
We performed a cross-sectional online survey be-tween June and October 2019 in six European coun-tries (the Netherlands, France, the United Kingdom, Spain, Germany and Italy). These countries were se-lected to give a representative overview of the HRQOL of the EU-5 and the Dutch MS patient population. Patients were recruited through the infor-mation channels of national patient societies and so-cial media. Based on feasibility and the exploratory nature of the study (to investigate the current HRQOL of MS patients, and no hypothesis testing) we aimed to include 50 persons per country (i.e. non-probability sampling). In France the patients were also recruited by a MS specialist working at a MS centre in Paris. The study information and informed consent form could be downloaded by the patient. The re-search protocol was reviewed and approved by the
Medical Research Ethics Committees of the Erasmus Medical Centre (MEC-2018-1636). Qualtrics XM soft-ware was used to perform the survey. The STROBE checklist for cross-sectional studies was used for reporting this study [14].
Inclusion criteria
Patients had to be≥18 years old and have the diagnosis of clinically definite MS (including clinically isolated syn-drome (CIS), relapsing-remitting MS (RRMS), secondary progressive MS (SPMS), or primary progressive MS (PPMS)). No restrictions were made on whether patients were currently taking or had previously taken disease modifying therapies (DMTs). Participants required access to the internet.
Data collection
The online web-based survey consisted of three parts: 1) patient demographics and clinical characteristics; 2) the EQ-5D with five levels (EQ-5D-5L) to collect informa-tion about the patient’s health state [10]; and 3) the MSQOL-54 to collect information about the disease-related QOL [11]. The survey took roughly 15–20 min
to complete.
The survey was available in six languages and the par-ticipant was free to choose which language to use when completing it. Questions regarding demographics and clinical characteristics were translated from Dutch into the other languages by a professional translation agency and double-checked by native speakers. Official transla-tions of the EQ-5D-5L and the MSQOL-54 were used.
Measures
Patients were asked to provide information on their age, country of residence (options: the Netherlands, France, the United Kingdom, Spain, Germany, Italy and ‘living elsewhere’), nationality, gender, marital status and edu-cational level. Clinical characteristics included the type of MS, age at diagnosis, disability and their current and previous treatment. Disability was self-reported using the Expanded Disability Status Scale (EDSS), an instru-ment to rate neurological impairinstru-ments, with a total score ranging from 0 (normal) to 10 (death due to MS) [15].
The EQ-5D-5L is a standardized and validated HRQOL instrument [10, 16] that yields a single generic measure of health to quantify HRQOL used in clinical and economic evaluations [6, 17]. The health states can be converted into a single “health utility” score, where 0 equals death and 1.0 equals perfect health. For France, the Netherlands and Spain the health utility scores were calculated using French, Dutch and Spanish country value sets, respectively [18–20]. For the UK, the cross-walk value set was used [21, 22]. The value set used to calculate utility scores of patients living elsewhere was
determined by the most commonly used language filled in by the patients living elsewhere.
The MSQOL-54 is a validated instrument with an adequate test-retest reliability, construct validity and in-ternal consistency [11]. The instrument consists of the generic SF-36 [9], extended with health concepts rele-vant for MS patients [11]. It contains 52 QOL items that are divided across 12 scales (physical function, role limitations-physical, role limitations-emotional, pain, emotional well-being, energy, health perceptions, social function, cognitive function, health distress, overall qual-ity of life, and sexual function) and two single items (sat-isfaction with sexual function and change in health) [11]. Two summary scores, physical health composite score (PHCS) and mental health composite score (MHCS) are derived from a weighted combination of scale scores. Scale and composite scores range from 0 to 100, where a higher score indicates a better QOL [11]. The SF-36 composite scores can be calculated from the MSQOL-54 [11] and have a mean of 50 (SD:10) in the general popu-lation [23].
Statistical analysis
Statistical analyses were performed with Stata 16.0. Analyses were stratified according to country of resi-dence. Differences in mean scores across countries were calculated using the analysis of variance (ANOVA) test; if assumptions for the ANOVA were violated (we checked the distribution of the variables by plotting a histogram), the non-parametric Kruskal-Wallis test was used. Testing for a relationship between categorical vari-ables was done using the chi-square test or the non-parametric Fishers exact test for small samples. Post-hoc analysis was done using either the Bonferroni correction or the Dunn’s test. Statistical significance was defined as p < 0.05.
Bivariate association of the EQ-5D-5L dimensions to EDSS was investigated with Spearman correlation coeffi-cients. Univariate and multivariate analyses were con-ducted to examine the relationship between patient demographics and the EQ-5D-5L dimensions, health utility, the MSQOL-54 scales and the PHCS/MHCS. Co-variates included in the multiple regressions were based on significance in the univariate analysis. A linear or lo-gistic regression was performed for a continuous or cat-egorical outcome variable, respectively. The stepwise backward selection method was used for the multivariate regression and variables were kept in the model based on significance.
Results
The attempted sample size of 50 per country was not feasible in the UK, Spain, Germany and Italy given that patients were very difficult to recruit, therefore we
ceased recruitment 5 months after the start of the study. A total of 281 patients were recruited and started the survey. Ninety-nine participants were dropped from the analysis since they did not finish the survey (n = 55), did not give informed consent (n = 39), had provided an age of diagnosis that was older than their current age (n = 3), or were younger than 18 years (n = 2). This left 182 participants for analysis.
Patient demographics can be found in Table 1. Patients were analysed based on country of residence (the Netherlands: n = 88; France: n = 58; the United Kingdom:n = 15; living elsewhere: n = 11; Spain: n = 10). The total population had a median age of 43 years old and the average age at diagnosis was 34 years old. Roughly 80% were female and most participants (80%) had RRMS. There were no significant differences in patient demographics across the countries other than the age at diagnosis (range: 31.2–41.6 years) and educa-tional level (an average of 52% having a university degree).
The results regarding current and past treatments can be found in the Additional file 1 (Table A1). A total of 165 patients (90.8%) received DMT at one time or an-other; more than two-thirds were either currently taking a DMT (n = 131, 72.0%) or had received it in the past (n = 34, 18.9%). Of those currently taking a DMT, 44.7% were taking a first-line DMT, which was either an inject-able (n = 26; 19.9%) or an oral treatment (n = 32; 24.4%). Over half of the patients currently taking a DMT were receiving a second-line therapy (n = 73; 55.7%). A minor-ity received oral treatment (n = 20; 27.4%) and the majority received infusion therapy (n = 52; 71.2%). Many of the patients receiving infusion therapy were taking ocrelizumab (n = 39; 75%).
The DMT frequencies seen in the different countries were not significantly different, except for the use of INF-β 1a (p = 0.018) and ocrelizumab (p = 0.003) (Table A1). A cross-country difference was found regarding previous use of INF-β 1a (range: 6.7–27.6%), driven primarily by the French and Dutch populations. Furthermore, a cross-country difference was found regarding current use of ocre-lizumab (range: 0.0–32.9%). Treatments used by less than 5% of the patients included INF-β 1b, cladribine and alemtuzumab.
EQ-5D-5L
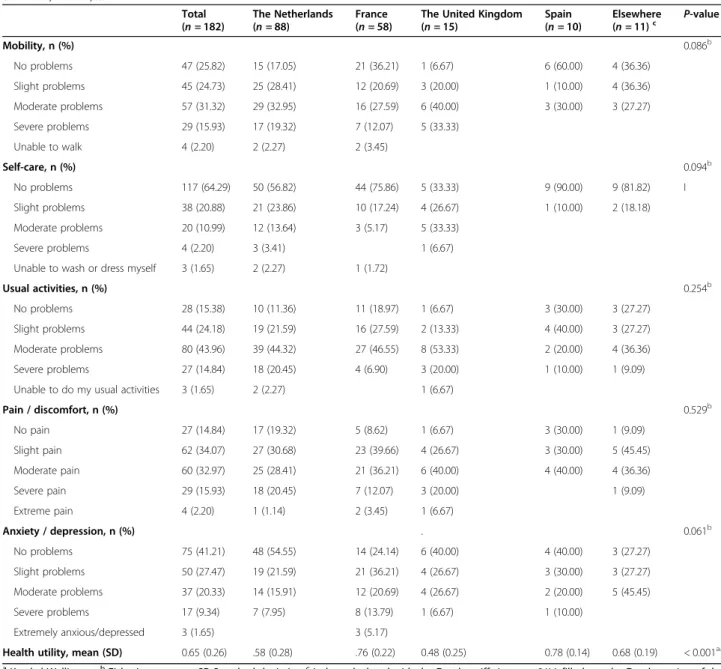
The total mean health utility score was 0.65 (SD:0.26) (Table2). Overall, one-third of all patients had moderate problems with mobility (n = 57; 31.3%) and 44% had moderate problems with usual activities. A majority had slight to moderate pain and discomfort (n = 62; 34.17% and n = 60; 32.9%). Generally, the patients had no prob-lems with self-care (n = 117; 64.3%) or anxiety and depression (n = 75; 41.2%).
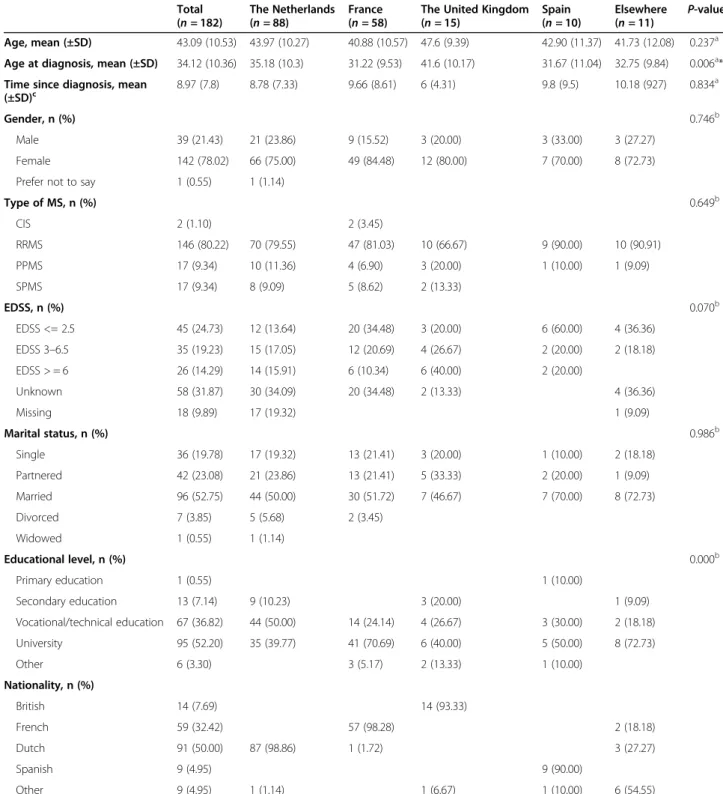
Table 1 Patient demographics (mean, standard deviation, number, frequency and p-value) of the total study population (n = 182) and per country (the Netherlands, France, the United Kingdom, Spain and elsewhere (Germany or Italy)), 2019
Total (n = 182) The Netherlands (n = 88) France (n = 58)
The United Kingdom (n = 15) Spain (n = 10) Elsewhere (n = 11) P-value Age, mean (±SD) 43.09 (10.53) 43.97 (10.27) 40.88 (10.57) 47.6 (9.39) 42.90 (11.37) 41.73 (12.08) 0.237a Age at diagnosis, mean (±SD) 34.12 (10.36) 35.18 (10.3) 31.22 (9.53) 41.6 (10.17) 31.67 (11.04) 32.75 (9.84) 0.006a* Time since diagnosis, mean
(±SD)c 8.97 (7.8) 8.78 (7.33) 9.66 (8.61) 6 (4.31) 9.8 (9.5) 10.18 (927) 0.834 a
Gender, n (%) 0.746b
Male 39 (21.43) 21 (23.86) 9 (15.52) 3 (20.00) 3 (33.00) 3 (27.27) Female 142 (78.02) 66 (75.00) 49 (84.48) 12 (80.00) 7 (70.00) 8 (72.73) Prefer not to say 1 (0.55) 1 (1.14)
Type of MS, n (%) 0.649b CIS 2 (1.10) 2 (3.45) RRMS 146 (80.22) 70 (79.55) 47 (81.03) 10 (66.67) 9 (90.00) 10 (90.91) PPMS 17 (9.34) 10 (11.36) 4 (6.90) 3 (20.00) 1 (10.00) 1 (9.09) SPMS 17 (9.34) 8 (9.09) 5 (8.62) 2 (13.33) EDSS, n (%) 0.070b EDSS <= 2.5 45 (24.73) 12 (13.64) 20 (34.48) 3 (20.00) 6 (60.00) 4 (36.36) EDSS 3–6.5 35 (19.23) 15 (17.05) 12 (20.69) 4 (26.67) 2 (20.00) 2 (18.18) EDSS > = 6 26 (14.29) 14 (15.91) 6 (10.34) 6 (40.00) 2 (20.00) Unknown 58 (31.87) 30 (34.09) 20 (34.48) 2 (13.33) 4 (36.36) Missing 18 (9.89) 17 (19.32) 1 (9.09) Marital status, n (%) 0.986b Single 36 (19.78) 17 (19.32) 13 (21.41) 3 (20.00) 1 (10.00) 2 (18.18) Partnered 42 (23.08) 21 (23.86) 13 (21.41) 5 (33.33) 2 (20.00) 1 (9.09) Married 96 (52.75) 44 (50.00) 30 (51.72) 7 (46.67) 7 (70.00) 8 (72.73) Divorced 7 (3.85) 5 (5.68) 2 (3.45) Widowed 1 (0.55) 1 (1.14) Educational level, n (%) 0.000b Primary education 1 (0.55) 1 (10.00) Secondary education 13 (7.14) 9 (10.23) 3 (20.00) 1 (9.09) Vocational/technical education 67 (36.82) 44 (50.00) 14 (24.14) 4 (26.67) 3 (30.00) 2 (18.18) University 95 (52.20) 35 (39.77) 41 (70.69) 6 (40.00) 5 (50.00) 8 (72.73) Other 6 (3.30) 3 (5.17) 2 (13.33) 1 (10.00) Nationality, n (%) British 14 (7.69) 14 (93.33) French 59 (32.42) 57 (98.28) 2 (18.18) Dutch 91 (50.00) 87 (98.86) 1 (1.72) 3 (27.27) Spanish 9 (4.95) 9 (90.00) Other 9 (4.95) 1 (1.14) 1 (6.67) 1 (10.00) 6 (54.55)
MS Multiple sclerosis, CIS Clinically isolated syndrome, RRMS Relapsing-remitting MS, PPMS Primary progressive MS, SPMS Secondary progressive MS, EDSS Expanded Disability Status Scale,a: Kruskal-Wallis test,b: Fisher’s exact test,c: Time since diagnosis was calculated by subtracting the age at diagnosis from the current age, *Significant difference in mean age at diagnosis between France and the United Kingdom (p = 0.002) using Dunn’s test and Bonferroni correction
Given the country-specific tariffs, there were statisti-cally significant differences in utility between the countries (range: 0.48–0.78; p < 0.001) (Table 2). How-ever, once calculated using only the Dutch tariff, this was no longer the case (range: 0.48–0.73; p = 0.012) (results not shown). No statistical between-country differences were found amongst the EQ-5D-5L dimensions (Table 2).
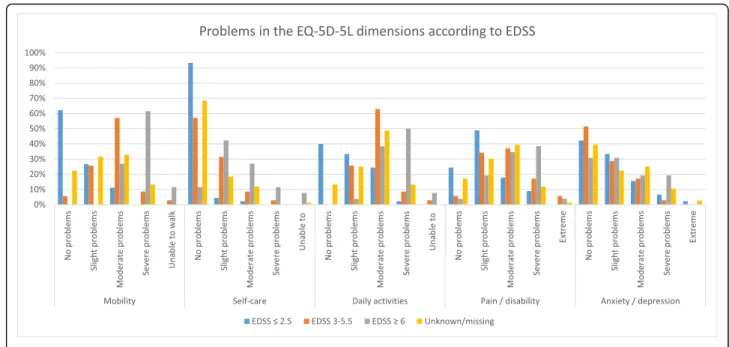
Patients with mild disability (EDSS≤2.5) generally had no problems with mobility (n = 28; 62.2%) or self-care (n = 42; 93.3%) (Fig. 1). However, almost 60% had slight
to moderate problems with daily activities, and 48.9% suffered from slight pain. The majority were not anxious or depressed (n = 19; 42.2%). Patients with greater dis-ability (EDSS 3–5.5 and ≥ 6) were more likely to have moderate to severe problems in mobility, daily activities and pain/discomfort. However, disability was not associ-ated with anxiety/depression. Furthermore, there was a strong and significant correlation of the EQ-5D-5L do-mains mobility, self-care and usual activities to disability (Additional file 1: Table A2). Pain/ discomfort had a moderate significant correlation, whereas anxiety/
Table 2 Problems in the EQ-5D-5L dimensions and health utility (mean, standard deviation, number, frequency and p-value) of the total study population and according to country of residence (the Netherlands, France, the United Kingdom, Spain and elsewhere (Germany or Italy)), 2019 Total (n = 182) The Netherlands (n = 88) France (n = 58)
The United Kingdom (n = 15) Spain (n = 10) Elsewhere (n = 11)c P-value Mobility, n (%) 0.086b No problems 47 (25.82) 15 (17.05) 21 (36.21) 1 (6.67) 6 (60.00) 4 (36.36) Slight problems 45 (24.73) 25 (28.41) 12 (20.69) 3 (20.00) 1 (10.00) 4 (36.36) Moderate problems 57 (31.32) 29 (32.95) 16 (27.59) 6 (40.00) 3 (30.00) 3 (27.27) Severe problems 29 (15.93) 17 (19.32) 7 (12.07) 5 (33.33) Unable to walk 4 (2.20) 2 (2.27) 2 (3.45) Self-care, n (%) 0.094b No problems 117 (64.29) 50 (56.82) 44 (75.86) 5 (33.33) 9 (90.00) 9 (81.82) I Slight problems 38 (20.88) 21 (23.86) 10 (17.24) 4 (26.67) 1 (10.00) 2 (18.18) Moderate problems 20 (10.99) 12 (13.64) 3 (5.17) 5 (33.33) Severe problems 4 (2.20) 3 (3.41) 1 (6.67) Unable to wash or dress myself 3 (1.65) 2 (2.27) 1 (1.72)
Usual activities, n (%) 0.254b
No problems 28 (15.38) 10 (11.36) 11 (18.97) 1 (6.67) 3 (30.00) 3 (27.27) Slight problems 44 (24.18) 19 (21.59) 16 (27.59) 2 (13.33) 4 (40.00) 3 (27.27) Moderate problems 80 (43.96) 39 (44.32) 27 (46.55) 8 (53.33) 2 (20.00) 4 (36.36) Severe problems 27 (14.84) 18 (20.45) 4 (6.90) 3 (20.00) 1 (10.00) 1 (9.09) Unable to do my usual activities 3 (1.65) 2 (2.27) 1 (6.67)
Pain / discomfort, n (%) 0.529b No pain 27 (14.84) 17 (19.32) 5 (8.62) 1 (6.67) 3 (30.00) 1 (9.09) Slight pain 62 (34.07) 27 (30.68) 23 (39.66) 4 (26.67) 3 (30.00) 5 (45.45) Moderate pain 60 (32.97) 25 (28.41) 21 (36.21) 6 (40.00) 4 (40.00) 4 (36.36) Severe pain 29 (15.93) 18 (20.45) 7 (12.07) 3 (20.00) 1 (9.09) Extreme pain 4 (2.20) 1 (1.14) 2 (3.45) 1 (6.67) Anxiety / depression, n (%) . 0.061b No problems 75 (41.21) 48 (54.55) 14 (24.14) 6 (40.00) 4 (40.00) 3 (27.27) Slight problems 50 (27.47) 19 (21.59) 21 (36.21) 4 (26.67) 3 (30.00) 3 (27.27) Moderate problems 37 (20.33) 14 (15.91) 12 (20.69) 4 (26.67) 2 (20.00) 5 (45.45) Severe problems 17 (9.34) 7 (7.95) 8 (13.79) 1 (6.67) 1 (10.00) Extremely anxious/depressed 3 (1.65) 3 (5.17)
Health utility, mean (SD) 0.65 (0.26) .58 (0.28) .76 (0.22) 0.48 (0.25) 0.78 (0.14) 0.68 (0.19) < 0.001a*
a
Kruskal-Wallis test,bFisher’s exact test, SD Standard deviationcIndex calculated with the Dutch tariff sincen = 8/11 filled out the Dutch version of the survey. *: Significant difference in health utility scores between France and the Netherlands (p < 0.001), France and the United Kingdom (p < 0.001), the United Kingdom and Spain (p = 0.021), based on Dunn’s test and Bonferroni correction
depression had a weak though non-significant correl-ation to disability.
MSQOL-54 and SF-36
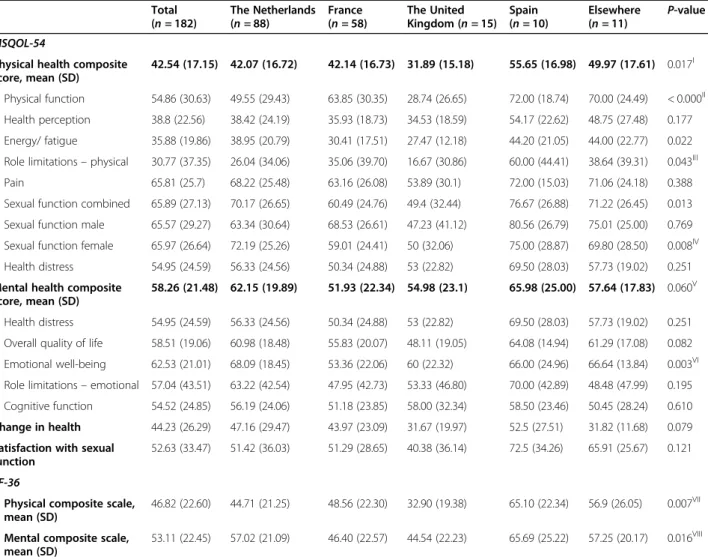
The results of the MSQOL-54 and SF-36 are presented in Table 3. The mean MSQOL-54 physical health com-posite score (MSQOL-54 PHCS) and mental health composite scale (MSQOL-54 MHCS) for the total popu-lation was 42.5 (SD: 17.2) and 58.3 (SD: 21.5), respect-ively. The mean MSQOL-54 PHCS differed significantly between countries (range: 31.9–55.6, p = 0.017). In contrast, no significant difference between countries was found on the MSQOL-54 MHCS (range: 51.9–65.9, p = 0.06). The mean SF-36 physical composite score (SF-36 PCS) and mental composite score (SF-36 MCS) for the total population was 46.8 (SD: 22.6) and 53.1 (SD: 22.45), respectively. Both scores differed significantly be-tween countries (PCS: range 32.9–65.1, p = 0.007; MCS: range 44.5–65.7, p = 0.016).
Regression analyses
Table4 shows the results of the analyses to examine the relationship between patient demographics and the health utility, PHCS and MHCS scores. Multivariate analysis found that age, age at diagnosis, marital status and current line of treatment were not associated with utility, PHCS and MHCS. PPMS was independently as-sociated with lower utility, PHCS and MHCS. Further-more, moderate to severe disability (EDSS 3–9.5) and unknown disability was independently associated with
lower utility and PHCS. After correction for other characteristics, French patients reported a higher utility than other patients, while Dutch and Spanish patients reported a higher PHCS score.
Additional univariate and multivariate models for the EQ-5D-5L dimensions and utility, MSQOL-54 scales and composite scores are shown in the Additional file1
(Tables A3, A4). Discussion
The aim of this study was to examine real-world HRQOL of patients with MS in several European coun-tries. The generic health utility instrument (the EQ-5D-5L) and the hybrid disease-specific MSQOL-54 (includ-ing the SF-36) instruments were used to calculate HRQOL. Compared to previous research, our results indicate that the HRQOL of MS patients may have been overestimated. We found a relatively low health utility score, with no between-country differences amongst the EQ-5D-5L dimensions. Somewhat low HRQOL was found using the MSQOL-54 with between-country differences. Furthermore, disability status and PPMS is negatively correlated with HRQOL.
The mean EQ-5D utility score (0.65 ± 0.26 SD) in our population was lower than the scores (range: 0.69–0.78) reported in other multi-country studies [24–26]. Previ-ous MS studies have used the older EQ-5D-3L method, rather than the newer EQ-5D-5L [24–27]. However, the EQ-5D-5L significantly increases sensitivity, reliability and has less of a ceiling effect than the EQ-5D-3L [16].
Fig. 1 Problems in the EQ-5D-5L dimensions according to disability status of the total study population (the Netherlands, France, the United Kingdom, Spain and elsewhere (Germany or Italy)), 2019. EQ-5D-5L: EuroQol 5-dimensions 5 levels, EDSS: Expanded Disability Status Scale
Table 3 The MSQOL-54 and SF-36 scores (mean, standard deviation and p-value) of the total study population and according to country of residence (the Netherlands, France, the United Kingdom, Spain and elsewhere (Germany or Italy)), 2019
Total (n = 182) The Netherlands (n = 88) France (n = 58) The United Kingdom (n = 15) Spain (n = 10) Elsewhere (n = 11) P-valuea MSQOL-54
Physical health composite score, mean (SD)
42.54 (17.15) 42.07 (16.72) 42.14 (16.73) 31.89 (15.18) 55.65 (16.98) 49.97 (17.61) 0.017I Physical function 54.86 (30.63) 49.55 (29.43) 63.85 (30.35) 28.74 (26.65) 72.00 (18.74) 70.00 (24.49) < 0.000II
Health perception 38.8 (22.56) 38.42 (24.19) 35.93 (18.73) 34.53 (18.59) 54.17 (22.62) 48.75 (27.48) 0.177 Energy/ fatigue 35.88 (19.86) 38.95 (20.79) 30.41 (17.51) 27.47 (12.18) 44.20 (21.05) 44.00 (22.77) 0.022 Role limitations– physical 30.77 (37.35) 26.04 (34.06) 35.06 (39.70) 16.67 (30.86) 60.00 (44.41) 38.64 (39.31) 0.043III
Pain 65.81 (25.7) 68.22 (25.48) 63.16 (26.08) 53.89 (30.1) 72.00 (15.03) 71.06 (24.18) 0.388 Sexual function combined 65.89 (27.13) 70.17 (26.65) 60.49 (24.76) 49.4 (32.44) 76.67 (26.88) 71.22 (26.45) 0.013 Sexual function male 65.57 (29.27) 63.34 (30.64) 68.53 (26.61) 47.23 (41.12) 80.56 (26.79) 75.01 (25.00) 0.769 Sexual function female 65.97 (26.64) 72.19 (25.26) 59.01 (24.41) 50 (32.06) 75.00 (28.87) 69.80 (28.50) 0.008IV
Health distress 54.95 (24.59) 56.33 (24.56) 50.34 (24.88) 53 (22.82) 69.50 (28.03) 57.73 (19.02) 0.251 Mental health composite
score, mean (SD)
58.26 (21.48) 62.15 (19.89) 51.93 (22.34) 54.98 (23.1) 65.98 (25.00) 57.64 (17.83) 0.060V
Health distress 54.95 (24.59) 56.33 (24.56) 50.34 (24.88) 53 (22.82) 69.50 (28.03) 57.73 (19.02) 0.251 Overall quality of life 58.51 (19.06) 60.98 (18.48) 55.83 (20.07) 48.11 (19.05) 64.08 (14.94) 61.29 (17.08) 0.082 Emotional well-being 62.53 (21.01) 68.09 (18.45) 53.36 (22.06) 60 (22.32) 66.00 (24.96) 66.64 (13.84) 0.003VI Role limitations– emotional 57.04 (43.51) 63.22 (42.54) 47.95 (42.73) 53.33 (46.80) 70.00 (42.89) 48.48 (47.99) 0.195 Cognitive function 54.52 (24.85) 56.19 (24.06) 51.18 (23.85) 58.00 (32.34) 58.50 (23.46) 50.45 (28.24) 0.610 Change in health 44.23 (26.29) 47.16 (29.47) 43.97 (23.09) 31.67 (19.97) 52.5 (27.51) 31.82 (11.68) 0.079 Satisfaction with sexual
function
52.63 (33.47) 51.42 (36.03) 51.29 (28.65) 40.38 (36.14) 72.5 (34.26) 65.91 (25.67) 0.121 SF-36
Physical composite scale, mean (SD)
46.82 (22.60) 44.71 (21.25) 48.56 (22.30) 32.90 (19.38) 65.10 (22.34) 56.9 (26.05) 0.007VII
Mental composite scale, mean (SD)
53.11 (22.45) 57.02 (21.09) 46.40 (22.57) 44.54 (22.23) 65.69 (25.22) 57.25 (20.17) 0.016VIII
MSQOL-54 Multiple Sclerosis Quality of Life −54 instrument, SF-36 Medical Outcomes Study Short Form-36.aKruskal-Wallis test and post-hoc analysis using Dunn’s
test and Bonferroni correction.ISignificant difference in mean physical health composite score between the United Kingdom and Spain (p = 0.007);IISignificant difference in mean physical function scores between the United Kingdom and France, the United Kingdom and elsewhere and the United Kingdom and Spain (p = < 0.000 for all three situations), and France and the Netherlands (p = 0.04);III
Significant differences in mean role limitations physical between the United Kingdom and Spain (p = 0.029);IVSignificant difference in mean sexual function female between France and elsewhere (p = 0.014);V
Significant difference in mean mental health composite score between France and the Netherlands (p = 0.046);VI
Significant difference in mean emotional well-being score between France and the Netherlands (p < 0.000);VII
Sig difference between the United Kingdom and Spain (p = 0.003), almost reaching significance difference between the United Kingdom and elsewhere (p = 0.057), and the Netherlands and Spain (p = 0.059);VIII
Almost reaching sig difference between France and Spain (p = 0.058). The sample size varied somewhat across the scales and the scores were calculated by excluding missing data [11]. For 27 questions the range of missing data was 0.55–2.75% (n = 1 to n = 5). Additionally, the range of missing data for four out of five health perception scale questions was higher (n = 20 to
n = 54; 14.83–29.67%)
Missing data: The sample size varied somewhat across the domains, the composite scores were calculated from the domains by excluding missing data. Missing data were found in physical health function question 3 (0.55%,n = 1 from the UK), physical health function question 5 (0.55%, n = 1 from FR), physical health function question 8 (1.65%,n = 3 from the NL), physical health function question 10 (0.55%, n = 1 from the NL), health perceptions question 34 (25.27%, n = 4, n = 7,n = 31, n = 2, and n = 2 from the UK, FR, NL, SP and elsewhere, respectively), health perceptions question 35 (10.99%, n = 3, n = 6, n = 9, n = 2 from the UK, FR, NL and SP country of residence, respectively), health perceptions question 36 (29.67%, n = 3,n = 15, n = 30, n = 4, n = 2 from the UK, FR, NL, SP and elsewhere, respectively), health perceptions question 37 (14.83%,n = 2, n = 12, n = 11, n = 4, n = 2 from the UK, FR, NL and SP country of residence, respectively), energy/ fatigue question 23 (0.55%,n = 1 from SP), energy/fatigue question 27 (0.55%, n = 1 from FR), energy/fatigue question 29 (1.10%, n = 1, n = 1 from FR and NL respectively), energy/fatigue question 32 (1.65%,n = 3 from FR), role limitations physical question 13 (1.10%, n = 2 from FR), role limitations physical question 14 (0.55%,n = 2 from NL), role limitations physical question 15 (0.55%, n = 1 from NL), role limitations physical question 16 (1.10%, n = 2 from NL), sexual function male (0.55%,n = 1 from NL), sexual function female (0.55%, n = 1 from UK), satisfaction with sexual function (1.10%, n = 2 from UK), health distress question 39 and 40 (0.55%,n = 1 from NL in both cases), overall quality of life (0.55%, n = 1 from FR), emotional well-being question 28 (2.20%, n = 1, n = 2, n = 1 from FR, NL and elsewhere, respectively), emotional well-being question 30 (0.55%,n = 1 from FR), role limitations emotional question 17 (1.10%, n = 1, n = 1 from FR and NL, respectively), role limitations emotional question 18 (1.65%,n = 2, n = 1 from FR and NL, respectively), role limitations emotional question 19 (2.20%, n = 2, n = 2 from FR and NL, respectively), cognitive function question 42 (0.55%,n = 1 from SP), cognitive function question 43 (1.10%, n = 2 from ES), cognitive function question 44 (1.65%,n = 1, n = 1, n = 1 from FR, NL and SP, respectively), cognitive function question 45 (2.75%, n = 1, n = 4 from FR and SP, respectively).
Table 4 Linear regression estimates: predictors of health utility and the MSQOL-54 composite scores of the total study population (the Netherlands, France, the United Kingdom, Spain and elsewhere (Germany or Italy)), 2019
Health utility Univariate Health utility Multivariatea PHCS Univariate PHCS Multivariate MHCS Univariate MHCS Multivariate Age (years) −0.006 (0.002)*** −0.257 (0.120)** 0.149 (0.154) Age at diagnosis (years) −0.007 (0.002)** −0.159
(0.124)
−0.010 (0.156) Time since diagnosis (years) −0.000 (0.003) −0.190
(0.163)
0.282 (0.205) Gender (female vs. male) 0.055 (0.047) 0.482 (3.098) −3.742
(3.883) Marital status Single Partnered 0.119 (0.061) * 3.770 (3.923) 6.816 (4.958) Married 0.084 (0.052) 5.372 (3.384) 7.889 (4.289)* Divorced −0.070 (0.110) −4.081 (7.097) 9.444 (8.921) Widowed 0.171 (0.280) −3.549 (17.383) 16.736 (21.807) Educational level Primary education Secondary education −0.296 (0.274) −38.651 (17.450)** −23.068 (22.460) Vocational/technical education −0.223 (0.266) −33.782 (16.940)** −25.104(21.803) University −0.119 (0.265) −27.890 (16.905) −24.458 (21.759) Other −0.160 (0.285) −32.622 (18.163)* −24.722(23.377) Country of residence United Kingdom France 0.281 (0.073)*** 0.131 (0.034)*** 10.251 (4.968)** −3.051 (6.137) The Netherlands 0.098 (0.070) 10.174 (4.800)** 5.364 (2.445)** 7.168 (5.912) Spain 0.293 (0.103)*** 23.758 (6.907)*** 11.074 (5.002)*** 11.000 (8.633) Elsewhere 0.195 (0.100)* 18.075 (6.722)*** 2.663 (8.395) Type of MSI CIS / RRMS PPMS −0.387 (0.062)*** −0.215 (0.058)*** −21.055 (4.219)*** −13.024 (4.208)*** −17.066 (5.343)*** −17.815 (5.326)*** SPMS −0.143 (0.062)** −9.204 (4.105)** 7.183 (5.343) EDSS EDSS <= 2.5 EDSS 3–5.5 −0.161 (0.051)*** −0.129 (0.048)*** −12.436 (3.482)*** −11.320 (3.419)*** − 1.415 (4.847) EDSS > = 6 −0.485 (0.056)*** − 0.383 (0.056)*** −25.362 (3.854)*** −21.194 (3.997)*** −7.789(5.294)
Given that previous studies used the older EQ-5D-3L method to calculate utilities this limits the comparability. Nonetheless, a similar trend is seen regarding disability and problems experienced in the dimensions. For example, the correlation of EQ-5D-3L domains to EDSS found by the European observational study by Eriksson et al. (2019) are of the same magnitude to ours (the co-efficients for mobility: 0.77 vs 0.83; self-care 0.67 vs 0.68; usual activities: 0.64 vs 0.73; pain/discomfort: 0.37 vs 0.46; anxiety/depression: 0.13 vs 0.06) [27]. As such, patients are more likely to suffer from problems with mobility, self-care, daily activities and pain/discomfort with increasing disability. Regarding anxiety and depres-sion, MS patients did not seem to experience increasing problems with increasing disability.
Our European population had a somewhat higher mean SF-36 physical component summary score (46.8 SE:1.7) and mental component summary score (53.11 SE:1.6) than most previously published DMT studies. The CONFIRM and DEFINE study, examining HRQOL while taking dimethyl fumarate, found mean SF-36 PCS and MCS of 43.1 and 47.2, and 43.4 and 45.3, respect-ively [24, 25]. Also, the CARE-MS I and II trials (treat-ment naïve and treat(treat-ment experienced patients receiving either INF-β 1a or alemtuzumab), found SF-36 compos-ite scores higher than our study (PCS range: 43.9–46.5; MCS range: 42.4–48.3) [26]. Even after the use of DMT treatment, the trials found lower composite scores com-pared to our results [24–26]. This is somewhat in con-trast to the review article by Jongen (2017), whom found that in clinical trials and observational studies DMT treatment may have a positive effect on HRQOL in RRMS patients [6], however it is less clear what the HRQOL is after such interventions. This may suggest that, based on the SF-36, real-world HRQOL of patients is more favourable than during a clinical trial.
The mean MSQOL-54 composite scores (PHCS: 42.5 SE:1.3; MHCS: 58.2 SE:1.6) in our European population were 10–20 points lower than scores reported in previous observational studies [28–32]. For example, a European observational phase 4 study including 284 patients from the Netherlands, Belgium, Luxembourg and the United Kingdom, found mean MSQOL-54 PHCS and MHCS scores of 56.6 and 57.2 [32]. Lower scores to ours may be due to population differences. The phase 4 study had a younger patient population (mean age 38.6 vs 43.1 years), less time since their RRMS diagnosis (3.5 vs 8.9 years) and less disability (mean EDSS 2.4 vs 3.5). Moreover, a 10-year HRQOL observa-tional study with 77 ambulatory MS patients in Finland found PHCS of 63.9 (SE:2.1) and MHCS 73.6 (SE: 2.2) [31]. Again, differences may be due to patient demo-graphics, while the patients included in Finland were somewhat older at baseline (mean age 47 vs 43 years old), the majority of patients had less disability (70% of patients had EDSS 0–3).
Disease-specific measurements are more extensive and have greater sensitivity to changes, meaning it can detect HRQOL differences between patients [6]. When correct-ing for patient characteristics, disability severity is nega-tively correlated with both health utility and the MSQOL-54 PHCS, however not with MHCS. The correlation be-tween disease severity and lower utility or physical health has been examined extensively [33–35], along with the negative effect of PPMS on HRQOL [36,37]. Though one might expect that increasing disability will lead to lower mental health, this was not found, neither in the correl-ation of EQ-5D dimensions to EDSS or in the multivariate regression analysis. Symptoms such as depression, fatigue and anxiety are commonly known to have a negative effect on HRQOL [37, 38]. The psychological components of MS are just as important as the physical symptoms when
Table 4 Linear regression estimates: predictors of health utility and the MSQOL-54 composite scores of the total study population (the Netherlands, France, the United Kingdom, Spain and elsewhere (Germany or Italy)), 2019 (Continued)
Health utility Univariate Health utility Multivariatea PHCS Univariate PHCS Multivariate MHCS Univariate MHCS Multivariate Unknown / missing −0.151 (0.043)*** −0.113 (0.040)*** −11.534 (2.906)*** −10.677 (2.851)*** −7.121(4.064)* Current line of treatment
Treatment naive
1st-line DMT 0.259 (0.071)*** 10.778 (4.785)**
1.709 (5.970) 2nd-line DMT 0.115 (0.069) 4.477 (4.677) 1.259 (5.844) Treatment experience but
currently no DMT
0.127 (0.077)* 4.857 (5.137) 3.450 (6.429)
PHCS Physical health composite score, MHCS Mental health composite score, CIS Clinically isolated syndrome, RRMS Relapsing-remitting multiple sclerosis, PPMS Primary progressive multiple sclerosisSPMS Secondary progressive multiple sclerosis, EDSS Expanded Disability Status Scale, DMT Disease modifying therapy.a Results show the regression with utility calculated using the country-specific tariffs. The multivariate regression was re-run calculating the utility with only the Dutch tariffs; country of residence was no longer a significant variable (Additional file1Table A3)
managing HRQOL [39], though perhaps more difficult to target.
We want to inform physicians and policy makers that it is useful to include HRQOL instruments in clinical practice and in clinical trials. The use of such instru-ments in clinical practice enables physicians to know what dimensions of HRQOL to target. As such, it is pos-sible to set up a personalized treatment plan, together with the patient, based on the HRQOL results [38]. Moreover, the use of HRQOL instruments in clinical care has shown significant benefits to the care given to patients [38]. Furthermore, we want to address the im-portance of measuring health utility and disease-specific HRQOL as end-points in clinical trials. Instruments such as the EQ-5D-5L and MSQOL-54 are able to quan-tity the potential added value of the new treatment or technology under examination, from the patient’s per-spective, in terms of HRQOL [40]. This information is needed to perform a health technology assessment and the subsequent economic evaluation, which in turn is es-sential for health policy makers to decide on reimburse-ment decisions and allowing the treatment or technology to enter the market [6,41].
Limitations
There are various limitations to our study worth not-ing The design of this study was to examine HRQOL in Europe, and not between-country differences. How-ever, post-hoc analysis revealed some between-country differences in HRQOL. Possible explanations of be-tween country differences in HRQOL may be ex-plained differing healthcare systems, the recruitment method and small samples in the UK and Spain. The healthcare systems of the examined countries differ, thereby possibly affecting the quality of care received by patients. Patients were recruited via the informa-tion channels of nainforma-tional patient societies, social media and via an MS specialist in France. Therefore, we had no control over how and to whom the patient societies reached out too, or the reach of our social media channels within the MS community. It is pos-sible that the patient societies differed in how actively they promoted the study, leading to selection bias. Furthermore, the small samples from the United Kingdom and Spain limits their representability of the HRQOL status of those two countries, thus caution is needed when making statements on their HRQOL. Since we had small samples, we did not perform gressions per country. If larger samples had been re-cruited this may have given insight into possible country differences. Future studies should be designed to specifically examine cross-country differences and controlling for more information than we have included in this study.
Many disease-specific HRQOL instruments have been developed since the introduction of the MSQOL-54 in 1995, such as the Functional Assessment of MS (FAMS), the Hamburg Quality of Life Questionnaire in MS (HAQUAMS), the MS Impact Scale-29 (MSIS-29) and the MS International Quality of Life questionnaire (MusiQoL) to name a few [6], each focussing on a variety of MS-related domains. Though perhaps more relevant when examining only disease-specific HRQOL we did not find them suitable for this study. A deliberate choice was made to use the hybrid MSQOL-54 given that it is an extension of the generic SF-36, enabling comparability to other diseases. However, they are useful when examining a specific MS-specific HRQOL domain, and future researchers should include them when deemed necessary.
One MS centre in France was involved in the data collection and this may have led to sampling bias. This reduces the comparability of the French patients to patients in the other countries, although it is comparable to a previous French multicentre study by Lebrun-Frenay et al. (2017). For example, both studies found that patients were in their early thirties when diagnosed, at least 50% of the patients had a university degree and the type of DMT used was similar [42]. The similarities in the patient demographics show that similar recruit-ment methods lead to comparable patient populations, thereby validating the results of the study. Our findings give more in depth knowledge about the combined gen-eric and disease-specific HRQOL status of French MS patients since Lebrun-Frenay and colleagues only exam-ined health utility using the EQ-5D-3L.
Three patients (other than patients living elsewhere) filled out the survey in a language that differed from the official language of their country of residence which may have impacted health utility results (since health utility is somewhat influenced by the choice of national value set) [19,43]. All patients were analysed based on country of residence, not on their nationality or user language of the survey (which may have differed across participants). However, since only involved three patients were involved, this had no major impact on the results.
Since the EDSS was self-reported, it is possible that some patients incorrectly estimated their EDSS due to a lack of understanding of the scale, despite having the op-tion to indicate that they did not know it. However, the negative association we observed between EDSS and HRQOL suggests that this issue had a limited effect on the results. Nevertheless, caution is needed when inter-preting the results. At the time of data collection the self-reported disability status scale (SRDSS) as a proxy measure to estimate EDSS was not yet available, how-ever such a measure may be useful for self-assessment of disability in an online questionnaire environment [44].
Another measure that we could have employed was the self-reported Patient Determined Disease Steps, although this would have limited comparisons with other studies [45].
Conclusions
Our results indicate that, till now, the effects of MS on HRQOL may have been underestimated in real-world MS patients. The combined use of both generic and disease-specific HRQOL instruments as outcome mea-sures in clinical trials and observational studies allow for a deeper understanding about specific health needs of MS patients. To enhance the comparability of cross-country data from RCTs, observational studies, or pa-tient registries it is essential to use the same instruments consequently. This study has made a first attempt to do so across Europe, however a more collective effort has to be made by all persons involved in health care research.
Abbreviations
ANOVA:Analysis of variance; CIS: Clinically isolated syndrome; DMT: Disease modifying therapy; EDSS: Expanded disability status scale;
EQ-5D-3L: EuroQOL 5 dimensions questionnaire with 3 levels; EQ-5D-5L: EuroQOL 5 dimensions questionnaire with 5 levels; FAMS: Functional Assessment of MS; HAQUAMS: Hamburg Quality of Life Questionnaire in MS; HRQOL: Health related quality of life; INF-β: Interferon beta; MCS: Mental composite score; MHCS: Mental health composite score; MS: Multiple sclerosis; MSIS-29: MS Impact Scale-29; MSQOL-54: Multiple Sclerosis Quality of Life (MSQOL)-54 instrument; MusiQoL: MS International Quality of Life questionnaire; PCS: Physical composite score; PHCS: Physical health composite score; PPMS: Primary progressive multiple sclerosis; QOL: Quality of life; RCT: Randomized controlled trial; RRMS: Relapsing-remitting multiple sclerosis; SD: Standard deviation; SF-36: Medical Outcomes Study Short Form-36; SPMS: Secondary progressive multiple sclerosis
Supplementary Information
The online version contains supplementary material available athttps://doi. org/10.1186/s13690-021-00561-z.
Additional file 1.
Acknowledgements
We acknowledge the funding this study has received from the European Union’s Horizon 2020 research and innovation program under grant agreement no. 720694.
Authors’ contributions
Conceptualization: L.A.V, W.K. R; Methodology: L.A.V, W.K. R; Investigation: L. A. V; C. L; Formal analysis and project administration: L.A. V; Supervision: W.K. R, C. A UdG; Writing original draft: L.A. V; Writing- review and editing: C. L, W.K. R, C.A. UdG. The author(s) read and approved the final manuscript.
Funding
European Union’s Horizon 2020 research and innovation program under grant agreement no. 720694. The funding sources had no involvement in the study design, the collection, analysis and interpretation of data, writing the report, or in the decision to submit the article for publication.
Availability of data and materials
The data that support the findings of this study are available on request from the corresponding author. The data are not publicly available due to privacy or ethical restrictions. The code is available on request from the corresponding author.
Declarations
Ethics approval and consent to participate
The study was approved by the Medical Ethical Testing Committee of the Erasmus Medical Centre (MEC-2018-1636).
Informed consent was obtained from all individual participants included in the study.
Consent for publication
Patients signed informed consent regarding publishing their data.
Competing interests
Disclosure of conflict of interest: Dr. Visser reports grants from European Union’s Horizon 2020 research and innovation program, during the conduct of the study; Dr. Louapre reports grants and personal fees from Biogen, personal fees from Novartis, personal fees from Merck, personal fees from Roche, personal fees from Teva, personal fees from Sanofi, outside the submitted work; Dr. Uyl-de Groot has nothing to disclose.; Dr. Redekop re-ports grants from European Union’s Horizon 2020 research and innovation program, during the conduct of the study
Author details
1Department of Health Technology Assessment, Erasmus School of Health
Policy & Management, Erasmus University Rotterdam, P.O.Box 1738/ 3000 DR, Rotterdam, The Netherlands.2ICM Institut du cerveau et de la moelle
epiniere, Sorbonne University, APHP, F-75013 Paris, France.3Department of Neurology, Sorbonne University, APHP, Paris, France.4Bayle (J) Building,
Burgemeester Oudlaan 50/ 3062, PA, Rotterdam, The Netherlands.
Received: 12 January 2021 Accepted: 11 March 2021
References
1. Lublin FD, Reingold SC, Cohen JA, Cutter GR, Sørensen PS, Thompson AJ, et al. Defining the clinical course of multiple sclerosis: the 2013 revisions. Neurology. 2014;83(3):278–86.https://doi.org/10.1212/WNL.
0000000000000560.
2. Wallin MT, Culpepper WJ, Nichols E, Bhutta ZA, Gebrehiwot TT, Hay SI, Khalil IA, Krohn KJ, Liang X, Naghavi M, Mokdad AH, Nixon MR, Reiner RC, Sartorius B, Smith M, Topor-Madry R, Werdecker A, Vos T, Feigin VL, Murray CJL. Global, regional, and national burden of multiple sclerosis 1990–2016: a systematic analysis for the global burden of disease study 2016. Lancet Neurol. 2019;18(3):269–85.https://doi.org/10.1016/S1474-4422(18)30443-5. 3. Miller A, Dishon S. Health-related quality of life in multiple sclerosis: the
impact of disability, gender and employment status. Qual Life Res. 2006; 15(2):259–71.https://doi.org/10.1007/s11136-005-0891-6.
4. Hermann BP, Vickrey B, Hays RD, Cramer J, Devinsky O, Meador K, Perrine K, Myers LW, Ellison GW. A comparison of health-related quality of life in patients with epilepsy, diabetes and multiple sclerosis. Epilepsy Res. 1996; 25(2):113–8.https://doi.org/10.1016/0920-1211(96)00024-1.
5. Rudick RA, Miller D, Clough JA, Gragg LA, Farmer RG. Quality of life in multiple sclerosis: comparison with inflammatory bowel disease and rheumatoid arthritis. Arch Neurol. 1992;49(12):1237–42.https://doi.org/10.1 001/archneur.1992.00530360035014.
6. Jongen PJ. Health-related quality of life in patients with multiple sclerosis: impact of disease-modifying drugs. CNS Drugs. 2017;31(7):585–602.https:// doi.org/10.1007/s40263-017-0444-x.
7. Flachenecker P, Buckow K, Pugliatti M, Kes VB, Battaglia MA, Boyko A, Confavreux C, Ellenberger D, Eskic D, Ford D, Friede T, Fuge J, Glaser A, Hillert J, Holloway E, Ioannidou E, Kappos L, Kasilingam E, Koch-Henriksen N, Kuhle J, Lepore V, Middleton R, Myhr KM, Orologas A, Otero S, Pitschnau-Michel D, Rienhoff O, Sastre-Garriga J, Schyns-Liharska T, Sutovic D, Thalheim C, Trojano M, Vlasov YV, Yaldizli Ö, for the EUReMS Consortium*. Multiple sclerosis registries in Europe - results of a systematic survey. Mult Scler J. 2014;20(11):1523–32.https://doi.org/10.1177/1352458514528760. 8. Benito-León J, Manuel Morales J, Rivera-Navarro J, Mitchell AJ. A review about the impact of multiple sclerosis on health-related quality of life. Disabil Rehabil. 2003;25(23):1291–303. Available from:.https://doi.org/10.1 080/09638280310001608591.
9. Ware JE, Sherbourne CD. The MOS 36-item short-form health survey (sf-36): I. conceptual framework and item selection. Med Care. 1992;30(6):473–83. https://doi.org/10.1097/00005650-199206000-00002.
10. Herdman M, Gudex C, Lloyd A, Janssen M, Kind P, Parkin D, Bonsel G, Badia X. Development and preliminary testing of the new five-level version of EQ-5D (EQ-EQ-5D-5L). Qual Life Res. 2011;20(10):1727–36.https://doi.org/10.1007/ s11136-011-9903-x.
11. Vickrey BG, Hays RD, Harooni R, Myers LW, Ellison GW. A health-related quality of life measure for multiple sclerosis. Qual Life Res. 1995;4(3):187– 206.https://doi.org/10.1007/BF02260859.
12. Facey KM. Patient involvement in health technology assessment patient involvement in health technology assessment; 2017.https://doi.org/10.1 007/978-981-10-4068-9_1.
13. Miller D, Rudick RA, Hutchinson M. Patient-centered outcomes: translating clinical efficacy into benefits on health-related quality of life. Neurology. 2010;74(Issue 17, Supplement 3):S24–35.https://doi.org/10.1212/WNL.0b013e3181dbb884. 14. Von Elm E, Altman DG, Egger M, Pocock SJ, Gøtzsche PC, Vandenbroucke
JP. The strengthening the reporting of observational studies in
epidemiology ( STROBE ) statement : guidelines for reporting observational studies. PLoS Med. 2007;4(10):1623–7.
15. Kurtzke JF. Rating neurologic impairment in multiple sclerosis: an expanded disability status scale (EDSS). Neurology. 1983;33(11):1444–52.https://doi. org/10.1212/WNL.33.11.1444.
16. Janssen MF, Pickard AS, Golicki D, Gudex C, Niewada M, Scalone L, Swinburn P, Busschbach J. Measurement properties of the 5D-5L compared to the EQ-5D-3L across eight patient groups: a multi-country study. Qual Life Res. 2013; 22(7):1717–27.https://doi.org/10.1007/s11136-012-0322-4.
17. Zorginstituut Nederland. Richtlijn voor het uitvoeren van economische evaluaties in de gezondheidszorg. Diemen; 2016.
18. Andrade LF, Ludwig K, Goni JMR, Oppe M, de Pouvourville G. A French value set for the EQ-5D-5L. Pharmacoeconomics. 2020;(0123456789) Available from.https://doi.org/10.1007/s40273-019-00876-4.
19. Versteegh MM, Vermeulen KM, A. A, Evers S, de Wit GA, Prenger RA, Stolk E. Dutch Tariff for the Five-Level Version of EQ-5D. Value Heal. 2016;19(4):343– 52. Available from:.https://doi.org/10.1016/j.jval.2016.01.003.
20. Ramos-Goñi JM, Craig BM, Oppe M, Ramallo-Fariña Y, Pinto-Prades JL, Luo N, Rivero-Arias O. Handling data quality issues to estimate the Spanish EQ-5D-5L value set using a hybrid interval regression approach. Value Heal. 2018;21(5):596–604. Available from:.https://doi.org/10.1016/j.jval.2017.10.023. 21. Van Hout B, Janssen MF, Feng YS, Kohlmann T, Busschbach J, Golicki D,
et al. Interim scoring for the EQ-5D-5L: mapping the EQ-5D-5L to EQ-5D-3L value sets. Value Heal. 2012;15:708–15.https://doi.org/10.1016/j.jval.2012.02. 008.
22. NICE. Position statement on use of the EQ-5D-5L value set for England updated October 2019: NICE technology appraisal guidance; 2019. [cited 2020 Feb 14]. Available from:https://www.nice.org.uk/about/what-we-do/ our-programmes/nice-guidance/technology-appraisal-guidance/eq-5d-5l 23. Ware JE, Kosinski M, Gandek B, Aaronson NK, Apolone G, Bech P, et al. The
factor structure of the SF-36 health survey in 10 countries: results from the IQOLA project. J Clin Epidemiol. 1998;51(11):1159–65.https://doi.org/10.101 6/S0895-4356(98)00107-3.
24. Kita M, Fox RJ, Phillips JT, Hutchinson M, Havrdova E, Sarda SP, Agarwal S, Kong J, Zhang A, Viglietta V, Sheikh SI, Seidman E, Dawson KT. Effects of BG-12 (dimethyl fumarate) on health-related quality of life in patients with relapsing-remitting multiple sclerosis: findings from the CONFIRM study. Mult Scler. 2014;20(2):253–7.https://doi.org/10.1177/1352458513507818. 25. Kappos L, Gold R, Arnold DL, Bar-Or A, Giovannoni G, Selmaj K, Sarda SP,
Agarwal S, Zhang A, Sheikh SI, Seidman E, Dawson KT. Quality of life outcomes with BG-12 (dimethyl fumarate) in patients with relapsing-remitting multiple sclerosis: the DEFINE study. Mult Scler. 2014;20(2):243–52. https://doi.org/10.1177/1352458513507817.
26. Arroyo González R, Kita M, Crayton H, Havrdova E, Margolin DH, Lake SL, Giovannoni G, on behalf of the CARE-MS I and II Investigators. Alemtuzumab improves quality-of-life outcomes compared with subcutaneous interferon beta-1a in patients with active relapsing-remitting multiple sclerosis. Mult Scler. 2017; 23(10):1367–76.https://doi.org/10.1177/1352458516677589.
27. Eriksson J, Kobelt G, Gannedahl M, Berg J. Association between disability, cognition, fatigue, EQ-5D-3L domains, and utilities estimated with different Western European value sets in patients with multiple sclerosis. Value Heal. 2019;22(2):231–8. Available from.https://doi.org/10.1016/j.jval.2018.08.002.
28. Patti F, Amato MP, Trojano M, Bastianello S, Tola MR, Picconi O, Cilia S, Cottone S, Centonze D, Gasperini C, the COGIMUS Study Group. Quality of life, depression and fatigue in mildly disabled patients with relapsing-remitting multiple sclerosis receiving subcutaneous interferon beta-1a: 3-year results from the COGIMUS (COGnitive impairment in MUltiple sclerosis) study. Mult Scler J. 2011;17(8):991–1001.https://doi.org/10.1177/1352458511401943. 29. Mokhber N, Azarpazhooh A, Orouji E, Khorram B, Modares Gharavi M, Kakhi
S, Khallaghi H, Azarpazhooh MR. Therapeutic effect of Avonex, Rebif and Betaferon on quality of life in multiple sclerosis. Psychiatry Clin Neurosci. 2015;69(10):649–57.https://doi.org/10.1111/pcn.12308.
30. Vickrey BG, Lee L, Moore F, Moriarty P. EDSS change relates to physical HRQoL while relapse occurrence relates to overall HRQoL in patients with multiple sclerosis receiving subcutaneous interferonβ-1a. Mult Scler Int. 2015;2015:1–6.https://doi.org/10.1155/2015/631989.
31. Rintala A, Häkkinen A, Paltamaa J. Ten-year follow-up of health-related quality of life among ambulatory persons with multiple sclerosis at baseline. Qual Life Res. 2016;25(12):3119–27.https://doi.org/10.1007/s11136-016-1347-x. 32. Jongen PJ, Sindic C, Carton H, Zwanikken C, Lemmens W, Borm G.
Improvement of health-related quality of life in relapsing remitting multiple sclerosis patients after 2 years of treatment with intramuscular interferon-beta-1a. J Neurol. 2010;257(4):584–9.https://doi.org/10.1007/s00415-009-5378-x. 33. Kobelt G, Thompson A, Berg J, Gannedahl M, Eriksson J. Group the MS, et al.
new insights into the burden and costs of multiple sclerosis in Europe. Mult Scler J. 2017;23(8):1123–36.https://doi.org/10.1177/1352458517694432. 34. Patti F, Pappalardo A. Quality of life in patients affected by multiple sclerosis: a
systematic review. Handb Dis Burdens Qual Life Meas. 2010;2010:3769–83. 35. Fiest KM, Greenfield J, Metz LM, Patten SB, Jetté N, Marrie RA. Discriminative
ability of quality of life measures in multiple sclerosis. Health Qual Life Outcomes. 2017;15(1):1–9.
36. Patti F, Russo P, Pappalardo A, Macchia F, Civalleri L, Paolillo A. Predictors of quality of life among patients with multiple sclerosis: an Italian cross-sectional study. J Neurol Sci. 2007;252(2):121–9.https://doi.org/10.1016/j.jns.2006.10.017. 37. Goretti B, Portaccio E, Zipoli V, Hakiki B, Siracusa G, Sorbi S, Amato MP.
Coping strategies, psychological variables and their relationship with quality of life in multiple sclerosis. Neurol Sci. 2009;30(1):15–20.https://doi.org/10.1 007/s10072-008-0009-3.
38. Miller DM, Allen R. Quality of life in multiple sclerosis: determinants, measurement, and use in clinical practice. Curr Neurol Neurosci Rep. 2010; 10(5):397–406.https://doi.org/10.1007/s11910-010-0132-4.
39. Mitchell AJ, Benito-León J, González JMM, Rivera-Navarro J. Quality of life and its assessment in multiple sclerosis: integrating physical and psychological components of wellbeing. Lancet Neurol. 2005;4(9):556–66. https://doi.org/10.1016/S1474-4422(05)70166-6.
40. Bridges JFP, Janssen EM. Discussion: Research to promote patient-based HTA. In: Facey KM, Plough Hansen H, ANV S, editors. Patient Involvement in Health Technology Assessment: Springer Nature; 2017. p. 225–31. 41. Revicki DA, Osoba D, Fairclough D, Barofsky I, Berzon R, Leidy NK, Rothman
M. Recommendations on health-related quality of life research to support labeling and promotional claims in the United States. Qual Life Res. 2000; 9(8):887–900.https://doi.org/10.1023/A:1008996223999.
42. Lebrun-Frenay C, Kobelt G, Berg J, Capsa D, Gannedahl M. New insights into the burden and costs of multiple sclerosis in Europe: Results for France. Mult Scler J. 2017;23(2_suppl):65–77.
43. Herdman M, Fox-Rushby J, Rabin R, Badia X, Selai C. Producing other language versions of the EQ-5D. In: Brooks R, Rabin R, de Charro F, editors. The measurement and valuation of health status using EQ-5D: a Europeann perspective. 1st ed. Dordrecht: Springer-Science+Business Media; 2003. p. 183–9.https://doi.org/10.1007/978-94-017-0233-1_11.
44. Kaufmann M, Salmen A, Barin L, Puhan MA, Calabrese P, Kamm CP, Gobbi C, Kuhle J, Manjaly ZM, Ajdacic-Gross V, Schafroth S, Bottignole B, Ammann S, Zecca C, D'Souza M, von Wyl V, Swiss Multiple Sclerosis Registry (SMSR). Development and validation of the self-reported disability status scale (SRDSS) to estimate EDSS-categories. Mult Scler Relat Disord. 2020;42(April): 102148.https://doi.org/10.1016/j.msard.2020.102148.
45. Learmonth YC, Motl RW, Sandroff BM, Pula JH, Cadavid D. Validation of patient determined disease steps (PDDS) scale scores in persons with multiple sclerosis. BMC Neurol. 2013;13(1).https://doi.org/10.1186/1471-2377-13-37.
Publisher’s Note
Springer Nature remains neutral with regard to jurisdictional claims in published maps and institutional affiliations.