fBir S Iss
A Comprehensive Visual Approach to Material Selection in Architecture
by Karl Daubmann BArch 1995
Roger Williams University
Submitted to the Department of Architecture
in Partial Fulfillment of the Requirements for the Degree of
Master of Science in Architecture Studies
at the Massachusetts Institute of Technology June 1999
@1999 Karl Daubmann, All rights reserved.
The author hereby grants to MIT permission to reproduce and to distribute publicly paper and electronic copies of this thesis document in whole or in part.
Signature of Author
Certified by
Accepted by
Ch
LF RAE
Karl Daubmann, Department of Architecture
May 20, 1999
Dr. Chris Luebkeman
Assis nt Professor of Building Technology
The-Su~eryisor
Roy Strickland airman, Department Committee on Graduate Students
MASSACHUSETTS INSTITUTE
OF TECHNOLOGY
AI I i Incest A Comprehensive Visual Approach to Material Selection in Architecture
Thesis Reader
Thesis Reader
William J. Mitchell Dean, School of Architecture and Planning
Anthony Sheehan Materials Scientist, Ove Arup and Partners R+D
A Comprehensive Visual Approach to Material Selection in Architecture
Karl Daubmann
Submitted to the Department of Architecture on May 20, 1999
in partial fulfillment of the requirements for the degree of
Masters of Science in Architecture Studies
ABSTRACT
The condition of information overload has become a common problem facing
con-temporary designers. This has resulted in a critical need for the development of "intelligent decision support" systems. One such system would allow a designer to visualize not only material qualities and behavior characteristics, but provide the
means to distill, organize, and select relevant data. Material databases and the enabling power of the internet can only be exploited as "information providers" for
designers when such a system is adapted. Material selection has been identified as
a means of exploring this type of analysis / assessment strategy because it is a
specific activity (within the broader realm of design) that is concerned with complex
decision making processes. The decision matrix is defined by multiple disciplines, incomplete and varied information, and an explosion in the production of materials that have dynamic properties. Emphasis must be placed on distilling and present-ing critical information in a comprehensive and accessible format.
Thesis Supervisor: Dr. Chris Luebkeman Title: Assistant Professor of Building Technology
7I IT 7/77nns
1.0 INTRODUCTION 5
2.0 SYNTHESIZING DATA 9
2.1 Traditional Data Resources 2.2 On-line Data Resources
2.3 Comparative Methods 2.4 The Diagram 3.0 TEST CASES 23 3.1 Data Acquisition 3.2 Process Responsiveness 3.3 Inclusive Strategies 3.4 New Materials 3.5 Collaborative Design 3.6 Designer Input 4.0 CONCLUSION 62
5.0 APPENDIX 1 - Presentation Boards 64
6.0 LIST OF ILLUSTRATIONS 71
7.0 BIBLIOGRAPHY 74
7.1 Analysis and Visualization 7.2 Materials
7.3 Glazing
Note: All photos and illustrations have been prepared by the author unless otherwise noted.
I0
inffire
/lenMaterials pervade our lives. We interact with them on many levels throughout our
existence. Materials are what we wear, what we touch, what protects us on a daily
basis, what shelters us where we live. The history of civilization is broken into time periods based on materials; the Bronze Age and the Iron Age. These time periods imply that it was not homo sapiens that evolved, but instead their material knowl-edge and their ability to transform this knowlknowl-edge and technology.
Civilization is at a stage where many disciplines are at a point of convergence. Biology, engineering, material science, and computing are all working in some rela-tionship to material production. The most extreme contemporary example is the newly developed organic computer chip. This convergence of disciplines has also brought about an explosion of new materials in the construction materials market-place. These materials are far more advanced in many ways than the materials that
have been traditionally utilized. This makes the materials selection process even V
more complex. The main problem creating a barrier to implementation of these new materials is that their benefits can not be easily communicated to the people
responsible for material selection and eventual application.
photo from National Air and Space Museum,
The challenge now is to find appropriate applications for the new materials and Smithsonian Institution, Washington, D.C. technologies. Design and production are at a point in history where primary
con-cerns can be implemented easily by designers. This allows them to concentrate on solutions that can be optimized for multiple design parameters and requirements. One such example is found in aviation. The daunting challenge which faced the Wright Brothers in 1903 was to create a flying machine (see fig. 1.3). At that time, this was no small task. Flying was the primary requirement. Today it has become trivial to design a "flying machine". This could be considered at best a secondary requirement, if not tertiary or less. Other issues, not remotely related to flying, have now become of primary concern. The B2 bomber (fig. 1.4) is not a plane known for its high aerial acrobatic or speed performance, rather for its invisibility to radar. Architects also have the opportunity to innovate if they respond to a similar recon-sideration of primary and secondary design priorities provided by new materials. One reason for the emergence of innovations is based on an increasing design space. The origin of construction was to provide shelter which could resist the elements. Today, it would be very rare that a client would ask an architect simply for
a building that provides shelter. Architects must understand what this increased a
new materials yield new opportunities
photo from USAF by by MSgt. Rose Reynolds
expanding design space
design space means, and how it can advance their work. "Invisible bombers" are a reality because the right materials and technologies were used in response to a
difficult requirement. The problem becomes the management of this information,
making a beneficial link between materials and applications.
The recent debate about "smart materials" has elevated the discussion of materials in the construction industry. These materials are able to sense change in the envi-ronment and change a property in response. Because these materials are still new, they are costly. And since they are costly, clients are too often reluctant to pay the premium for their use. However, by plotting their properties in a clear and concise manner, one can begin to understand that the advantages of their use outweigh the prohibitive costs.
Visualization
Graphic representation is one strategy able to relate all of the various disciplines and data types involved in the construction process. There is a history of visual representation illustrating complex information in simple and abstract terms. One example is a map of London (fig. 1.9) with dots marking deaths caused by the plague, while the crosses represent water fountains. By geographically mapping the locations in two dimensional space, one can see the distribution, and as a result formulate an understanding of the relationship between the water supply and the spread of the epidemic. The information could be described in text or numbers but would be incredibly complex. The second example is a French train schedule (fig.
1.10). At first glance it appears very complicated. By charting the arrival and
depar-ture times of trains, one can see very clearly that a steep slope on the graph means a faster train. One can also see the duration of "lay overs" at different stations. A viewer can interact with the graphic by studying it, asking specific questions of it, finding answers, revising the question, and finding more detailed answers. This example of the train schedule shows that a visual representation can not only present data, but it can organize it and make it understandable and usable.
transparency can be altered with SPD glazing (suspended particle device) photos from Research Frontiers Incorporated
historical examples of visual representation
1.9 (E.W. Gilbert, "Pioneer Maps of Health and Disease in England",
Geographical Journal, 124 (1958), 172-183.) 1.1O(E.J.Marey, La Method Graphique (Paris, 1885), p.20)
The Design Process
The first quality of design that needs to be understood is that it is a process. It changes. Design typically moves from a very broad exploration to a specific inves-tigation at a detailed level. The design space decreases as the design is refined, while the data space or information that is known about the design increases (fig.
1.11). An example of the increase of design data can be seen with the design of a
simple wall. In the beginning, the wall may be opaque or transparent. As the
pro-cess continues the wall may be glass with specific thermal and visual qualities.
Therefore, early in the process the wall can be anything, later in the process the parameters of the wall are very specific.
Architecture is a field that must confront converging disciplines on a daily basis -understanding relationships between science and the arts. One simple example is the description of sunlight. One could describe light in a quantitative way, using a chart of solar radiation values (fig. 1.12). This would very clearly describe the amount and intensity of sunlight. A more qualitative description that aims to represent the feeling of light in relationship to space and materials could be done with a painting, photograph, or rendering (fig. 1.13). This form of description would illustrate issues
of the light's color, what the light strikes, and the patterns of shadows. Both
qualita-tive and quantitaqualita-tive methods of description are necessary to convey the "entire story".
The Architect's Role
The construction process is another realm in which complexity is increasing. Orga-nizational complexity results from fragmentation created by the increased special-ization of the construction process. There are no longer craftsmen that design and build custom buildings. The craftsmen have been replaced by teams of designers, teams of builders, teams of technical consultants, there is even an increasing com-plexity in the ways that clients are representing themselves; usually with users,
fa-cilities managers, lawyers, and owners.
The architect occupies two critical positions in the strategic organization of the con-struction process. The first relationship is in building production where the client,
architect, and builder have a contract to build a building (fig. 1.14). The architect
has a responsibility to the other two parties involved and acts as a mediator and
translator throughout the process. The architect must understand the client's needs
design space / data space
3-,-AM-WM"
necessity of quantity and quality
and requirements in order to design a building. Fundamentally, the architect is translating the wishes of the client into terms with which the contractor can build. The second series of relationships is related to the design process, where the
archi-tect must put together a team of specialists that will act as consultants (fig. 1.15). In
both sets of relationships the architect 's role is to coordinate the varied activities. The architect is an interface or filter for the exchange of information from one party to the next.
This organizational analysis demonstrates the complexity involved in this exchange
of information. None of these groups speak the same language. The act of building
is a multi-disciplinary one. Figure 1.16 illustrates the intersection of the design plane, production plane, and construction plane. The arrows of the diagram (fig.
1.17) then begin to show how information is communicated from one group to the
next. These diagrams present the most generic strategic approach; as many varia-tions exist. Another level of complexity (as if there was not enough already) is that these project relationships are different from project to project. It is virtually impos-sible to find any kind of rhythm from one project to the next because the next project will be formed with a new client, new contractors, and new consultants.
The materials selection process means something different to each one of these groups. Each has its own objectives and working strategies. The role of the
archi-tect as related to material selection is to translate the different issues and resolve
them into one buildable solution.
architect as integrator
construction process and data flow
There
is a tsunami of data
the civilized world.
that is crashing
tidal
onto
wave
the beaches
of
growing data formed in bits and bytes, coming in
nized, uncontrolled, incoherent cacophony of foam.
Richard
Saul
Wurman
from Information Architectsof
unrelated,
an
unorga-This is
2
777=777/ I/=The thesis work has developed as the intersection of three areas of interest within the discipline of architecture. The first area was the way a designer thinks and makes decisions throughout the design process. The second area was the way in which information is visualized with graphic forms. And the third area of interest was the exploration of the material selection process that focused the investigation to a manageable scope.
A series of questions have been central to this investigation, and in all cases
"infor-mation" refers to specific properties of architectural materials: How do designers acquire information?
What information do designers want?
How should the information be organized and presented? How do designers organize information once they have it? How will the information be applied?
21 FIndiTi/enId,1P
s/ur
es
The following is an analysis of the traditional methods through which architects ac-quire material information. The importance of looking at these resources lies in that they contain the information that architects have been working with for many years and provide a certain level of familiarity for designers. It is also relevant to investi-gate how designers obtain material information, the amount of time it takes to carry out the task, and the amount of effort that is necessary to acquire the information, with the goal of comparing materials.
Suppliers
The most commonly used resource for acquiring information about materials is the "Sweet's Catalog" which is updated every year. This multi-volume encyclopedia of materials and products is organized according to the "CSI master format", based on different trades involved in the construction process. The entries are by supplier with a listing of all the products that they offer. Typically these entries will be the literature provided by the suppliers. Sweet's catalog provides an enormous amount of information about materials and their properties, as well as contact information for more detailed inquiries.
Another very common method used by designers to obtain detailed information about a material is directly from a supplier. This is usually done by contacting a company and interacting with a representative. The "product rep" can act as a consultant for that specific material, providing samples, more detailed information, and information related to past experiences from a completed construction project. The problem is that representatives are not always available, designers must track them down and spend valuable time trying to get relevant information.
Periodicals
Designers also acquire material information from magazines and trade journals. There are typically two ways this happens: from projects in magazines and from "technology" sections that may highlight materials or products. The first method allows designers to see completed projects where a solution from another designer may have relevance to a project. A designer can then track down the type of mate-rial or the supplier and begin investigating the viability of that matemate-rial for the project.
The technology sections of magazines focus on a type of material that is either relevant to the periodical theme or a common technical problem. The article will give background information for the material, what types of applications it has been used for, the parameters that make it special, and important aspects to think about during the design process. Usually many suppliers are included in the article to give designers freedom and options related to availability and cost. The technology sec-tions also presents some form of case study to give designers a deeper under-standing of issues related to the design problem, to issues of integration, and pos-sible problems associated with installation. The reader is also given the name of the suppliers, allowing the designer to contact them for more detailed information.
Other Designers
Designers also rely on colleagues within their firm (or outside their firm), to gain information about materials and products from past experiences. It is not uncom-mon to hear someone say, "this person just completed a project with a similar prob-lem, you should ask them how they solved it, or what material they ended up using". This type of knowledge transfer is not very innovative but is a valuable method for a designer to build upon the knowledge of someone who has dealt with a similar situation. Usually within an office there is an individual or group of people who act as specialists on technical aspects, and build on knowledge related to detailing and construction issues.
Consultants
The last method available to a designer to gain knowledge about a material or prod-uct is through a consultant. This could be a consultant that specializes in materials or one that has information about materials associated with their discipline. This type of material knowledge acquisition depends on the size and scope of the project, obviously smaller projects will not have a budget that allows for specialized material consultants. Usually if such a material consultant is needed for a project it is be-cause there is a problem, and the consultant is brought in to fix the problem. Had the consultant been involved in the project from the beginning, the problem may have been avoided completely. The ideal situation would allow the consultant to provide input during the design phases, allowing the designer and consultant to collaborate and build on one another's experience.
2/.7-n / Ie
Web-based Information
In order for designers to innovate, they must be able to access up-to-date
informa-tion. One aspect of the research was to uncover the methods that are available for designers to access this type of material information. It became clear early in the project that this is not an easy task. There are two major categories of products or materials related to the construction industry, those commercially available and those under research and development. For the thesis it was decided to focus on com-mercially available materials with the understanding that the information would be more relevant to the issues that architects would be most concerned.
The exploration into web-based resources is founded on the belief that the web, because of its foundation as an information provider, has the potential to change the ways in which architects work. In order for this to occur the web needs to present advantages over the traditional methods through which architects acquire informa-tion. The two obvious benefits are that web information is easier to update than catalogs or other paper sources and that the information is already in a digital format allowing for manipulation and incorporation into drawings or specifications. The following pages present a number of web-based databases that are available to designers. The databases were analyzed to uncover any common patterns that may have been developed for presenting information and to develop and under-standing of how to organize and navigate what could amount to 20,000 materials. Note: the images that are used to present the databases are screen captures of the on-line databases and are labelled as "ss" for screen-shots. They have been taken from the webpages listed at the top of the page.
Material Connexion Database http://www.materialconnexion.com
audience: architects, designers
The Material Connexion is a gallery / materials showroom that connects designers with material suppliers. They concentrate on the physical and qualitative aspects of materials by allowing designers to see and touch material samples in a showroom setting.
The screen-shots illustrate the navigation of their web database. The first screen breaks materials into predetermined major headings with subcategories. In this case, "panels" was selected under the "glass and ceramics" category. The result of this selection is seen in ss2.2. It is a list of product numbers, manufacturers, and product names. The materials can be found in the Material Connexion bin system using the product number. Selecting the "arque block decora pattern" brings the user to ss2.3 which displays supplier contact info, a photo, and a description. Un-fortunately the description is very basic. In this instance, the material properties are stated as: rigid, translucent, decorative, smooth, recyclable, dimensionally stable, and waterproof. Clearly, if a designer is really concerned about the performance of the material, this database does not offer any significant level of technical informa-tion.
ss2.1 - view of the materials category search page
Sweet's System On-line http //www.sweets. com/index.htm
audience: construction industry
The interface developed for accessing information from Sweet's On-line is based
on the CSI masterformat. The "search page" contains a list of the sixteen divisions
of the format (see ss2.4). Selecting "Division 8 - Doors and Windows" brings the
user to the next screen (ss2.5). The user is presented with a list of different sec-tions within Division 8. Selecting "8300 specialty doors" (as one option) takes the user to ss2.6 which displays manufacturers with various products that fall under the
8300 heading. By selecting "single glazed windows" produced by Baut Studios, the
user is taken to a page that presents information about the specific product; the company, size availability of the various series of windows, and in many instances, photos of the product.
The main drawback of this type of interface is that it is application and product driven. This database works well for a designer in the detail design, but does not aid the designer in the concept stages of a project. The navigation is linear and straight-forward since it is designed to get the user to a specific bit of information in the
shortest amount of time, without giving the user options along the way.
.1. ... ... -.
a" ,e -s en cf s a ma i m s s
liR
Mr, 44444 44,.4,4
444, 4444 .44. 444.4 4..44444
ss2.4 - view of the materials category search page
4Id.44.:d44d4i4hONV4P.4,
f444 .444,,r 44,444 4s 4
44444.444,4444.4444.444 44
Q44UAL4n 44 444I4o.44JW. M. t
44 .'ui4y 4' i t 4.
ss2.5 - list of returned materials from search
w~i - a Wes dowsaU
uwMi
444444i44S.,d4:limb 44444 -4,4l44 r44.4A4 . im444.4a.li444.44-4ii44 444,l444444h44444 4444.44 m44 l444 !44 utan44.444S. ,.4i.4 44 ad44.44~u4em4il tur 4 mt 4444,,i m 4 ,.4m .4Th. Gad SgW Glad Wndow Sysms TM WMJT s7UIos, Ilnc, Eesiastical cralsmn
1095 hlYe Wq0 1.*,26444
eu<l (' ?) M
44e " 444oul44 G Whidew tys.f.4
4 4141A4U4440
Su4t k" 74 4 4
4 4 r 0g .,gllo , .
ne 4 C T4 4 fye.4 r -4 s I g onf 4. g, e N o I WA a
. Dml wehesdsin & run al eimtr
.Gises head arrangements for various glaring thicknesses.,444444444.44444..44.44444,44.44.,. .44444
.44Custom shape 44s , *'4a4stres 44
ss2.7 - view of a detailed information page
Design inSite http://www.designinsite.dk
audience: industrial designers
This is one of the more interesting web-based databases for material related infor-mation for designers. It takes as its premise that designers need to meander or browse through information that is of interest to them. Out of this understanding an interconnected database has been created that links three main headings: materi-als, products, and processes.
The example presented on this page begins with the front page of the database where a user can select material, product, or process. Selecting product takes the user to the ss2.9 which lists the products that have been compiled. Selecting for example, "car bonnet" (hood of automobile) takes the user to ss2.10. This page contains a photo, a brief description of why it has been included (what makes it innovative), and links to the related materials and processes. From this page a user can find more information about how it is actually produced or how it makes use of
specific materials.
ss2.8 - view of the materials category search page
iranuswArtnet owemtd ac
9 you ar just browIng try fth ragrlom
ss2.10 - view of a detailed information page
This page continues the exploration of the Design inSite database. By selecting "materials" from the front webpage, the user is taken to ss2.11. This page lists the types of materials included in the database categorized by basic headings. By selecting "smart materials" the user is taken to ss2.12 which gives a description of
what smart materials are, and list more specific smart materials. By selecting
"poly-mer gels" the user is taken to ss2.13. The "poly"poly-mer gel" page describes what a gel is, what it does, how it is made, and some of its applications. The page has links to
similar products, other websites that contain more specific information as well as
producers of polymer gels.
This material database is one of the more interesting examples studied because it
is not a completely linear navigation but allows designers to browse through a very rich amount of information in an intuitive fashion. By creating links between materi-als, processes, and products designers can see the relationships that can come
from an understanding of all three categories. ss2.11 - view of the materials category search page
'Sad* nweas respond to Polymer gets consi a ra oss ankea
*s2.1 -i lis of returned products s2idettd inorao p
d" n mmlt a tha Mv.entMc n w* . la o (4the
04pndngonChng I S e oosntpol , 15l1cSi,5 EVIt".~kM
d" ~fWfti Popoil"LgM~dI ~C nl. adin~5
tontins 2 houn or dr) . ~ 'Ay
Metal Suppliers Online http://www.suppliersonline.com
audience: engineers
This is an example of a web database available to designers which has very de-tailed information on material properties and behavior. The first page has a listing of
basic types of metals, in this case, selecting "stainless steel" takes the user to ss2.14. This page has very specific grades of stainless steel. Selecting "Nitronic 40" leads the user to the ss2.16. This page shows specifics of the material such as:
machin-ability, forming, welding, heat treatment, hot working, cold working, physical data,
and mechanical data. Although this example has very specific data as well as a
clear interface, there is no ability to compare one material to another or browse
horizontally within the database. The user must go back to the top level and select a different material. There is also no way to select the materials based on their properties, selection is only by the names. Architects are rarely familiar with this
technical level of material details.
$top1- ChooseFamIly ----.. ...
FZ
i
sr
l
j
'V!ew'v no W n
ss2.14 - view of the initial search page
Step 2 - h" W
ma~tleto is
ss2.15 - view of a secondary page with groups of materials that fall under the most general category
ss2.16 - view of a detailed information page for Nitronic 40 stainless steel
Ch... i.l.y .B...
'esig te~~ rAa egsr W msi i ~ ~ ~ ~ ~ ~ ~ ~~ e at*:eglee l e4 Fee;Mr Ce
2.3
_
cem!/wp
le /,I
11f
llMd
The analysis of available data resources for architects showed that accessing data is not a problem. Access to data however, does not mean that the data was pre-sented in a usable format. The problem became how to transform data into knowl-edge. The research thus focused on the need to provide a means to compare materials. Only when the information is comparable can various options be studied in relationship to one another for specific applications.
In order to achieve comparative methods, a strategy is needed that addresses: which items should be compared, objectives for the comparison, parameters of comparison, and a clear criteria for comparison. A well known selection method for materials within the field of mechanical engineering is the Ashby charts from the book Material Selection in Mechanical Design by M.F. Ashby. This material charting technique was investigated to uncover any strategies that may be useful for the comparison of materials within the field of architecture.
The Ashby Charts
The conceptual foundation for the Ashby charts (fig. 2.3.1) is that materials have
discrete properties, meaning that one type of material has very different
character-istics from another type of material. For example, the modulus of elasticity for steel
is 21OGPa, while copper's is 120GPa. The Ashby charts are constructed using two
axes diagrams that plot one property against another. Building on the idea that materials have discrete properties, relationships between materials also have dis-crete values. Continuing the example with steel and copper, the densities are 7.9
Mg/m3 and 8.6 Mg/m3 respectively. The plot of modulus against density (E 1/2 / p)
will produce distinct groupings of materials. These groupings (fig. 2.3.2) are com-posed of classes of materials such as polymers or metals. Within these classes are sub-ranges within which minor families of materials are plotted. Property enclo-sures can be plotted around the various materials within a class represented by the
darker lines.
The Ashby charts attempt to plot all materials, from the lightest and flimsiest to the
stiffest and heaviest. This can be achieved due to the wide ranges of the two axes of the chart through the use of a logarithmic scale. The charts do not attempt to
pinpoint the values for a material but instead present an acceptable value range for a material. The charts attempt to provided designers with a broad range of opportu-nities as they are a guide for the performance of all materials available to a designer.
U 00 Q10 0 Zc POYAS c 0M 14 To0 DENSITY p (Mg/rn')
Ashby chart illustrating material classes
2.3.1 (diagram from Material Selection in Mechanical Design p.25)
DENSITY, P (Mg/rm3)
Ashby chart plotting modulus and density
2.3.2 (diagram from Material Selection in Mechanical Design p.28) 2.3.2
Ashby defines design as being composed of two aspects: primary constraints which 14.MODULUS-RELATIVE COST
are imposed by external factors to the problem and the ability to maximize perfor-mance. The first aspect is seen as nonnegotiable because these are the factors that define the design problem. Examples of the first aspect could be the
environ-ment in which a design must be placed or the budget for the project. However the 100
designer has complete control over the second aspect of design through decisions
about how best to solve the design problem. There is rarely only one solution to a F P
2
CL
maximizing performance. The charts (fig. 2.3.3) are created to aid a designer in the 0
optimization process related to material selection by plotting lines at values speci-fied by the designer on both axes. These lines begin cutting off options, in essence narrowing the acceptable field of materials. The opportunity exists to plot multiple
constraints to minimize the number of materials. This reduced list of materials is o A I ___
-POLYM4ERS seen as an initial subset of materials that a designer may begin implementing for a
design.
While the Ashby charts present "all" materials within a single chart, all the perfor- z mance aspects of the material cannot be presented in a single chart. In order for a
designer to grasp a comprehensive understanding of a material, they would need to
look at a number of the Ashby charts. The method is a truly comparative one in that materials are studied against one another on each chart, but the method is re-stricted to the chart's two properties. The task of comparing two materials on a more comprehensive scale would be an extremely difficult task, but it is a task that
needs to be undertaken for architectural projects. The charts do aid a designer in 0
the very early stages of the design process by helping to make the initial selection of 0.1 1
options, unfortunately this graphic method becomes difficult to implement through- RELATIVE COST PER UNIT VOLUME CRp (Mg/rn)
out the entire design process. Ashby chart with lines designating designer's specifications
Now that the various types of material resources for architects have been explored and it has been shown that material data is plentiful but not completely usable, a strategy for selecting and comparing materials both comprehensively and visually will be presented as a response to the conditions and needs in the construction industry. This research evolved from work initially begun with the Ove Arup Re-search and Development (ARD) Materials Group in the summer of 1998. The open ended task at the time was to brainstorm ways that smart materials would be more readily introduced and subsequently accepted into the culture of the construction industry. From daily meetings with the smart materials expert Tony Sheehan, three
objectives became more and more evident:
Select materials according to multiple performance parameters
This is necessary due to all the restrictions placed on a material by the various parties involved in the construction process.
Illustrate how advantages outweigh the economics
The benefits of a material need to be obvious since the
they are not currently used is based on cost. main reason that
Visualize the dynamic behavior of materials
Data needs to become more understandable to designers through an emphasis on visual communication.
The goal of creating a material selection strategy for architects and designers was to extend the concept of performance based design into the realm of materials. Performance based design is the idea that design decisions are based on the over-all performance of a building or system. The designer uses this criteria or perfor-mance goal as a reference point in the optimization process, fine tuning the design to achieve the desired results. In applying this concept to materials, the material's property behavior becomes the criteria with which to judge its performance. The first step in the research was the investigation of the properties that a designer would be interested in when making a design decision [see list to the right]. A
realization was quickly made that drivers in the material selection process depend on who will be making the decision, after all the act of building is a multidisciplinary
endeavor. Designers are important but they are not the only people involved in the
economics cnutv nrytas-iso
initial cost c ne tv n ryta s iso
,fe cycle cost
expected life a o si
appearance
weatheringeniomta
chemical resistanceem oid nig color range rccal
texturfe !noa
porosity
architectural esy
geometry vegl
user requiremnents tegr cultural u tlt
dlimrensionstfn s
optical a fonainpeito
reflectance snkg transparency otrem v en direct light transmissionth r aex nso diffused light transmission
ultraviolet light transmission c n tu to
visible liaht transmission c ntu tblt infared light transmissioncofdnei s
fire behaviorpateernc
flame spread3rpatceifaio
smoke generation sft
struictural collapse h at
flamabilityUn etitofp fria c
thermnal cs/ieo eeom n U-valuelib it solar heat transmission aalblt radiant energy transmission invto
thermconvectie e nergyr transmlisso
creation of a built project. Clients, builders, designers, and consultants all play
critical roles in the decision making process. Thus, the problem became more
complex, how to compare different materials using multiple parameters, based on different and often conflicting criteria? The image of a conference table kept resur-facing, members of a project team gathered around collectively making decisions.
The analogy of the conference table (fig. 2.4.2) was transformed into an organizing concept for the understanding of the material selection
strategy. The placement around a table was used as a method for organizing the diverse properties that had been collected as exerting
an influence on material selection. The roles within the design /
con-struction process - client, architect, consultant, and builder -
trans-lated into four material property lobes which organized parameters according to economics, appearance, performance, and constructibility.
The simple organization for the graphic representation of material data was then tested through a number of scenarios and iterations. The first test of the material selection strategy was used for a lecture at the "Smart Materials and Adaptive Tech-nologies Conference" at the Architectural Association in December 1998. The chart was used to compare traditional and new materials for glazing, structure and fa-cades. The research received positive feedback from many of the practitioners and
theoreticians currently working in the realm of materials.
It could almost be called the conspiracy
material, with its unequivocal, yet never
conference table diagram as the organizational basis for the diagram
of the detail, or
openly expressed
tus. Despite their incredible importance, it seems impossible to
discuss these aspects of architecture openly; they represent those
shameful
'facts
-Caroline Bos
from Van Berkel & Bos ArchitecturecLeUi
the
exhibition board from Smart Materials and Adaptive technologies Conference
NEW MATERI ALS
a visual desi gn proce ss
4
a joint project by:
ARUP
R+D &MIT
Tony Sheehan, Ove Arup & Partners R+D, LONDONKarl Daubmann, Massachusetts Institute of Technology, House n4
VW110This chapter presents a number of visual representation strategies. They have been developed to test the concepts of the thesis in response to the abundance of problems experienced in the presentation of information to designers during the material selection process. The strategies are presented as individual case stud-ies. Each major heading has one or more examples of a material selection diagram in use. These studies were developed through a series of iterations that resolved the particular issues that were critical at a specific point in the material selection process. The overall research is complex and multilayered (fig. 3.0.1). The case studies are devised to present this complexity in the most understandable and clear manner.
Each case study follows a similar structure (fig. 3.0.2). Each begins with an intro-duction that has been developed as a response to the general issues presented in the beginning of the visualization strategy. This introduction is followed by an ex-ample that employed this material selection process. The case studies are illus-trated by examples that discuss the concept behind the strategy, the process of the development, and the logistics of the data operations. A conclusion is included for the discussion of points related specifically to the issues raised. Each case study also contains a section that discusses future work that could be undertaken to build upon this research.
new mnaterials
inclusive strateg
ies
data rnatrix
THE DIAGRAM
complexity associated with comprehensive nature of the diagram
As a starting point in this discussion about the visual navigation of a materials data-base, it is necessary to track the evolution of thoughts regarding the data matrix. The development of the ideas presented in this chapter are related to the acquisi-tion of data and the resultant organizaacquisi-tion of that data. These factors greatly influ-ence the ability to navigate and visualize material properties and behavior.
Data Acquisition
Before it was possible to explore the material selection process, it was necessary to create a small but comprehensive database. The creation of this database was
understood also as an opportunity to also investigate the methods with which archi-tects gain material knowledge. The first assumption of the actual process of data acquisition was that one week should be an acceptable amount of time to build up a small, but comprehensive database related to glass. This one week block of time was to simulate a similar task that one might be assigned in an office environment. Glass was selected as a material to focus the research because of its level of com-plexity and many new innovations in the industry. Products had been identified for this work; types of glass, coatings, fillings, and films. All of the products would have to be represented by a comprehensive range of physical properties and behavior
specifications. Three months after the project began the database was only 40%
complete with no hope of it ever becoming a full matrix in the foreseeable future. The gaps in the data resulted from the time required to interact with product repre-sentatives and search for or obtain comprehensive data from manufacturers. Data found on the web is typically very general and information from manufacturers is usually very product, not material, specific. Usually manufacturers will only adver-tise the information that makes their product different from other products, or supe-rior to other products, as opposed to a comprehensive listing of its composition. After this exercise in data acquisition it became clear that the material selection process was necessary, but that it needed to be robust enough to deal with incom-plete information.
Further complication of data acquisition stemmed from the fragmentation and com-plexity of manufacturers and researchers (fig. 3.1.1). There is no one source that contains all the information a designer would want to have. From an interview with James Carpenter, a practitioner whose work constantly attempts to push the bound-aries of glass technology, the creation of a comprehensive glass database would be
demic institutions around the world that focus on only very specific aspects of glass. One institute will be the center for films, while another will focus on coatings. The information is then typically disseminated with papers or conference proceedings, the data never finding its way into a database, let alone a singular comprehensive database. Although data related to materials is growing daily, it is not accessible to designers in an easy to find or easy to compare format. This knowledge pointed to yet another reason that such a material selection system would be a needed addi-tion to the tools of designers.
Variations in Standards
One of the most interesting aspects of this research was that it uncovered unfore-seen variations in the types of standards for material property data. Discrepancies were discovered that related to units, types of testing, the results of these tests, as well as the ways the information was presented. According to Kaufman from a conference related to Materials Property Data, "Fundamental to the ability to net-work a variety of material property data sources is standardization of nomenclature, property names, definitions, and units among database builders and users, and standardization in the way data are input for subsequent searching and
presenta-tion... Similarly, the use of uniform or at least compatible database management
systems will greatly enhance the ability to link and interactively search many data sources."
The next page (fig. 3.1.2) contains information available from the websites of Pilkington and Pittsburgh Plate Glass, two of the major glass producers for the construction industry. In comparing the two, it is instantly clear that they do not conform to any standard, either in terms of layout or the types of information that are included. Pilkington presents mostly optically related data, while PPG's information
is more broad with issues of mechanical properties, optical properties, and thermal
properties. Designers trying to compare the two products must first translate the information in an attempt to understand what values are compatible, then go about
a comparison. One possible solution to this problem of incompatible information is
the creation of data standards that codify how the information is to be presented. From the Materials Property Data conference, Northrup presented the need for "metadata" - data about data, "which would be a formal schema of data elements, together with associated controls on nomenclature, terms, measurement units". The metadata for the MIST project which served as a prototype for materials databases, formalized data entries and their relationships, linkages, individual data element
information from two different glass manufacturers, note lack of graphic and informational consistency
Pilkington data available from website
Monolithic Glass Performance Data [1/4" Monolithic Float Glass]
Nominal Visible Light Total Solar Energy UV U-Value European Solar Shading
Glass Trans- Reflect- Trans- Reflect- Trans- U-Value Heat Gain
Coeffi-Thickness mittance ance mittance ance mittance Summer Winter (K-Value) Coeffi- cient
Product in mm % % % % % Air Argon Air Argon Air Argon dent
Arctic Blue Eclipse 1/4 6 25 43 20 29 5 1.1 1.1 5.8 0.34 0.40
#1)
Arctic Blue Eclipse 1/4 6 25 19 20 11 5 1.1 1.1 5.8 0.40 0.46
(#2)
Pittsburg Plate Glass (PPG) data available from website
MECHANICAL PROPERTIES OPTICAL PROPERTIES THERMAL PROPERTIES
HARDNESS (NOTE: OPTICAL PROPERTIES PROVIDED FOR
A MOH'S SCALE(SCRATCH CONTROL THICKNESS OF .223 IN.) 18 TO 66C) 0.84
HARDNESS): DIAMOND, 10 2 EXPANSION COEFFICIENT (LINEAR IN THE
SAPPHIRE. 9: ETC APPROXIMATELY 1 COLOR DEEPENS AS THICKNESS RANGE 25 TO 300 DEGREES CELSIUS)
6 INCREASES
B KNOOP HARDNESS NUMBER 2. REFRACTIVE INDEX MEASURED AT
(INDENTATION HARDNESS) SODIUM "D" LINE. 1 5184
INDENTER LOAD 500 GRAMS 470 3 CIE ILLUMINATE "C" DAA PER DETAEEF 4 8X 1
2 POISSON'S RATIO. 0 22
3 DENSITY 156 LB/CF or 2 5 G/CCM CHROMATICITY COORDINATES 3 SPECIFIC HEAT (AT 32-212 DEGREES F 0
4 MODULUS OF ELASTICITY (YOUNG'S) 0.308 Y 0. 31
10,600,000 PSI or 73 1 GPA 100 DEGREES C) 0205
5 TENSILE STRENGTH (DETERMINED AS LIMINOUS TRANSMITTANCE. 89% 4 THERMAL CONDUCTIVITY (K) AT 120-F (49
MODULUS OF RUPTURE, ULTIMATE) 6,000 C) MEASIED FOR A THICKNESS OF
LB/SQ IN 41.4 MPA DOMINANT WAVELENGTH. 500 NMO
6 SPECiFIC GRAVITY AT 70F (21*C) 2.5 FOOT O PER . 65
7 WEIGHT EXCITATION PURITY: 0.7%
SWATT PER SQUARE METER PER DEGREE
4 RADANF ENERGY TPAM98BANCE K(KELVIN) 369
PER SQAEFO ~ o ERSUR EE (U i-'AVIOLET W'N-VELELILF'-H IN
s 1~~~~0$ ~~NANOMETERS) , 5~ PXT13Fr2~
6. ANNEALING POINT 101 I or 544*C
2 EXPASIO
7 STRAIN POINT 3F9F or 504(C
S~WAELNGTWVEENT
TRSR7C ANG 25AN TO 300DEGEESCELIUS
~2A~t3 0M 73~ 5
V A 14 11K 4
P D 4
PPG AzurlIte Float Glass
characteristics, nomenclature, and units of measure and conversion. These five
meta categories would make information from various sources comparable, allow-ing designers to make decisions without havallow-ing to invest valuable time on data
assessment.
Example 1 - Incomplete Data / Grey Data Impact on the Diagram
An important innovation related to the data matrix was the notion that the completed matrix of data is an unrealizable condition. Thus, a designer must be ready and able to work with an incomplete set of data. Since this is the present situation, it can only be improved upon. However, this reality also raises the issue of grey data - a term presented by Olsson from "Computer-Aided Materials Selection". Grey data is data that is assumed or inferred and is not taken to be exact. It is data that has been
inserted as a "place holder". Grey data represented on the diagram must be clearly flagged allowing the designer to understand its un-validated nature.
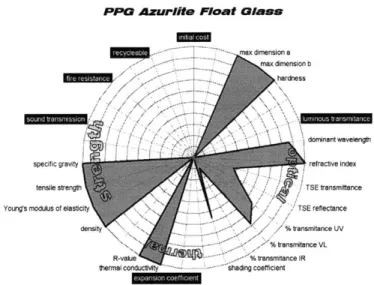
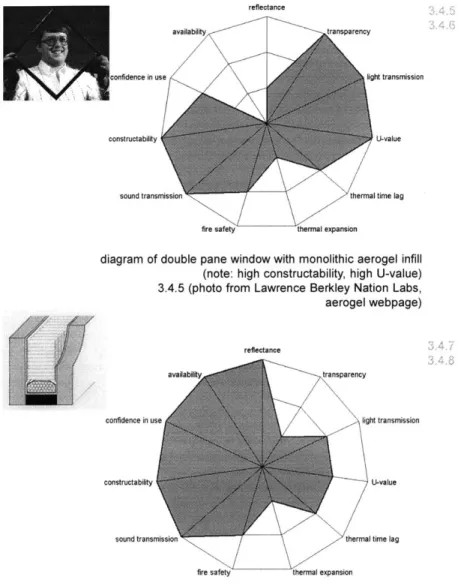
The diagrams at the right demonstrate a couple of possible examples of how to flag grey data. The charts are from the detailed investigation of PPG glass types. The chart on the top highlights properties where data is not available. The designer then has the option to leave the data as it is, or fill in the gaps with values based on experience. The chart below shows how this grey data may be represented by broken lines, making it clear that the value is different from the accepted values in the database.
max dimension a max dimension b
hardness
dorrinant wavelengt
specific gravity refractive index tensile strength TSE transmittance Young's modulus of elasticity TSE reflectance
density % transmitance UV
.... % transmitance VL R-value transmitance IR
thermal conductivity - shading coefficient
highlighted properties that do not have values within the data matrix
PPG Azurlite Float Glass
sound transmission
specific gravity tensile strength Young's modulus of elasticity
max dimension a max dimension b hardness \ luminous transmitance dominant wavelength refractive index
diagram with grey data values input as a "best guess" scenario, importance placed on representing the difference between the two types of values
Example 2 - Data Ranges
A common misunderstanding is that engineering is an exact science due to the
importance placed on quantifying information. It was with this understanding that the material selection system was initiated with an emphasis placed on exact num-bers for the database. It was then discovered to not be entirely necessary because values are typically doubled through the use of a safety factor. No designer wants to push a material to its ultimate limits; if the conditions change the material will be sure to fail. The emphasis then shifted to providing ranges of data ,as opposed to
exact numbers, that still allow designers to arrive at values.
Tony Sheehan from Arup R+D, indicates that an exact value is not necessary in many cases for construction. From his experience as a materials consultant within Arup R+D, builders often do not need to know the exact price for a material but would rather know the maximum price that it could be. If they are given an exact figure and the prices rise, problems will occur. If they are given a maximum price and the price ends up being cheaper, no one will complain when the construction
comes in under budget. All of the parameters of materials work in a
simi-lar critical framework, a general range of values (as opposed to exact values) are sufficient to make decisions.
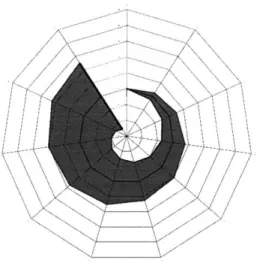
The diagram to the right (fig. 3.1.5) is from the general glass analysis that compared major types of glass. Lead glass is a good example when discussing ranges of values because the production process and chemical composition can have dra-matic effects on the performance of the glass resulting in a wide range of values for lead glass. Density for lead glass varies between 3.03 to 6.22 g/cm.
LEAD GLASS
specific heat
density - thermal conductivity
Young's modulus, /thermal expansion
strain point . ... ... .. annealing point
acid durability softening point
water durability refractive index
weather durability
property profile plotted for lead glass illustrating the ranges of values possible within the material family
Conclusions
The major focus of the research was considered to be the representation of data related to materials in construction. It did not take long to realize that problems with data acquisition, lack of standardization, and data organization have profound ef-fects on how a database could be navigated and how the information could be represented. This area of the research has been explored by a number of research initiatives but they do not appear to have had an influence on the way information is presented by material suppliers. Presently, the responsibility and time taken to com-pare the various types of information falls within the realm of the designer. The goal is to liberate this needless comparison period, allowing the designer to deal with more important issues relating to design.
Future Work
The acquisition of data is a topic that needs to be investigated more specifically. One of the most interesting approaches that was discussed is that web agents (web software designed to retrieve specific information) could go out and locate specific data on the web and bring it back to the database. This type of method could also keep the database up to date, an important issue in an environment where new materials are created almost daily.
A second topic for future work related to building up the database is to have each
material supplier create a web node with the specifications for their product. This type of organization creates a networked database, where information is not stored
in one central location but is kept by various parties that are responsible for the
information. The incentive with this organization is to force suppliers to supply infor-mation if they want designers to specify their products. In order to address the issue of mismatched information, the creator of the overall database needs to set stan-dards. The suppliers can use the set up but maintain their own information - assur-ing that the information is kept up to date. This type of configuration also addresses the issue of legal responsibility by placing the burden of information accuracy upon the supplier.
3.2/ I IS // a7
Defining the Material Selection Process
Before it is possible to devise a process responsive material selection system, it is necessary to understand the process itself. The material selection process is not something that is commonly understood in the realm of architectural design. Most designers understand it as simply choosing a material. So, the first step in this process is to define what is meant by the phrase "material selection process". This
is then followed by an exploration of the parameters which effect it. Once the
pro-cess is clarified it must then be mapped back onto the architectural design propro-cess, grounding the material selection process within the commonly accepted context.
In the development of this definition for a material selection process in architecture it was necessary to explore other disciplines which have a clear understanding of
the material selection process. Mechanical engineering proved to be the discipline most helpful in creating this definition because of the emphasis placed on the rela-tionship between materials and production. Much research is done in an attempt to make sure the correct material is used for the correct application. Materials must be carefully selected since serious repercussions will be experienced if problems occur after production.
A commonly accepted model of the material selection process in mechanical
engi-neering consists of five steps: exploratory study, technical study, primary design, production design, and feedback (fig. 3.2.1). Exploratory study is the period spent defining the problem and creating design objectives. For example, "materials for this application need to be very thin but also must have high insulating values". This very general definition of the design problem will lead to a broad range of possible materials. The technical study period is spent revising the designer's specifications and the design objectives. This revision leads to a narrowing of material families that may be applicable. Primary design places the material options in the possible design environments, investigating the entire life cycle of the product - from produc-tion to destrucproduc-tion. At this point in the process the material data must also be evalu-ated in terms of its relevance and especially its reliability. Production design ex-plores the performance of one favorite material and a couple of alternatives in terms of production time, cost and dimensions. The feedback period builds on input from failure analysis and customer reaction based initially on a built prototype and finally on the produced product. [Olsson, 1980]
links created between mechanical engineering model of material selection and the architectural phases of the design process
The practice of architecture does not place as much importance on materials as mechanical engineering, but the phases of architectural design are similar: con-ceptual design, schematic design, detail design, construction, and feedback. In architecture a break commonly occurs between design and construction, which ac-companies the shift of responsibilities from the designer to the contractor.
Now that the framework has been set for the design / production process the
mate-rial selection process can explored in more detail (fig. 3.2.2). The design phase [conceptual, schematic and detail] is seen as the realm of the designer which ends with a set of documents being given to the constructor. The material selection process in this time frame is seen as an assessment of material options concluding with the specification of a material (fig. 3.2.3). At this point the builder refines the design and is able to propose alternates of "equal" quality. This creates a condition
of further review of materials ending with the installation of the material. The last aspect related specifically to materials - repair - usually occurs when something
goes wrong which provides a certain level of feedback for designers. By under-standing this process, the material selection diagram can respond to the various
needs and become useful throughout the stages.
Two iterations can be identified in the architectural material selection process; de-sign and construction. The dede-sign iteration begins by investigating all materials in general terms and concludes with the selection of one material after having studied multiple properties associated with it. This design selection is used as a benchmark
for the builder. It allows for the proposal of appropriate alternates of equal quality.
The second iteration occurs when the alternatives must be reviewed by the de-signer and client. In this second iteration the selection process compares a small number of materials in great detail, to insure that the alternate materials will perform as well as the original design material. Often compromises are made when one
aspect may not be as good, but another parameter may be more suitable - for
example, the material may not perform as well but is available sooner.
detail of discipline change from design [architect] to construction [builder]
assess
a) _0
refine
specifics of the material selection process mapped onto the phases of architectural design
Swimming in the Matrix
The main difficulty in the creation of a material database and visualization strategy
for the construction industry is that it needs to be accessible to a wide variety of
people whose needs and knowledge are at a number of levels. Because the
pro-cess has such a varied amount of activities, the data must be responsive to these
variations. Two scenarios exist: the first is using the database for the duration of the material selection process; the second is accessing the database at a very detailed level in the material selection process. A three dimensional matrix is the best way to
visualize the way both scenarios can be served.
One can conceive of the organization of the data matrix as a "swimming pool". One can swim in a horizontal plane, exploring and comparing materials at similar levels
of detail. By moving vertically the levels of detail either increase (by diving deeper)
or simplify (by swimming to the surface). With these in mind the organization of the material data has two axes, diversity and specificity (fig. 3.2.4). The diversity of the database must exist so that it contains enough materials to compare. In addition to containing enough materials to choose from, there must also exist a high degree of
specificity. Once a material is selected, detailed information about performance
and behavior become critical to the design. A swimmer may want to begin the search in the center of the matrix and then move to a simpler level only if found necessary. This could occur if a designer wants to use the database to investigate alternatives proposed by a builder during the refine / review stage of the project. The importance of organizing the data in this matrix format is that it allows for jumps in the specificity of the data. This aspect is necessary because without it, the data-base would need to contain all the data about a material, including data that may never be used. For example, light transmission of concrete would need to be in-cluded so that it could be compared with glass. But with the utilization of the matrix organization there is a level where glass and concrete can be compared - but on a general level. In moving to a more specific level, types of glass can be compared thus permitting the data to become more specific and relevant to glazing.
relationships created by the model of the data matrix as a method of organizing material information
Mapping onto the Process
The mechanical engineering model of material selection can be illustrated quite clearly by plotting materials against properties (fig. 3.2.5). This shows the material selection process moving from a condition of many materials and minimal proper-ties to a condition of few materials concerned with many properproper-ties. The architec-tural material selection process is a bit more complex (fig. 3.2.6). The curve is
broken at the point when a contractor can propose alternates for construction. There is a redundancy built into this scenario where the designer must select a material and then may have to also study alternate options for that part of the project.
It is important to locate this investigation on the material / property curve to under-stand the relationships that are influential in the material selection process. This research begins at the central point on the curve because this is where a compara-tive strategy is the most appropriate (fig. 3.2.7). The top end of the curve can be characterized as so intuitive and broad that it does not necessarily need to be visu-alized. Most decisions at this level are made based on experience and the designer's intent. The opposite end of the curve is very specific and moves into the realm of prototype testing and simulation strategies. Here the study becomes very specific to the project. Issues related to geometry, orientation, and compatibility cannot be answered by a database but only through physical testing. Movement from this central starting point can be extended in either direction. To extend the chart's
applicability upward, more materials and general data must be added to the matrix - in essence increasing the diversity. The data matrix must be increased in an
outward direction. To make this research more applicable lower on the material /
property curve the data must become more detailed, adding depth to the data ma-trix.
comparison of mechanical engineering model of material selection process [left] and architectural model [right]