Publisher’s version / Version de l'éditeur:
Vous avez des questions? Nous pouvons vous aider. Pour communiquer directement avec un auteur, consultez la première page de la revue dans laquelle son article a été publié afin de trouver ses coordonnées. Si vous n’arrivez pas à les repérer, communiquez avec nous à [email protected].
Questions? Contact the NRC Publications Archive team at
[email protected]. If you wish to email the authors directly, please see the first page of the publication for their contact information.
https://publications-cnrc.canada.ca/fra/droits
L’accès à ce site Web et l’utilisation de son contenu sont assujettis aux conditions présentées dans le site
LISEZ CES CONDITIONS ATTENTIVEMENT AVANT D’UTILISER CE SITE WEB.
Student Report; no. SR-2011-09, 2011-08
READ THESE TERMS AND CONDITIONS CAREFULLY BEFORE USING THIS WEBSITE.
https://nrc-publications.canada.ca/eng/copyright
NRC Publications Archive Record / Notice des Archives des publications du CNRC :
https://nrc-publications.canada.ca/eng/view/object/?id=e3ce00d3-8f21-49c6-a016-749dfb485078 https://publications-cnrc.canada.ca/fra/voir/objet/?id=e3ce00d3-8f21-49c6-a016-749dfb485078
NRC Publications Archive
Archives des publications du CNRC
For the publisher’s version, please access the DOI link below./ Pour consulter la version de l’éditeur, utilisez le lien DOI ci-dessous.
https://doi.org/10.4224/19507518
Access and use of this website and the material on it are subject to the Terms and Conditions set forth at Comparison testing of multiple inertial measurement units
DOCUMENTATION PAGE
REPORT NUMBER
SR-2011-09
NRC REPORT NUMBER DATE
August 2011
REPORT SECURITY CLASSIFICATION
Unclassified
DISTRIBUTION
Unlimited
TITLE
COMPARISON TESTING OF MULTIPLE INERTIAL MEASUREMENT UNITS
AUTHOR (S)
Scott Holmes
CORPORATE AUTHOR (S)/PERFORMING AGENCY (S)
Institute for Ocean Technology, National Research Council, St. John’s, NL
PUBLICATION
SPONSORING AGENCY(S)
IOT PROJECT NUMBER NRC FILE NUMBER
KEY WORDS
Inertial measurement unit, IMU, side-by-side comparison, pendulum apparatus, rate-of-turn table, data acquisition system, accelerometer, gyroscope, inertial sensor.
PAGES iv, 24, App. A-E FIGS. 14 TABLES 19 SUMMARY
Inertial measurement units (IMUs) are used extensively at the NRC-IOT for ship model testing and research experiments. In many cases, selection of the correct IMU is key to the success of the experiment. Unmanned underwater vehicle (UUV) designers, such as Marine Robotics Inc., face a similar challenge of selecting an appropriate IMU for their specific application. As a result, the NRC-IOT has commissioned a study of the performance of several IMUs that will provide side-by-side comparison data to assist instrumentation engineers and designers in the IMU selection process. The study consists of four main parts: design of a test apparatus, development of a data acquisition system, simultaneous IMU testing, and data analysis. Each part of the study is addressed in a separate section of this report, however the main focus of this work is on the physical IMU tests performed between May and August 2011 at the NRC-IOT. The IMU tests feature side-by-side testing of a Crossbow, MicroStrain, MotionPak-II, PHINS, Watson, and Xsens IMU. The report documents the equipment, test configurations, and procedures used to perform the IMU tests and presents some initial test results along with discussion and conclusions. Complete test logs are also included in this report to assist with the data analysis phase of the study.
ADDRESS National Research Council
Institute for Ocean Technology Arctic Avenue, P. O. Box 12093 St. John's, NL A1B 3T5
National Research Council Conseil national de recherches Canada Canada Institute for Ocean Institut des technologies Technology océaniques
COMPARISON TESTING OF MULTIPLE INERTIAL
MEASUREMENT UNITS
SR-2011-09
Scott Holmes August 2011
ABSTRACT
Inertial measurement units (IMUs) are used extensively at the NRC-IOT for ship model testing and research experiments. In many cases, selection of the correct IMU is key to the success of the experiment. Unmanned underwater vehicle (UUV) designers, such as Marine Robotics Inc., face a similar challenge of selecting an appropriate IMU for their specific application. As a result, the NRC-IOT has commissioned a study of the performance of several IMUs that will provide side-by-side comparison data to assist instrumentation engineers and designers in the IMU selection process. The study consists of four main parts: design of a test apparatus, development of a data acquisition system, simultaneous IMU testing, and data analysis. Each part of the study is addressed in a separate section of this report, however the main focus of this work is on the physical IMU tests performed between May and August 2011 at the NRC-IOT. The IMU tests feature side-by-side testing of a Crossbow, MicroStrain, MotionPak-II, PHINS, Watson, and Xsens IMU. The report documents the equipment, test configurations, and
procedures used to perform the IMU tests and presents some initial test results along with discussion and conclusions. Complete test logs are also included in this report to assist with the data analysis phase of the study.
TABLE OF CONTENTS
ABSTRACT... i
LIST OF TABLES... iii
LIST OF FIGURES ... iv
1.0 INTRODUCTION ...1
1.1 Inertial Measurement Units...1
1.2 Performance Comparison...2
1.3 Purpose...5
1.4 Comparison Project Outline...5
2.0 PART 1: TEST APPARATUS ...6
2.1 Design Description...6
2.2 Calibration of the ADTs...8
3.0 PART 2: DATA ACQUISITION SYSTEM...10
3.1 DataLogger ...10
3.2 Data Acquisition Setup ...10
3.3 Troubleshooting and Debugging...11
3.4 DAS Information ...11
4.0 PART 3: IMU TESTS...12
4.1 Test Configurations...12
4.1.1 Bench Test ...13
4.1.2 Pendulum Test ...14
4.1.3 Rotary Table Test...15
4.1.4 Cart Test...16 4.2 Test Equipment ...17 4.3 Instrumentation Setup ...18 4.4 Coordinate System ...19 4.5 Test Procedures...20 4.6 Test Results...20 4.6.1 Data Set A ...20 4.6.2 Data Set B ...20
5.0 PART 4: DATA ANALYSIS ...21
5.1 Goals for Data Analysis ...21
5.2 Preparation of the Data ...21
5.2.1 Conversion ...22
5.2.2 Time Synchronization...22
6.0 DISCUSSION ...22
6.1 Sources of Error ...22
6.2 “Black Box” Comparison ...23
7.0 CONCLUSION...24
8.0 RECOMMENDATIONS...24
9.0 REFERENCES ...24
APPENDIX A – PENDULUM APPARATUS SPECIFICATIONS ... A-1 APPENDIX B – DAS INFORMATION ...B-1 APPENDIX C – ADT CALIBRATION...C-1 APPENDIX D – TEST LOG: DATA SET A... D-1 APPENDIX E – TEST LOG: DATA SET B...E-1 LIST OF TABLES Table 1: List of IMUs by Price ... 3
Table 2: IMU Output Signals... 3
Table 3: ADT Calibration Equations ... 9
Table 4: Data Acquisition Parameters ... 10
Table 5: Signal Output Format ... 11
Table 6: DAS Summary... 11
Table 7: Test configuration output... 13
Table 8: Equipment List... 17
Table 9: IMU Platform... 18
Table 10: Orientation of IMUs Relative to Platform ... 19
Table 11: Data Set B MATLAB files ... 21 Table 12: Pendulum Apparatus Specifications – Data Set A ... A-1 Table 13: Pendulum Apparatus Specifications – Data Set B... A-1 Table 14: Global Variables and Corresponding Sensor Output... B-1 Table 15: Sensor Output Sorted by Variable ... B-2 Table 16: Output Units – ADTs and Rotary Table ... B-3 Table 17: Output Units - IMUs... B-4 Table 18: Test Matrix for Data Set A ... D-1 Table 19: Test Matrix for Data Set B...E-1
LIST OF FIGURES
Figure 1: Triaxial sensors within a typical IMU... 1
Figure 2: IMUs for comparison ... 2
Figure 3: Marine Robotics SQX-500 UUV ... 4
Figure 4: Model of the pendulum apparatus ... 7
Figure 5: Dual-axis pivot assembly and ADTs... 8
Figure 6: ADT calibration plot ... 9
Figure 7: IMU platform setup ... 13
Figure 8: Bench test configuration... 14
Figure 9: Static pendulum tests... 14
Figure 10: Dynamic pendulum test (sway)... 15
Figure 11: Rotary table configuration... 15
Figure 12: Cart test configuration ... 16
Figure 13: IMU Location ... 18
COMPARISON TESTING OF MULTIPLE INERTIAL MEASUREMENT UNITS
1.0 INTRODUCTION
This report documents the progress of a research project involving side-by-side comparison testing of multiple inertial measurement units (IMUs) at the Institute for Ocean Technology of the National Research Council Canada (NRC-IOT).
1.1 Inertial Measurement Units
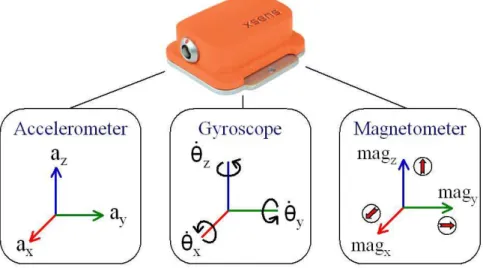
In general, an inertial measurement unit (IMU) is a device that is mounted to a rigid body for the purpose of measuring the motions of the body. As shown in Figure 1 below, a typical IMU consists of a set of three orthogonal accelerometers and a set of three orthogonal rate gyroscopes. The combination of these six sensors allows the IMU to measure motion in all six degrees-of-freedom: the accelerometers measure x, y, and z linear accelerations and the rate gyroscopes measure angular velocities about the same x, y, and z axes. Some IMUs also incorporate a triaxial magnetometer and a temperature sensor to stabilize the signals from the accelerometers and gyroscopes and to compensate for changes in the surroundings. The raw signals from the accelerometers, gyroscopes, magnetometers, and other sensors are usually processed within the IMU by an internal microprocessor. Depending on the complexity of the IMU, the
microprocessor may provide a coordinate transform, integrate and filter these signals to output information about the orientation, acceleration, velocity, and displacement of the body in motion. For example, most IMUs can provide a three degree-of-freedom attitude reference by calculating the three Euler angles (roll, pitch, and yaw) from the gyroscope signals (Shea, 2011).
Figure 1: Triaxial sensors within a typical IMU
Inertial measurement units are versatile and have many uses: with applications in land, sea and air technology. IMUs are commonly used in attitude and heading reference systems (AHRS), Navigation Aiding GPS, camera/sonar image reconstruction, robotics, vehicle instrumentation, industrial control systems, bore technology, and engineering research.
1.2 Performance Comparison
Due to the versatility of the IMU as a measurement device and the multitude of IMU applications, there are many different IMUs available on the market. The NRC-IOT owns several IMUs for use in research experiments. These IMUs may be attached to scale models of ships, offshore structures, and underwater vehicles to measure the motions that occur during testing in the NRC-IOT’s tow tanks and wave basins. In these types of tests, IMU data can be used to track the movement of the test model and measure accelerations which are necessary to calculate the forces encountered by the model during testing. As a result, the IMU is an essential tool for quantifying the performance of test models, and choice of an appropriate IMU for a given test is key to the success of the experiment.
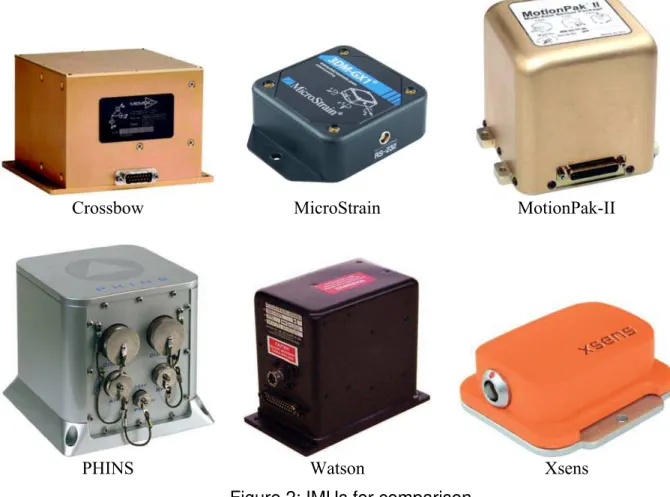
Figure 2 shows each of the IMUs to be considered in the performance comparison. A total of six IMUs are available for side-by-side comparison: a Crossbow, MicroStrain, MotionPak-II, and a PHINS unit owned by the NRC-IOT; a Watson unit owned by Memorial University, and an Xsens unit owned by Marine Robotics Inc.
Crossbow MicroStrain MotionPak-II
PHINS Watson Xsens Figure 2: IMUs for comparison
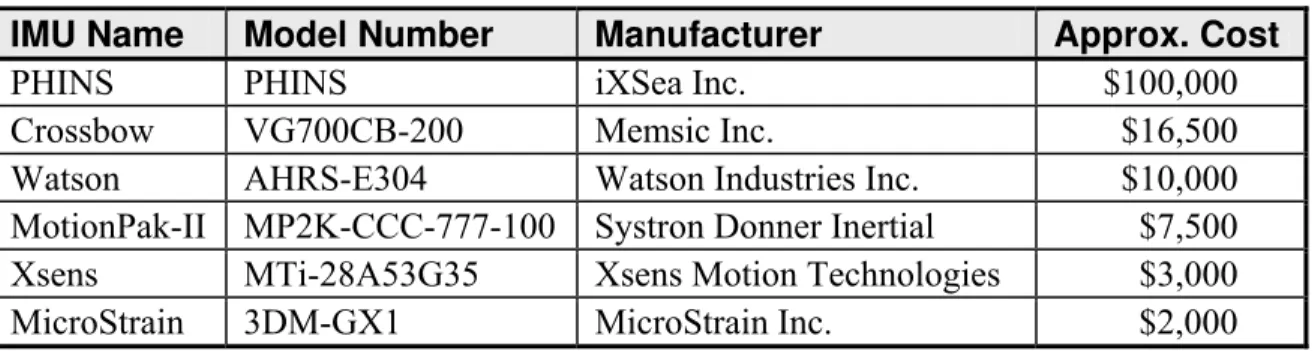
These sensors vary in cost from $2000 to $100,000 and also vary in size, capability, and quality. Table 1 provides a list of the IMUs by manufacturer, model, and cost.
Table 1: List of IMUs by Price
IMU Name Model Number Manufacturer Approx. Cost
PHINS PHINS iXSea Inc. $100,000
Crossbow VG700CB-200 Memsic Inc. $16,500
Watson AHRS-E304 Watson Industries Inc. $10,000 MotionPak-II MP2K-CCC-777-100 Systron Donner Inertial $7,500 Xsens MTi-28A53G35 Xsens Motion Technologies $3,000 MicroStrain 3DM-GX1 MicroStrain Inc. $2,000
Table 2 indicates the output signals available from each IMU. Each of the units outputs
accelerometer and gyroscope data in all three coordinate axes, however not all of these devices utilize magnetometers or output secondary data such as Euler angles, displacement, or velocity.
Table 2: IMU Output Signals
Crossbow MicroStrain MotionPak-II PHINS Watson Xsens
Accelerometer (X) Accelerometer (Y) Accelerometer (Z) Gyroscope (roll) Gyroscope (pitch) Gyroscope (yaw) Magnetometer (X) Magnetometer (Y) Magnetometer (Z)
Euler Angle (roll)
Euler Angle (pitch)
Euler Angle (yaw)
Displacement (Z)
Velocity (X)
For a given application, size and budget constraints can narrow the field of suitable IMUs to choose from, however it can be challenging to select the most economical sensor that still
provides the necessary level of data quality. Comparison of IMUs based on published data sheets can be misleading and inconclusive, and test data are rarely provided by IMU manufacturers, adding to the difficulty of selecting the best IMU for a specific purpose. This is a problem faced
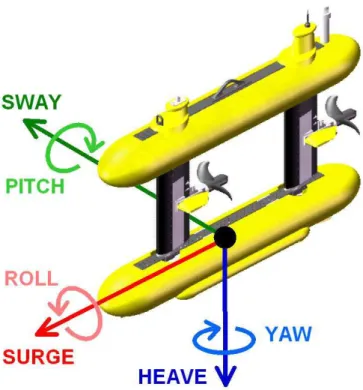
by instrumentation engineers at NRC-IOT as well as many unmanned underwater vehicle (UUV) designers outside of the NRC-IOT, such as Marine Robotics Inc. (MRI). Figure 3 shows the SQX-500 UUV that is currently under development by MRI.
Figure 3: Marine Robotics SQX-500 UUV
Autonomous underwater vehicles (AUVs) often use an IMU to measure the motion of the vehicle as it performs an underwater mission, shown by the arrows in Figure 3. Accurate knowledge of the vehicle’s motion is essential for successful self-guidance of an autonomous vehicle. While the UUV is submerged, the IMU also plays a key part of the on-board navigation system, since a satellite-based GPS navigation sensor is only useful at the ocean surface. The IMU is also useful to estimate vehicle speed during portions of a mission when the UUV is too far from the seabed to use a Doppler velocity log (DVL) to measure speed over ground.
Furthermore, by inferring the dynamic attitude of the vehicle as it moves, the IMU can be used to correct measurements made by directional sensors such as altimeters, ice profilers, and obstacle avoidance sonar. In a similar fashion, recorded IMU data can be used to accurately reconstruct camera and sonar images captured during surveillance and tracking missions. (Shea, 2011). In UUV applications, the decision criteria for a suitable IMU is usually size, weight, power consumption, relative precision, accuracy, cost and availability. UUV designers looking to implement an IMU into their vehicle design have a tendency to simply purchase the most sophisticated and expensive sensor that fits within the project’s budget. In some cases, a lower cost sensor may provide sufficient data quality and may potentially offer other benefits such as reduced size and weight, and, reduced power consumption.
1.3 Purpose
A comparison test of several commonly used IMUs will provide a useful set of data to inform the decision of researchers and engineers looking to select a suitable IMU for their respective
applications. The study was commissioned to provide side-by-side comparative data that quantify the relative performance of the sensors listed in Table 1.
The following points describe the main objectives of the study:
• Assess the relative performance of several different IMUs under identical test conditions • Simulate real-world forces and motions on the sensors in a controlled lab experiment • Provide side-by-side comparative data for each of the sensors
• Quantify the performance of the sensors
• Offer researchers and engineers conclusive data to inform their decision in the sensor selection process
The scope of the project is described by the following points: • The project compares six of the IMUs
• The IMUs range in price from $2000 to $100,000
• Test conditions are limited to those that would be experienced by the SQX-500 UUV or an NRC-IOT scale model
4 second period of oscillation for rotations Up to 2 m/s linear velocity
Between 10 deg/s and 90 deg/s yaw rate
• Testing and analysis consider all sensor output signals shown in Table 2
1.4 Comparison Project Outline
The IMU study project carried out at the NRC-IOT can be divided into four parts: 1) Test apparatus
2) Data acquisition system 3) Testing
4) Data Analysis
Part 1 involves the design and construction of a test apparatus that is large enough to support all of the test sensors and is able to apply repeatable forces and motions that simulate those which would be experienced by an NRC-IOT test model or an underwater vehicle. This portion of the study was carried out between September 2010 and December 2010 by NRC-IOT work term student T. House. Information pertaining to this portion of the study is briefly given in Section 2 of this report and is detailed in NRC-IOT Student Report SR-2010-25 by T. House, see the references.
Part 2 involves the design and implementation of a data acquisition system (DAS) capable of recording data from each of the test sensors simultaneously. This DAS was initially programmed for five of the six sensors listed in Table 1, and was later programmed for the Crossbow unit, allowing all six sensors to be recorded at one time. This portion of the study was carried out between January 2011 and April 2011 by NRC-IOT work term student M. Chaulk. Section 3 of this report provides background details to this portion of the project and full details are given in NRC-IOT Student Report SR-2011-06 by M. Chaulk, see the references.
Part 3 of the IMU comparison involves the development of an IMU test plan and physically conducting experiments using the apparatus and data acquisition system developed in Parts 1 and 2 of the project. The third portion of the study was carried out between May 2011 and August 2011 by NRC-IOT work term student S. Holmes. Part 3 of the project is the focus of this report, with details given in Section 4 and discussion and conclusions given in later sections.
Lastly, Part 4 of the IMU comparison involves analysis of the data collected in Part 3 of the study. This includes preparation of the data, side-by-side data comparison, and ultimately the presentation of a conclusive set of performance data . This portion of the study is currently underway at NRC-IOT, likely to be completed between September 2011 and December 2011.
2.0 PART 1: TEST APPARATUS
At the time of inception of the IMU test project, a testing platform that could excite the IMUs in six degrees-of-freedom was not available at the NRC-IOT. So to conduct the comparison tests, a test apparatus first had to be designed and fabricated, or a commercially available product had to be purchased. In order to test all of the IMUs simultaneously, the test apparatus needed a
mounting platform large enough to accommodate all of the IMUs at the same time. Furthermore, the platform had to be actuated to produce repeatable periodic motion that could be accurately measured and recorded for comparison against the IMU output. To minimize the cost and complexity of the apparatus, the concept of a simple two degree-of-freedom pendulum was selected to be designed and constructed in-house at the NRC-IOT.
2.1 Design Description
The concept of a pendulum apparatus was determined to be the most simple and cost-effective means of testing all of the IMUs simultaneously. A pendulum design would produce near-sinusoidal acceleration and rotation in up to two axes simultaneously, exciting the internal accelerometers in surge and sway and the rate gyroscopes in roll and pitch. A rate-of-turn table available at the NRC-IOT could be utilized in a separate set of experiments to produce rotation in the third axis to measure the yaw response of each unit.
The following list of specifications was produced for the design (House, 2010):
• The apparatus must be a free standing structure with a three or four legged collapsible frame with feet for stability
• The pendulum arm must be 4 m in length, giving the pendulum a period of approximately 4 seconds
• The pendulum arm must be able to swing about two independent, orthogonal axes • The pendulum arm must be able to produce a minimum of ten cycles, or swings, before
motion decays significantly
• Control and measurement of these motions must proceed independently and when combined, simultaneously
• The motion of the pendulum arm must be recorded independently on each axis by an angular displacement transducer (ADT), to track the position of the arm
• There must be a platform mounted to the end of the pendulum arm that is large enough to accommodate all of the IMUs, a power source, data acquisition system, and other
equipment required for the experiments
• Utilize off-the-shelf components and in-stock materials where possible
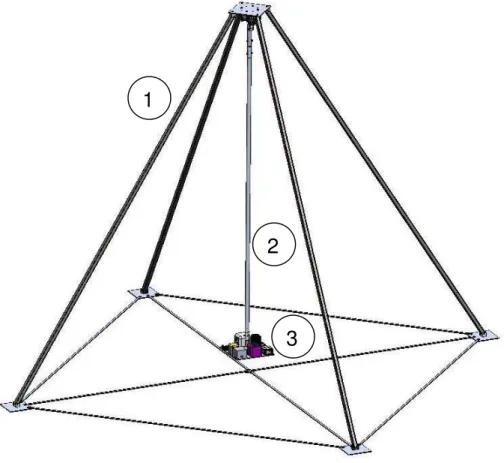
The mechanical design of the pendulum apparatus was commissioned at the NRC-IOT and a SolidWorks model of the apparatus was produced as shown in Figure 4 below.
Figure 4: Model of the pendulum apparatus
3
1
The apparatus design is composed of three main sections, labelled in Figure 4 (House, 2010): 1) Free-standing frame structure
2) Two degree-of-freedom pendulum arm and ADTs 3) Mounting platform for the IMUs and test equipment
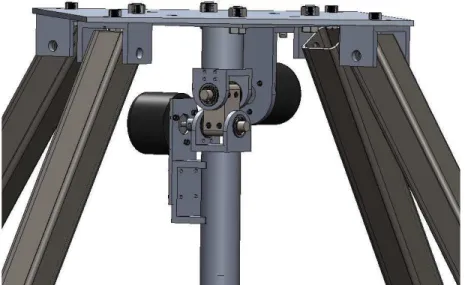
The length of the pendulum arm is based upon the natural frequencies and periods of motion which typically occur during scale-model tests of surface-ship models and AUVs at the NRC-IOT. The period of oscillation of the pendulum arm is designed to coincide with the natural roll and pitch period of the Marine Robotics SQX-500 UUV, although the length of the pendulum arm can be shortened to suit higher frequencies if necessary. A list of pendulum apparatus specifications is given in Appendix A. The angular displacement of the pendulum is measured in the two orthogonal planes by a separate angular displacement transducer (ADT) mounted on each of the individual axes of rotation. The axes of rotation are provided by a specially designed universal joint from which the pendulum arm is suspended. The two ADTs, shown in Figure 5 below, record the reference signals that describe the actual angle of swing of the pendulum arm. The IMU output that most closely matches the reference signal of the ADTs would be considered to show the best performance in an AUV or ship model application.
Figure 5: Dual-axis pivot assembly and ADTs
2.2 Calibration of the ADTs
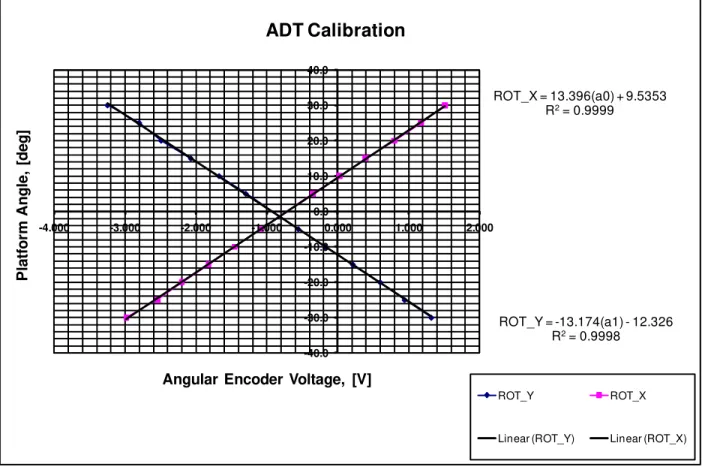
The ADTs are analog measurement devices that convert the angular displacement of the ADT shaft into a voltage output. In order to know the angular displacement of the ADTs in units of degrees, a calibration was performed to relate the ADT output voltage to degrees of angular displacement. To achieve this, the pendulum arm was set to known angles between +30 degrees and -30 degrees on both of the x and y coordinate axes and the ADT voltages recorded. A PRO 3600 digital protractor was used to set the angle of the pendulum platform within ±0.1 degrees.
An Elenco digital multimeter was used to measure the ADT output voltages within ±0.001 volts. The data collected during the calibration test are shown in Appendix C. The platform was said to be at zero degrees of angular displacement when it is hanging vertically. This zero position is referred to later in the report as the origin. Because the ADTs were not installed so that they would read zero volts while the pendulum is at the origin, each ADT records a non-zero voltage while the platform is at zero degrees of displacement. Figure 6 shows the calibration plot generated during ADT calibration.
ROT_Y = -13.174(a1) - 12.326 R2= 0.9998 ROT_X = 13.396(a0) + 9.5353 R2= 0.9999 -40.0 -30.0 -20.0 -10.0 0.0 10.0 20.0 30.0 40.0 -4.000 -3.000 -2.000 -1.000 0.000 1.000 2.000 P lat for m A ngl e , [deg]
Angular Encoder Voltage, [V] ADT Calibration
ROT_Y ROT_X
Linear (ROT_Y) Linear (ROT_X)
Figure 6: ADT calibration plot
By plotting the platform angle versus ADT output voltage, an equation can be developed to convert from volts to degrees. These two equations are summarized in Table 3 below.
Table 3: ADT Calibration Equations Desired Measurement
(degrees)
ADT Output Signal
(V) Equation
Angular displacement about the x-axis
(ROT_X) a0 ROT_X = 13.396(a0) + 9.5353
Angular displacement about the y-axis
3.0 PART 2: DATA ACQUISITION SYSTEM
The data acquisition system is intended to collect all of the sensor outputs simultaneously and record the output for analysis. Initially, individual MATLAB scripts were compiled to acquire data from each sensor separately. However, running a separate script for each sensor caused issues with time synchronization of data samples. Also, differences in sample rate and the
unnecessarily large data storage requirement from this data acquisition method made it necessary to upgrade the DAS software. The NRC-IOT commissioned the design and implementation of a new DAS software that would be lightweight, extensible, provide real-time data formatting, and capable of accurate relative time synchronization between sensor data.
3.1 DataLogger
The DataLogger program developed by M. Chaulk is Java-based software that uses a single executable program rather than one separate executable for each IMU being tested. Data are collected from the IMUs, formatted to a common standard format, and logged in
comma-separated-value (CSV) ASCII files for easy importation into MATLAB for signal processing and data analysis. DataLogger makes use of the nanosecond clock within the on-board 2.66 GHz Intel Core 2 Duo CPU to provide a relative timescale on all IMU measurements that has greater accuracy and less drift than Windows time. (Chaulk, 2011)
3.2 Data Acquisition Setup
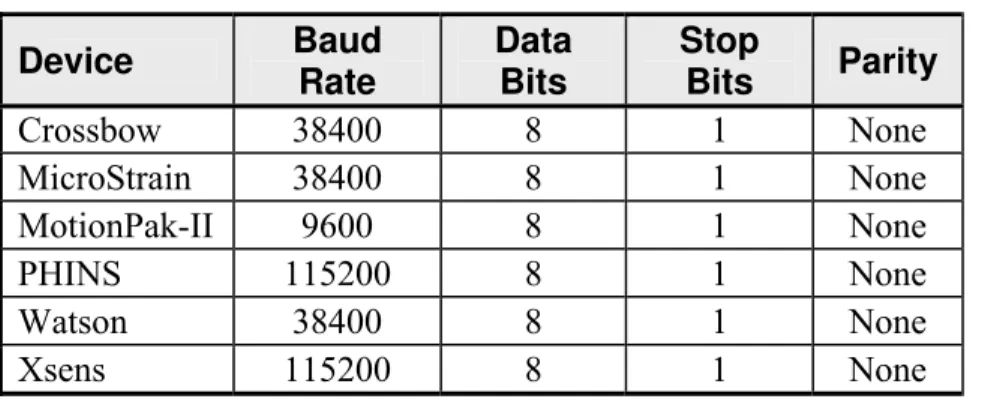
IMU data are read from RS-232 serial ports connected to the IMU platform PC and recorded with the DataLogger program. ADT data are read from the analog channels of a National Instruments USB DAQ and recorded with software complied from MATLAB code called niusb6211.exe. Before running the DataLogger program, a data folder must be created, if necessary, and designated for each of the data files to be recorded. The directory path and filename for each IMU data file is entered into the input.txt file in the DataLogger folder on the IMU platform PC before DataLogger is launched. DataLogger will now create ASCII data files for each IMU in the designated directory(s) with the filenames specified. The following
parameters are also entered into the input.txt file, shown in Table 4 below.
Table 4: Data Acquisition Parameters
Device Baud Rate Data Bits Stop Bits Parity Crossbow 38400 8 1 None MicroStrain 38400 8 1 None MotionPak-II 9600 8 1 None PHINS 115200 8 1 None Watson 38400 8 1 None Xsens 115200 8 1 None
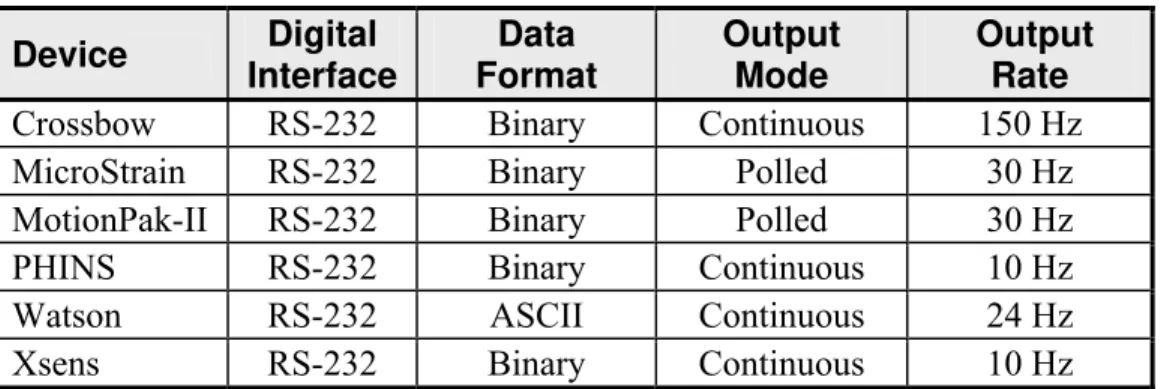
Each sensor recorded during an experiment either provides data continuously at a fixed synchronous output rate, or must be polled by DataLogger at a rate of 30 Hz. Details of the signal output format of each of the IMUs is given in Table 5 below. DataLogger converts all binary IMU output into ASCII format.
Table 5: Signal Output Format Device Digital Interface Data Format Output Mode Output Rate
Crossbow RS-232 Binary Continuous 150 Hz
MicroStrain RS-232 Binary Polled 30 Hz MotionPak-II RS-232 Binary Polled 30 Hz
PHINS RS-232 Binary Continuous 10 Hz
Watson RS-232 ASCII Continuous 24 Hz
Xsens RS-232 Binary Continuous 10 Hz
3.3 Troubleshooting and Debugging
Before IMU testing could commence, several troubleshooting and debugging tests were necessary to ensure proper function of the DataLogger program. Initially, the PHINS, Watson, Xsens, MotionPak-II, and MicroStrain sensors were mounted on the IMU platform and tested on the pendulum. These tests involved swinging the pendulum along the East-West axis and then along the North-South axis to obtain a set of output signals from the IMUs. The data sets for each signal was then manually imported into MATLAB and plotted on the computer screen. Each plot was checked for obvious errors such as bias offsets, irregular patterns and missing data. As a result of these tests, it was discovered that the Watson unit was not being recorded properly by DataLogger. Subsequent debugging and troubleshooting tests determined that when the Watson unit is rotated beyond a certain limit, it flags the data to indicate over-banking. This flagged data were not being recorded by DataLogger. Additional programming and debugging resolved this issue. Further details can be found under “DataLogger Verification Tests” and “DataLogger Troubleshooting Tests” in Appendix D.
3.4 DAS Information
Data from the IMU tests are collected using two different data acquisition systems. One DAS is used to record the analog reference signal from the ADTs on the pendulum apparatus, and the other DAS is used to record the digital output from each of the IMUs. Both systems store data and run their executable from the IMU platform PC. Table 6 summarizes the two DAS systems. Table 6: DAS Summary
DAS 1 DAS 2
Recorded devices ADTs IMUs
Input port NI USB DAQ analog input RS-232 digital input
Software niusb6211.exe DataLogger
When an IMU or ADT is excited, it outputs a data stream that represents a continuous sequence of output variables such as roll, pitch and yaw, in the case of an IMU. As data is collected from an IMU or an ADT during an IMU test, the DAS software sequentially converts and formats each value in the sensor output data stream into an ASCII character string that represents a real number with physical units. Each ASCII string corresponds to the data value of an output variable. These data values are stored in a text (*.txt) file as comma-separated values. In a text (*.txt) data file, the DAS software writes the first row of characters as a header row, which is a list of each of the output variable names in sequence. The subsequent rows of data are the actual ASCII values for each output variable, following in a sequence corresponding to the header row. Table 14 and Table 15 in Appendix B list the variables, the sequential number, and the
corresponding sensor output name for each IMU.
For the ADTs, the analog output is recorded directly in units of volts. The calibration equations in Table 3 can be used in post processing to convert these voltages into degrees of angular displacement from the pendulum apparatus origin. Table 16 in Appendix B gives the units associated with the ADTs and the rotary table. For IMU output, the type of units used for a particular output variable depends on particular IMU specifications. This information can be found in the product manual from the IMU manufacturer. A complete list of units for the output variables of each IMU is given in Table 17 in Appendix B.
4.0 PART 3: IMU TESTS
IMU tests consist of planned experiments with the IMUs mounted to the IMU test platform for the purpose of performance comparison. The IMU tests were conducted in two main data sets: Data Set A and Data Set B. The first data set to be collected, Data Set A, involves a series of IMU tests with the MicroStrain, MotionPak-II, PHINS, Watson, and Xsens units mounted together on the test platform. Data Set A was collected between May 31 and June 23, 2011 at NRC-IOT. Data Set B involves a series of IMU tests similar to those performed in Data Set A, using the same five IMUs mounted in the same positions and orientations on the IMU test
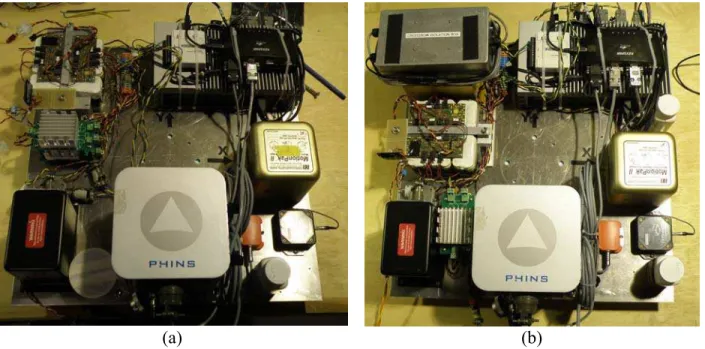
platform. In addition, the Crossbow unit is mounted on the test platform to make for a total of six IMUs in the data set. Data Set B was collected between July 25 and August 23, 2011 at NRC. The setup of the IMU test platform for Data Set A is shown in the top view in Figure 7a on the next page. Figure 7b shows a top view of the IMU test platform setup for Data Set B. The setup of the IMU platform was not changed in any way during each of the periods that the data sets were collected.
4.1 Test Configurations
The purpose of the IMU tests is to equally subject each of the test IMUs to conditions that dynamically excite all of the internal sensors in a fashion that repeatably, predictably, and measurably simulates real world applications. As a result, different test configurations are
required to sufficiently examine all of the desired sensor outputs and performance characteristics. Table 7 on the next page shows the specific outputs of interest targeted by each of the test
configurations: translational acceleration in the x, y and z directions; angular velocity about the x, y and z axes; and roll, pitch and yaw angular positions.
(a) (b) Figure 7: IMU platform setup
In Table 7, “S” denotes that a static output signal is the best repeatable output that can be acquired using a given configuration, whereas “D” denotes that a dynamic output signal can be repeatably attained. A dynamic signal for each output of interest can be attained exclusively using pendulum tests and rotary table tests. These two test configurations are the most important for data analysis because consistent reference values are attainable.
Table 7: Test configuration output
Test Config. accx accy accz gyrx gyry gyrz roll pitch yaw
Bench test S S S S S S S S S
Pendulum test D D D D D S D D S
Rotary table test S S S S S D S S D
Cart test D D S S S D S S D
4.1.1 Bench Test
Bench tests are performed with the IMU platform on the workbench of the NRC-IOT AUV lab. These tests are not accurately tracked with reference measurements. As a result, bench tests are primarily for qualitative purposes. The static bench test is a stationary test intended to measure static offsets and static drift in the IMUs. Because the workbench is not moving, this test assumes a constant reference measurement on all sensor outputs, although no actual reference measurements are taken. Figure 8 on the following page shows a typical bench test
Figure 8: Bench test configuration
4.1.2 Pendulum Test
Pendulum tests are performed with the IMU platform mounted on the pendulum apparatus at the west end of the Freshwater Tow Tank at the NRC-IOT. These tests are accurately tracked with reference measurements from angular displacement transducers mounted along the x and y-axes of the pendulum apparatus. Several types of test may be performed using the pendulum
configuration, including both static and dynamic tests. Static pendulum tests include the static pendulum test and the fixed-angle pendulum test. Figure 9a below shows a static pendulum test and Figure 9b shows a fixed angle pendulum test.
(a) (b) Figure 9: Static pendulum tests
Dynamic tests include the surge test, sway test, combined surge-sway test, and conical orbit test. Figure 10 on the next page shows an example of a dynamic pendulum test.
Figure 10: Dynamic pendulum test (sway)
4.1.3 Rotary Table Test
Rotary table tests are performed with the IMU platform mounted on the Genisco rate-of-turn table at the west end of the Clearwater Tow Tank at the NRC-IOT. The Genisco rate-of-turn table can be set to rotate about the z-axis with a constant angular velocity from 0.01 deg/s to 1200 deg/s. This velocity is constant to within 0.1% of the setting for the entire velocity range. The rate-of-turn table table is primarily used to perform yaw tests but it can also be used to simulate a “ladder-pattern” typically used in UUV navigation system tests. Rotary table tests are normally done as a series of short tests across a range of angular rates. The IMU platform is mounted with its midpoint at the centre of the rate-of-turn table. To ensure data consistency within a test series, it is important to perform the complete series of tests without removing the IMU platform from the rotary table. Figure 11a shows the set-up of the rotary table and
mounting hardware without the IMU platform. Figure 11b shows the setup for a typical rotary table test.
(a) (b) Figure 11: Rotary table configuration
4.1.4 Cart Test
Cart tests are performed with the IMU platform resting level on a shop cart. The shop cart may have hard wheels if tests are to be performed on the concrete floor indoors. A shop cart with pneumatic tires should be used if tests are to be performed outdoors. The shop cart is intended to simulate the movements of a vehicle. There are several types of cart test including the ladder test, rectangle test, yaw test, and random test. The motion of the cart is not tracked with GPS or any other reference signal during the cart test. As a result, mostly qualitative data can be taken from the test results. Figure 12 shows a typical cart test configuration.
4.2 Test Equipment
Table 8 lists all of the equipment used to carry out the experiments detailed in this report. Table 8: Equipment List
Device Manufacturer Model Number
Pendulum Apparatus NRC-IOT -
ADT Transtek 0600-000
Rotary Table Genisco C181
Platform PC Axiomtek eBOX630-830 series
Wireless network adapter Retail Plus 0560 NI USB DAQ National Instruments USB-6009
Serial Hub Keyspan USA-49WLC
Lithium Ion battery pack - -
DC/DC converter Marport E304
Terminal block - -
Crossbow isolation box NRC/IOT -
Power Supply Xantrex XDL 35-STP
Battery chargers Mascot 2040
Digital multimeter Elenco M2625
Fixed angle bar NRC/IOT 02
Laptop HP -
Monitor Acer -
USB Mouse Dell -
USB Keyboard Logitech -
USB hub - -
Digital Camera Olympus -
Smart phone Samsung SGH-T959D
Shop cart Rubbermade -
9/16" wrench Mastercraft - 9/16" socket Mastercraft - 1/2" socket wrench Mastercraft - 1/2" X 10" extension bar Mastercraft - Robertson screwdriver, #2 Mastercraft -
Styrofoam 3M -
4.3 Instrumentation Setup
The IMU platform holds all of the instrumentation necessary to perform an IMU test, no external cables or power supplies are necessary besides the ADT cables for pendulum tests. Furthermore, the platform PC can be controlled wirelessly through a remote desktop connection. All of the IMUs, their power supplies and the PC used in the DAS are energized by a 312 Watt•hour rechargeable lithium ion battery pack. The battery pack provides approximately 4 hours of testing between charges. Figure 13 shows a photograph of the IMU platform, showing the actual layout and orientation of the IMUs during testing for Data Set B. The number on each of the IMUs corresponds to the leftmost column of Table 9.
Figure 13: IMU Location Table 9: IMU Platform
The sensors are always mounted to the IMU platform as shown; the location and orientation of each IMU matches Figure 13 for every test in Data Set A and Data Set B.
# Device P Platform 1 Crossbow 2 MicroStrain 3 MotionPak-II 4 PHINS 5 Watson 6 Xsens
4.4 Coordinate System
Figure 14 shows the orientation of each device on the test platform, showing the internal coordinate system as defined by the manufacturer. The coordinate system for each sensor is made up of three orthogonal axes that follow the right hand system. Please note, the black coordinate system axes shown in this diagram are only intended to indicate the orientation of the sensor in space, they are not located at the actual centre of measurement for the device. The red arrows make up the coordinate system defined for the test platform. This platform coordinate system matches the global coordinate system for the overall pendulum apparatus. The origin of the platform coordinate system is located in the centre of the test platform with the positive Z-axis extending upwards from the top surface of the plate.
Watson Phins Crossbow MotionPak Xsens MicroStrain X Y Z X1 X2 X3 X Y Z X Y Z X Y Z Y X Z Device coordinate system Global coordinate system
Figure 14: Orientation of Coordinate Axes
Table 10 shows the orientation of each of the device axes relative to the platform coordinate system. This table is useful for determining the IMU output that corresponds to a given platform input. For example, if the platform is surged forwards along the X-axis, the MicroStrain would detect positive X-acceleration, while the Xsens would detect negative Y-acceleration.
Table 10: Orientation of IMUs Relative to Platform # Device Direction with respect
to platform P Platform X Y Z 1 Crossbow -Y -X -Z 2 MicroStrain X -Y -Z 3 MotionPak-II X Y Z 4 PHINS -X2 X1 X3 5 Watson Y X -Z 6 Xsens -Y X Z
4.5 Test Procedures
IMU testing was performed in two parts: Data Set A and Data Set B. The test procedures followed for Data Set A are detailed in Appendix D and those for Data Set B are detailed in Appendix E. Each of the two test logs follows a general test procedure format that is consistent between data sets in order to allow for comparison of test results between data sets. The test logs provide formal test procedures as well as a detailed account of each experiment as it was
performed, with remarks and observations made during the tests. 4.6 Test Results
All of the information collected during the test phase of the IMU comparison study is written to a DVD titled “S Holmes Workterm Data – Aug 2011”.The results of the IMU tests in Data Set A and Data Set B are saved in the DVD directory indicated in the test log under “Test Data”. “Part A” describes the first group of the IMU tests where Data Set A is recorded. Likewise, “Part B” describes the second group of the IMU tests where Data Set B is recorded. In both parts, the ASCII data files are stored in a compressed folder to conserve disk space. Further details of the test results are described below.
4.6.1 Data Set A
The tests performed for Data Set A are listed in Table 18 in Appendix D. Pendulum apparatus specifications for Data Set A are listed in Table 12 in Appendix A. The pendulum apparatus specifications list the length, mass and centre of gravity of the pendulum pole and platform combined, as well as calculated values for moment of inertia and minimum period of oscillation. It should be noted that the period of a compound pendulum is determined by two factors: the masses and moment of inertia of the pendulum arm and platform combined, and the amplitude of the oscillations. As the amplitude of the pendulum oscillations decay, the period of oscillation changes.
4.6.2 Data Set B
The tests performed for Data Set B are listed in Table 19 in Appendix E. The data files from these tests has been imported into MATLAB for qualitative analysis, however a detailed quantitative analysis is still in process. The data files include a MATLAB timescale as well as the timestamp value used in Data Set A. Table 11 lists the MATLAB files saved for each of the tests in Data Set B. These files are stored in the DVD directory “...\Test Data\Part B - Six Sensors”. Additional photos from Data Set B tests can be found in the “Photos” folder on the DVD. Note that the photos are captioned in the “Comments” file properties field for each photo. Pendulum apparatus specifications for this data set are listed in Table 13 in Appendix A. The pendulum apparatus specifications list the length, mass and centre of gravity of the pendulum pole and platform combined, as well as calculated values for moment of inertia and minimum period of oscillation. As mentioned previously, it should be noted that the period of a compound pendulum is determined by two factors: the masses and moment of inertia of the pendulum arm and platform combined, and the amplitude of the oscillations.
Table 11: Data Set B MATLAB files
Data File Data File Data File
1 Data_1_1.mat Data_10a_1.mat 2 Data_2_1.mat Data_10a_2.mat a Data_3a_1.mat b Data_10b_1.mat b Data_3b_1.mat Data_10c_1.mat c Data_3c_1.mat Data_10c_2.mat d Data_3d_1.mat Data_10c_3.mat Data_4_1.mat Data_10d_1.mat Data_4_2.mat Data_10d_2.mat Data_5_1.mat Data_10d_3.mat Data_5_2.mat Data_10e_1.mat
a Data_6a_1.mat a Data_9a_1.mat Data_10e_2.mat b Data_6b_1.mat b Data_9b_1.mat Data_10e_3.mat a Data_7a_1.mat c Data_9c_1.mat f Data_10f_1.mat b Data_7b_1.mat d Data_9d_1.mat g Data_10g_1.mat
h Data_10h_1.mat Test No. Test No. d e c Data_8a_1.mat Data_8b_1.mat Data_8c_1.mat Data_8d_1.mat 5 9 10 4 Data_8e_1.mat a Test No. 3 6 7 8 a b c d e
5.0 PART 4: DATA ANALYSIS
The next step in the IMU comparison project is formal analysis of the test data. Data analysis involves preparation of the test data, conversion, time synchronization, and other post processing before quantitative analysis can proceed. After preparation, the IMUs can be compared
objectively to produce a conclusive numerical performance assessment. 5.1 Goals for Data Analysis
The main goals for data analysis are as follows: Remove as many sources of error as possible
Expose test errors and suggest areas for improvement Deliver results with the best statistical significance possible
Compare high level (pitch, roll, yaw) as well as low level (acc,gyr,mag) IMU output Compare IMU output using a consistent set of measurement units and coordinate axes Present a conclusive set of performance data that will prove useful for IMU selection 5.2 Preparation of the Data
The test data are formatted to allow rapid importation into MATLAB or similar software for initial data preparation. Some tests involve qualitative analysis, such as observation of static signals, or identification of signal drift. In these instances, recorded sensor data can be used as-is, without any data preparation. For quantitative analysis or when sample-by-sample comparison is
necessary, each set of data should be re-sampled in post processing to ensure a common time base and coordinate frame. In particular, when comparing pendulum test data from the IMUs to the reference signal from the pendulum ADTs, it is important to align and synchronize the IMU data with the ADT reference signals. Further preparation of the data can be done to account for physical misalignments of the sensors, to compensate for static offsets, to smooth out
irregularities in the data signal, and to filter out noise or disturbances in the data. For example, data collected in Data Set A for the natural frequency of the pendulum apparatus can be used to filter out noise caused by propagation of high frequency vibrations in the pendulum frame. Other useful data like this can be found in Section 3.3 of Appendix D.
5.2.1 Conversion
DataLogger automatically converts and formats the IMU data as indicated in Appendix B. However, some unit conversion is required because the IMUs do not all record using the same set of units. Tables 15 and 16 in Appendix B show the set of units associated with each sensor.
5.2.2 Time Synchronization
Although DataLogger records all of the IMUs using the same executable program, the IMU data signals are not recorded in perfect synchronization. Furthermore, the IMUs do not all share the same sampling frequency, as shown in Table 5. As a result, it is necessary to resample the IMUs to a common frequency. Another complication is the time synchronization of the ADTs. In order to compare IMU data to the ADT reference signals these signals must also be aligned and
synchronized.
5.3 Status of Data Analysis
Presently, all of the data recorded during the IMU tests is awaiting quantitative analysis. Upon completion of each and every IMU test, all data sets were imported into MATLAB and
qualitatively inspected for errors. Some initial quantitative tests have been attempted by the author and several researchers at the NRC-IOT, however no conclusive results or standard data analysis procedure have been established. Therefore, the next step in the IMU comparison study is to implement a standard procedure for data conditioning and data comparison that is in line with the data analysis goals previously mentioned. A thorough analysis of the available data will yield quantitative performance comparisons of the IMUs as well as detect inaccuracies and sources of error in the data collection procedure.
6.0 DISCUSSION 6.1 Sources of Error
The IMU tests were designed to be as simple as possible, however several significant sources of error exist.
Assembly error
Machining tolerances and assembly misalignment are unavoidable, and contribute a small degree of error to the tests. Misalignment of the ADTs mounted on the pendulum apparatus, the IMUs mounted on the test platform, and the test platform mounted to the base of the pendulum pole introduces error to the measured results. Fortunately, some of this error can be removed during post processing by implementing a rotation matrix to correct values that do not show orthogonal alignment.
Design Limitations
The pendulum apparatus is designed to swing freely in both the x and y axes while recording the x and y angular displacement using ADTs mounted on the pendulum pole pivots. By design, in order to measure angular displacements about both x and y coordinate axes, both pivots are free to move at all times. This complicates matters when it is desired to swing the pendulum along only one axis, such as in a surge test. It is not possible to constrain the pendulum to one axis of rotation, therefore error is present in surge and sway tests because the pendulum does not track exactly along the desired axis. In the case of sway tests in particular, it has been observed that the pendulum takes on an elliptical orbit shortly after the test commences. Some of this error can be resolved in post processing, but not all-together.
Environmental error
The majority of the IMU tests were performed at the west end of the freshwater tow tank at the NRC-IOT. This area is not temperature controlled and it close to vibrating equipment and ferrous structures that can influence the readings of the sensors unpredictably.
Data acquisition error
The data acquisition system introduces some error in the test results. First, the accuracy and stability of the timestamp used in the data logs may introduce some variability and drift. This error may make it difficult to compare signals over a long period of time. Secondly, two different data acquisition systems are used to simultaneously record IMU and ADT output. This
introduces synchronization error between the IMU data and the ADT data. Lastly, recording error can be introduced by the data acquisition and signal conditioning instruments themselves. Practical considerations
Some of the calculated values, such as moment of inertia of the pendulum pole, were based of values that could not be measured directly off the of the actual apparatus due to practical considerations. Instead, these values were obtained by interrogating the physical properties of a CAD model, which is not identical to the actual apparatus.
6.2 “Black Box” Comparison
The IMU comparison is intended to provide a “black box” comparison the devices, meaning that the tests are only concerned with inputs and outputs to the IMUs, not the internal workings of each device. Each of the IMUs is tested as though it was taken directly out of the box from the manufacturer. No internal adjustments or calibrations were performed to the IMUs at any time during the tests. This way, the test results will closely reflect the performance that would be
observed by any consumer who purchases an IMU and implements it right out of the box. Therefore, the comparison results are applicable to a much wider audience.
7.0 CONCLUSION
This report documents the test phase of the IMU comparison study being performed at the NRC-IOT. The IMU tests were performed according to documented test procedures in two main data sets. The testing procedures were aimed at producing simple, repeatable results from excitations that closely simulate real world IMU applications. It can be concluded that the IMU tests
produced enough data to thoroughly compare each of the key aspects of the IMUs in the study. The test data are expected to require considerable post processing before quantitative data can be performed, however this data preparation will be useful for remedying several of the identified sources of error inherent to the IMU tests. Ultimately, the completion of the IMU tests has produced a pool of data for analysis and comparison of the Crossbow, MicroStrain, MotionPak-II, PHINS, Watson, and Xsens IMUs.
8.0 RECOMMENDATIONS
The author recommends a complete and thorough analysis of Data Set A and Data Set B. Priority may be given to Data Set B because it tests all six sensors available at the NRC-IOT. It is
recommended to implement a standard procedure for data conditioning and data comparison that is in line with the overall objectives of the IMU comparison study. Furthermore, the author recommends using several post processing steps to account for physical misalignments of the sensors, compensate for static offsets, smooth out irregularities in the data signal, and to filter out noise or disturbances in the data.
9.0 REFERENCES
Chaulk, Mitchell. April 2011, “Inertial Measurement Unit (IMU) Testing Procedure.” NRC-IOT Student Report SR-2011-05.
Chaulk, Mitchell. April 2011, “Data Acquisition Software for Port Interfacing Devices.” NRC-IOT Student Report SR-2011-06.
House, Thomas. December 2010, “Testing Apparatus for Comparing the Performance of Inertial Measurement Units.” NRC-IOT Student Report SR-2010-25.
Shea, David, C.D.Williams, M.Chaulk, T.House and S.Holmes, “Comparison and Testing of Inertial Sensors at the NRC-IOT.” Paper presented at the 17th International Symposium on Unmanned Untethered Submersible Technology (UUST), Portsmouth, NH, August 21-24, 2011.
Table 12: Pendulum Apparatus Specifications – Data Set A Data Set A Long Arm (ROT_Y) Short Arm (ROT_X) Length 4.340 m 4.301 m
Mass of pendulum pole 13.1 kg 12.547 kg
Mass of platform 19.1 kg 19.1 kg
Total mass, platform + pole 32.2 kg 31.6 kg
Dist. to centre of mass from pivot 3.497 m 3.514 m Moment of inertia about pivot 422.2 kg·m2 416.0 kg·m2
Calculated period 3.88 s 3.88 s
Table 13: Pendulum Apparatus Specifications – Data Set B Data Set B Long Arm (ROT_Y) Short Arm (ROT_X) Length 4.340 m 4.301 m
Mass of pendulum pole 13.1 kg 12.547 kg
Mass of platform 21.9 kg 21.9 kg
Total mass, platform + pole 35.0 kg 34.4 kg
Dist. to centre of mass from pivot 3.555 m 3.568 m Moment of inertia about pivot 475.6 kg·m2 468.5 kg·m2
Table 14: Global Variables and Corresponding Sensor Output
Global Variable Transtek ADT Crossbow MicroStrain MotionPak-II PHINS Watson Xsens
Nanosecond Time • [1] timestamp [1] timestamp [1] timestamp [1] timestamp [1] timestamp [1] timestamp MATLAB Time [1] matlab_time [2] matlabTime [2] matlabTime [2] matlabTime [2] matlabTime [2] matlabTime [2] matlabTime
Acceleration (X) • - [10] acc_y [7] acc_x [3] acc_x - [4] acc_x2 [8] acc_y - [9] acc_y
Acceleration (Y) • - [9] acc_x - [8] acc_y [4] acc_y [3] acc_x1 [7] acc_x [8] acc_x
Acceleration (Z) • - [11] acc_z - [9] acc_z [5] acc_z [5] acc_x3 - [9] acc_z [10] acc_z
Angular rate (roll) • - [7] gyr_y [10] gyr_x [6] gyr_x - [7] gyr_y [11] rot_y - [12] gyr_y
Angular rate (pitch) • - [6] gyr_x - [11] gyr_y [7] gyr_y [6] gyr_x [10] rot_x [11] gyr_x
Angular rate (yaw) • - [8] gyr_z - [12] gyr_z [8] gyr_z [8] gyr_z - [12] rot_z [13] gyr_z
Magnetometer (X) • • [13] mag_x • • [15] mag_y - [15] mag_y
Magnetometer (Y) • • - [14] mag_y • • [14] mag_x [14] mag_x
Magnetometer (Z) • • - [15] mag_z • • - [16] mag_z [16] mag_z
Euler Angle (roll) [2] a0 - [5] pitch [4] roll • - [10] pitch [5] elevation - [18] pitch
Euler Angle (pitch) [3] a1 - [4] roll - [5] pitch • [9] roll [4] bank [17] roll
Euler Angle (yaw) • • - [6] yaw • [12] heading - [6] heading [19] yaw
Displacement (Z) • • • • [11] heave • •
Velocity (Y) • • • • • [19] v_fwd •
Table 15: Sensor Output Sorted by Variable TRANSTEK
ADT
CROSSBOW MICROSTRAIN MOTIONPAK-II PHINS WATSON XSENS
[1] timestamp [1] timestamp [1] timestamp [1] timestamp [1] timestamp [1] timestamp [1] matlab_time [2] matlabTime [2] matlabTime [2] matlabTime [2] matlabTime [2] matlabTime [2] matlabTime
[9] acc_x [7] acc_x [3] acc_x [3] acc_x1 [7] acc_x [8] acc_x
[10] acc_y [8] acc_y [4] acc_y [4] acc_x2 [8] acc_y [9] acc_y
[11] acc_z [9] acc_z [5] acc_z [5] acc_x3 [9] acc_z [10] acc_z
[6] gyr_x [10] gyr_x [6] gyr_x [6] gyr_x [10] rot_x [11] gyr_x
[7] gyr_y [11] gyr_y [7] gyr_y [7] gyr_y [11] rot_y [12] gyr_y
[8] gyr_z [12] gyr_z [8] gyr_z [8] gyr_z [12] rot_z [13] gyr_z
[13] mag_x [14] mag_x [14] mag_x
[14] mag_y [15] mag_y [15] mag_y
[15] mag_z [16] mag_z [16] mag_z
[2] a0 [4] roll [4] roll [9] roll [4] bank [17] roll
[3] a1 [5] pitch [5] pitch [10] pitch [5] elevation [18] pitch
[6] yaw [12] heading [6] heading [19] yaw
[11] heave
[19] v_fwd
[12] temp [16] temperature [9] temperature [20] temperature [7] temp
[22] flag
[13] rot_hdg
[17] inc_x
[18] inc_y
[3] seconds [3] seconds
[13] status [21] status [20] status
[3] preamble [3] preamble [4] bid [5] mid [6] len [21] sample [14] chksum [22] chksum [13] time
Table 16: Output Units – ADTs and Rotary Table
Variable Signal Format Signal Unit Conversion Data Unit Range Variable Range Unit
Time matlab_time - mt - mt -Temperature Accelerometer, x Accelerometer, y Accelerometer, z Gyroscope, x Gyroscope, y
Gyroscope, z Ang. Velocity 0.01 - 1200 deg/ s
Magnetometer, x Magnetometer, y Magnetometer, z
Euler Angle, roll a0 Analog V 13.396(a0) + 9.5353 deg ±30 Euler Angle, pitch a1 Analog V -13.174(a1) - 12.326 deg ±30 Euler Angle, yaw
Velocity, x Position, z Heading Rate Inclinometer*, x Inclinometer*, y
Table 17: Output Units - IMUs
Var. Unit Var. Unit Var. Unit Var. Unit Var. Unit Var. Unit
Time timestamp ns timestamp ns timestamp ns timestamp ns timestamp ns timestamp ns
Temperature temp °C temperature °C temperature temperature °C temp °C
Accelerometer, x acc_x m/ s2 acc_x m/ s2 acc_x m/ s2 acc_x1 m/ s2 acc_x g acc_x m/ s2 Accelerometer, y acc_y m/ s2 acc_y m/ s2 acc_y m/ s2 acc_x2 m/ s2 acc_y g acc_y m/ s2 Accelerometer, z acc_z m/ s2 acc_z m/ s2 acc_z m/ s2 acc_x3 m/ s2 acc_z g acc_z m/ s2 Gyroscope, x gyr_x deg/ s gyr_x rad/ s gyr_x deg/ s gyr_x deg/ s rot_x deg/ s gyr_x deg/ s Gyroscope, y gyr_y deg/ s gyr_y rad/ s gyr_y deg/ s gyr_y deg/ s rot_y deg/ s gyr_y deg/ s Gyroscope, z gyr_z deg/ s gyr_z rad/ s gyr_z deg/ s gyr_z deg/ s rot_z deg/ s gyr_z deg/ s
Magnetometer, x mag_x Gauss mag_x mGauss mag_x mGauss
Magnetometer, y mag_y Gauss mag_y mGauss mag_y mGauss
Magnetometer, z mag_z Gauss mag_z mGauss mag_z mGauss
Euler Angle, roll roll deg roll deg roll deg bank deg roll deg
Euler Angle, pitch pitch deg pitch deg pitch deg elevation deg pitch deg
Euler Angle, yaw yaw deg heading deg heading deg yaw deg
Velocity, x v_fwd km/ h
Position, z heave m
Heading Rate rot_hdg deg/ s
Inclinometer*, x inc_x deg
Inclinometer*, y inc_y deg
Xsens
Crossbow MotionPak II Phins Watson
10-Jun-11
PRO 3600 Calibrated: N/A
Notes:
Encoder X
[V]
Encoder Y
[V]
Set ROT_X (Measured) Set ROT_Y (Measured) a0 a1
1 0 0.00 0 0.00 -0.709 -0.926 2 0 0 30 30.0 - -3.246 3 0 0 25 25.0 - -2.799 4 0 0 20 20.0 - -2.490 5 0 0 15 15.0 - -2.072 6 0 0 10 10.0 - -1.673 7 0 0 5 5.00 - -1.296 8 0 0 -5 -5.00 - -0.555 9 0 0 -10 -10.0 - -0.173 10 0 0 -15 -15.0 - 0.214 11 0 0 -20 -20.0 - 0.599 12 0 0 -25 -25.0 - 0.943 13 0 0 -30 -30.0 - 1.320 14 0 0.00 0 0.00 -0.702 -0.942 15 30 30.0 0 0 1.514 -16 25 25.0 0 0 1.176 -17 20 20.0 0 0 0.797 -18 15 15.0 0 0 0.392 -19 10 10.0 0 0 0.027 -20 5 5.00 0 0 -0.351 -21 -5 -5.00 0 0 -1.087 -22 -10 -10.0 0 0 -1.457 -23 -15 -15.0 0 0 -1.825 -24 -20 -20.0 0 0 -2.201 -25 -25 -25.0 0 0 -2.544 -26 -30 -30.0 0 0 -2.982 -27 0 0.00 0 0.00 -0.681 -0.942
ADT Calibration Data
Date: Inclinometer: Position Inclinometer X [deg] Inclinometer Y [deg]
Inclinometer X angle is the angle between the pendulum arm and the XZ plane projected on the YZ plane.
X Y N W ROT_X ROT_Y
20-Jun-11
PRO 3600 Calibrated: N/A
Notes:
Encoder X
[V]
Encoder Y
[V]
Set ROT_X (Measured) Set ROT_Y (Measured) a0 a1
1 W 20.4 0.0 2 0.0 0.0 3 W 28.0 0.0 4 0.0 0.0 5 E -15.7 0.0 6 0.0 0.0 7 E -27.0 0.0 8 0.0 0.0 9 N 0.0 -8.0 10 0.0 0.0 11 N 0.0 -25.4 12 0.0 0.0 13 S 0.0 14.9 14 0.0 0.0 15 S 0.0 26.3 16 17 18 19 20 21 22 23 24 25 26 27
ADT Calibration Data
Date: Inclinometer: Position Inclinometer X [deg] Inclinometer Y [deg]
Inclinometer X angle is the angle between the pendulum arm and the XZ plane projected on the YZ plane.
X Y N W ROT_X ROT_Y
Table 18: Test Matrix for Data Set A
No. Date Type of Test Test Apparatus Direction Initial Roll/Pitch Amplitude (deg) Yaw Rate (deg/s) Duration of Test (min) Number of Test Runs
1 May 31, 2011 Single-plane swing Pendulum North-South 30 - 5 1
2 May 31, 2011 Single-plane swing Pendulum East-West 30 - 5 1
3 June 1, 2011 Static drift test Workbench - 0 - 240 1
4 June 13, 2011 Static drift test Pendulum - 0 - 60 1
5 June 21, 2011 Fixed angle static test Pendulum East 15 - 30 1
6 June 21, 2011 Fixed angle static test Pendulum West 15 - 30 1
7 June 21, 2011 Fixed angle static test Pendulum South 15 - 30 1
8 June 21, 2011 Fixed angle static test Pendulum North 15 - 30 1
9 June 21, 2011 Single-plane swing Pendulum North-South 30 - 10 4
10 June 21, 2011 Single-plane swing Pendulum South-North 30 - 10 1
11 June 22, 2011 Single-plane swing Pendulum North-South 30 - 10 3
12 June 22, 2011 Single-plane swing Pendulum South-North 30 - 10 3
13 June 22, 2011 Single-plane swing Pendulum West-East 30 - 10 3
14 June 22, 2011 Single-plane swing Pendulum East-West 30 - 10 3
15 June 22, 2011 Elliptical-orbit swing Pendulum Northwest 30 - 10 2
16 June 22, 2011 Elliptical-orbit swing Pendulum Southwest 30 - 10 2
17 June 22, 2011 Single-plane swing Pendulum North-South 30 - 51 1
18 June 23, 2011 Yaw-rate test Rotary Turntable CW - 89.1 15 3
19 June 23, 2011 Yaw-rate test Rotary Turntable CCW - 89.1 15 3
20 June 23, 2011 Yaw-rate test Rotary Turntable CW - 89.1 60 1
Test Log – Data Set A
TEST LOG – DATA SET A
1.0 INTRODUCTION... D4 2.0 DATALOGGER VERIFICATION TESTS ... D4 2.1 Initial Tests ... D4 2.1.1 Zero Calibration Test ... D4 2.1.2 “Roll-Axis” Test ... D5 2.1.3 “Pitch-Axis” Test ... D5 2.2 DataLogger Troubleshooting Tests ... D6
2.2.1 “Roll” then “Pitch” Test... D6 2.2.2 Watson Test #1 ... D6 2.2.3 Bench Test ... D7 2.2.4 Watson Test #2 - Test with Realterm ... D7 2.2.5 Watson Test #3 - Test with DataLogger ... D8 2.2.6 Bench Test ... D8 2.2.7 Watson Test #4 - Test with Realterm ... D9 2.2.8 Watson Test #5 - Test with DataLogger ... D9 3.0 IMU TESTS ... D10 3.1 TSR100 Tests ... D10
3.1.1 Bench Test ... D10 3.1.2 Test #2 - Marport INS Test ... D10 3.2 IMU Initial Tests... D11 3.2.1 MotionPak-II Installation Check ... D11 3.2.2 Calibration Check ... D11 3.2.3 Initial Test ... D12 3.3 Pendulum Apparatus Tests ... D12
3.3.1 ADT Calibration ... D12 3.3.2 ADT Calibration Verification ... D13 3.3.3 Natural Frequency of Pendulum Apparatus – Test #1 ... D13 3.3.4 Natural Frequency of Pendulum Apparatus – Test #2 ... D14 3.3.5 Period of Oscillation... D15 3.3.6 Encoder Calibration Check/ Hysteresis Test ... D15 3.3.7 Pendulum Pole Deflection ... D15 3.3.8 Angular Encoder Calibration Check ... D16 3.3.9 Bench Test ... D16 3.4 Static Tests... D17
3.4.1 Bench Test ... D17 3.4.2 Static Drift Test ... D18 3.4.3 Fixed Angle Drift Test #1 ... D18 3.4.4 Fixed Angle Drift Test #2 ... D19 3.5 Pendulum Tests ... D19 3.5.1 Surge Test #1 ... D19 3.5.2 Surge Test #2 ... D20 3.5.3 Sway Test... D20 3.5.4 Pitch & Roll Test ... D21 3.5.5 Long Surge Test ... D21 3.6 Rotary Table Tests ... D22 3.6.1 Rotary Table Speed Check ... D22 3.6.2 Short Yaw Test ... D22 3.6.3 Long Yaw Test... D23 3.7 Cart Tests... D23 3.7.1 Long Yaw Test... D23
1.0 INTRODUCTION
Data Set A involves simultaneous testing of the following IMUs: Microstrain
MotionPak-II PHINS Watson Xsens
For testing that includes the Crossbow unit, see Data Set B. The experiments performed for this data set are listed in the test matrix in Table 18. The “DataLogger Verification Tests” described in Section 2.0 of this appendix are not included in Table 18; they were performed to verify the operation of the IMUs, DAS, and ADTs, not for data comparison.
2.0 DATALOGGER VERIFICATION TESTS
Before actual tests can be performed, DataLogger verification tests must be completed to verify that the DataLogger data acquisition program is functioning correctly and is logging accurate data for each of IMU sensors. Initial tests must also ensure the correct operation of each IMU as well as proper functioning and logging of the Transtek ADTs on the pendulum apparatus.
2.1 Initial Tests
The purpose of the following initial tests is to check the operation of the IMUs and ADTs by performing a series of three simple pendulum tests.
2.1.1 Zero Calibration Test
Date: 10-May-2011
Purpose: Determine the “zero” signal of the Transtek ADTs and each of the sensors mounted on the platform. Data Files: IMUs ADTs Microstrain-test(2).txt zero_calib_may10_2011.txt MotionPak-test(2).txt PHINS-test(2).txt Watson-test(2).txt Xsens-test(2).txt tsr100_zero_calib.txt
Test Log – Data Set A
Procedure:
1. Mount IMU platform to pendulum
2. Record ADTs with niusb6211.exe, TSR100 with Realterm, and other sensors with DataLogger
3. Allow pendulum to hang freely at origin for 5 minutes Results:
• Test completed successfully • MotionPak-II not used in this test
2.1.2 “Roll-Axis” Test
Date: 10-May-2011
Purpose: Swing the platform about an arbitrary x-axis to examine the “roll” signal from the sensors. Data Files: IMUs ADTs Microstrain-test.txt may_10_2011_test1.txt MotionPak-test.txt PHINS-test.txt Watson-test.txt Xsens-test.txt tsr100_test_1.txt Procedure:
1. IMU platform mounted to pendulum
2. Record ADTs with niusb6211.exe, TSR100 with Realterm, and other sensors with DataLogger
3. Swing the platform from approximately 30° in “roll” for 30 minutes Results:
• Test completed successfully • MotionPak-II not used in this test
2.1.3 “Pitch-Axis” Test
Date: 10-May-2011
Purpose: Swing the platform about an arbitrary y-axis to examine the “pitch” signal from the sensors. Data Files: IMUs ADTs Microstrain-test.txt May_10_2011_test2.txt MotionPak-test.txt PHINS-test.txt Watson-test.txt Xsens-test.txt tsr100_test_2.txt