Assessment of Ion-Selective Optical Nanosensors for Drug
Screening Applications
by Hannah Yun
S.B. Materials Science and Engineering Massachusetts Institute of Technology, 2006
SUBMITTED TO THE DEPARMENT OF MATERIALS SCIENCE AND ENGINEERING IN PARTIAL FULFILLMENT OF THE REQUIREMENTS FOR THE
DEGREE OF
MASTER OF ENGINEERING IN MATERIALS SCIENCE AND ENGINEERING AT THE
MASSACHUSETTS INSTITUTE OF TECHNOLOGY
SEPTEMBER 2007
© Hannah Yun. All rights reserved.
The author hereby grants to MIT permission to reproduce and to distribute publicly paper and electronic copies of this thesis document in whole or in part in any medium now
known or hereafter created.
Signature of A uthor: ... . ... ... ... Si r to-. ent of Ma ais Science and Engineering
n
T/I
August 10,2007Certifi
Heather A. Clark The Charles Stark Draper Laboratory , /1n Thesis Supervisor C ertified by: ...
Francesco Stellacci Finmeccanica Associate Professor of Materials Science and Engineering Thesis Advisor Accepted by: ... . ...
Samuel M. Allen POSCO Professor of Physical Metallurgy
MASSACHUSTTS INSTTU Chair, Departmental Committee on Graduate Students
OF TECM+NOLOGY
SEP
2 4
2007
CHNES
Assessment of Ion-Selective Optical Nanosensors for Drug
Screening Applications
by Hannah Yun
Submitted to the Department of Materials Science and Engineering on August 10, 2007 in Partial Fulfillment of the Requirements for the Degree of Master of Engineering in
Materials Science and Engineering
ABSTRACT
Ion channels represent an important category of drug targets. They play a significant role in numerous physiological functions, from membrane excitation and signaling to fluid absorption and secretion. An ion-channel assay system using optical nanosensors has recently been developed. This high-throughput, high-content system improves on the existing patch clamp and fluorescent dye technologies that presently dominate the ion-channel screening market. This paper introduces the nanosensor technology, reviews the current market for ion-channel assays, assesses the costs associated with the nanosensors, and evaluates their commercialization potential.
Thesis Supervisor: Heather A. Clark
Title: Senior Member of the Technical Staff, The Charles Stark Draper Laboratory
Thesis Advisor: Francesco Stellacci
Title: Finmeccanica Associate Professor of Materials Science and Engineering, Massachusetts Institute of Technology
Acknowledgements
There are a number of people without whom the completion of this thesis would not have been possible.
First, I would like to recognize those at the Charles Stark Draper Laboratory, all of whom have been instrumental in my understanding of this topic. I would like to thank Heather
Clark for introducing this topic to me, and for her guidance throughout the course of my research. It would be impossible not to thank Nina Heinrich, whose consistent support,
encouragement, and patience were key in the successful completion of this report. Also at Draper Laboratory, I'd like to thank J. Matt Dubach, who patiently showed me around the laboratory and allowed me to understand how the exact process worked.
I am grateful to Francesco Stellacci, who has served in the crucial role as my on-campus thesis advisor. Without him, this thesis would have been incomplete.
And of course, there are my family and friends. Mom, Dad, Simon, and Anna, I love you guys. To all my friends, your support, love, and prayers definitely pressed me on towards completion. My life would be nothing without you!
Finally, thank you God for successfully helping me through five years of adventure at MIT.
Table of Contents
List of Figures... 8 List of Tables... 9 List ofEquations ... 9 1. Introduction ... ... 11 2. Background... 132.1. Cellular Ion Signaling ... 13
2.2. Introducing Optical Nanosensors... 14
2.3. Quantifying Ion Activity... 17
2.4. High-Throughput Screening for Intra- and Extra-Cellular Analysis ... 20
3. Defining the Market Need ... 23
3.1. Applications in Drug Toxicity Screening ... ... 23
3.2. Market Need for a High-Throughput System ... 24
4. Optical Nanosensor Synthesis ... 27
4.1. Ion-Specific Optode Development... 27
4.2. Subsequent Steps towards Nanosphere Formation ... 28
5. Cost Analysis... 33
5.1. Cost Breakdown of Nanosensor Components... 33
5.2. Cost per Nanosensor Data Point ... ... 38
5.3. Production Efficiency ... 39
6. Ion-Channel Assay Market Analysis... 45
6.1. Market Segmentation ... 45
6.2. Alternative Ion-Channel Assay Technologies ... ... .. 47
6.3. Competitive Landscape of Alternative Technologies ... 54
6.4. Optical Nanosensor Technology Differentiators ... ... 54
6.5. Optical Nanosensor Technology in the Competitive Landscape ... 56
7. Intellectual Property Landscape... 59
7.1. University of Michigan Patent #6,143,558 ... ... 59
7.2. Draper Patent ... 60
7.3. Steps Required to License Technology... 60
8. Proposed Business Model... 63
9. Conclusion... 65
List of Figures
Figure 1: Ion channel effects on cellular signaling... ... 13
Figure 2: Schematic of a generic optical nanosensor ... ... 15
Figure 3: Optode-solution interface demonstrating ion extraction... 17
Figure 4: Rat cardiac myocytes loaded with sodium-selective optical nanosensors ... 21
Figure 5: Optical sensor arrays used by Dr. Clark's group ... 21
Figure 6: Causes and stages of drug development failure ... 25
Figure 7: Drug discovery timeline and associated costs... ... 25
Figure 8: Simplified steps depicting PEG-lipid insertion into optode ... 29
Figure 9: Steps required for nanosensor fabrication ... ... 31
Figure 10: Nanosensor batch cost vs. number of batches produced... 36
Figure 11: Total material cost vs. number of batches produced... 37
Figure 12: Graph revealing the dependence of batch cost on production efficiency... 40
Figure 13: Design of the ultrasonic flow-through cell... 41
Figure 14: Dependence ofparticle size on weight fraction of the surfactant ... 42
Figure 15: Ion channel assay parameters ... . 46
Figure 16: Schematic of whole-cell patch clamp setup ... 48
Figure 17: Schematic ofplanar patch clamp setup... ... 49
Figure 18: Model of FRET mechanism ... .... ... 52
Figure 19: Competitive landscape for ion-channel assay technologies... 57
1: Diseases associated with ion channel dysfunction... 2: Components in potassium optode formulation ... ...
3: Components in sodium optode formulation... 4: Components required in optical nanosensor fabrication ... 5: Requirements for each market segment...
6: Comparison of different ion-channel assays ...
Equation 1: Equation 2: Equation 3: Equation 4: Equation 5: Equation 6: Equation 7: Equation 8:
Nernst equation describing equilibrium potential... Ion-exchange equilibrium ... . ...
Ion-exchange coefficient... Acidity constant of the chromoionophore ... ... Stability constant of the ionophore ... Hydrogen activity ratio...
Target ion activity ratio ... ... Degree ofprotonation...
List of Tables
Table Table Table Table Table TableList of Equations
1. Introduction
Towards the end of the 1990s, numerous drugs on the market that had been approved by the Food and Drug Administration (FDA) were recalled when it was discovered that they were responsible for hundreds of cases of heart malfunction, with a handful of these resulting in death. It is now known that a side effect of these drugs was the blockage of hERG (human-ether-a-go-go) channels in heart cells, which interfered with the normal rhythm of the heart. The hERG channel is an important cardiac ion channel that plays a role in moderating each heart beat. With the hERG channel blocked and each heart beat slightly prolonged (QT prolongation), some patients taking these drugs developed a condition known as polymorphic ventricular dysrhythmia, known to cause ventricular fibrillation and sudden death.
In the late 1990s, the Committee for Proprietary Medicinal Products (CPMP) convened an ad-hoc group of experts to investigate the situation surrounding QT prolongation by non-cardiovascular medicinal products. At these meetings, they recommended the use of cell-based methods to determine the effects of potential drugs on ion channels affecting the heart.' Many years later, this recommendation still stands as most research for screening ion-channel targets is currently conducted via cell-based assays.
As a result of these events, presently, the FDA requires that all new drugs entering the market be thoroughly screened for cardiac toxicity, regardless of therapeutic target. However, due to an inability to screen for drug interactions, FDA parameters for
acceptable risk are very strict. Even drugs that yield only a small risk for cardiac toxicity rarely make it to market, significantly increasing the time, and subsequently, the cost, in bringing any drug through the FDA approval process. Thus the market for cardiac screening has exploded into a multi-million dollar market, and a method to efficiently screen for drug effects on various ion channels, including (but not limited to) hERG, is highly sought.
Dr. Heather Clark's research group at Draper Laboratory has developed a working solution: a whole-cell assay system using optical nanosensors that allows for a high-throughput, high content, intra- and extra-cellular method of screening for the effects of drugs on cellular ion fluctuations. Monitoring cellular ion flux allows researchers to screen for potential toxicity effects of certain drugs; it is important that any drug with a side effect of blocking ion channels, such as the hERG channel, is detected early on in the lengthy and costly drug development process. The detection of a drug's detrimental side effects early on in its development can potentially save millions of dollars invested later on in the process.
There are currently a number of other existing ion-channel assay technologies, each with its own set of technology differentiators. This report therefore aims to explore the technical, market, and economic issues associated with commercializing the optical nanosensor technology.
2. Background
2.1.
Cellular Ion Signaling
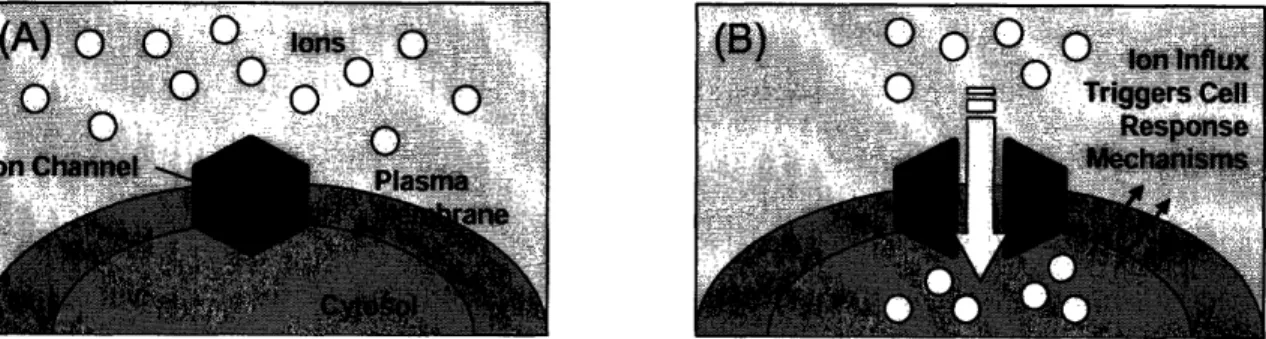
Complex ion channels and pumps are present in the membranes of all biological cells. These ion channels are protein pores in the membrane that control the flow of ions both into and out of cells. Potassium, sodium, calcium, and chloride are the four primary ions used to regulate membrane potential in most cells. Many activities inside a cell results in an ion flux across the membrane, and any perturbation in the cellular environment will evoke various forms of ion signaling (Figure 1). This ion signaling triggers cellular communication and is an integral part of the day-to-day activities inside any biological being. These cellular ion signals are the basis for a number of physiological functions, such as brain activity, hormone secretion, and heart rate. The ability to detect and quantify ion fluxes provides information regarding these important processes.
Figure 1: Ion channel effects on cellular signaling; (A) prior to external stimuli, shown ions are outside of plasma membrane, and (B) external stimuli, such as unwanted drug side-effects, can cause ion channels to open and allowing ions into a cell, resulting in various forms of cellular signaling
When an abnormal ion flux is detected in the cell membrane, an action potential is produced. This action potential is an abrupt voltage spike that results from a slight increase in membrane potential. An action potential is most often initiated by an external stimulus, such as a drug. If a drug causes an abnormal ion signaling pattern, this
In a cell, each type of ion signals a unique current. All different types of ions together control the overall membrane potential. Two types of potential gradients drive ion flow across a membrane: (1) an electrostatic force from the ionic charge differential across a membrane, and (2) a thermodynamic force from the ion concentration gradient across the membrane.2 Depending on the state of the cell at a given moment in time, these two
forces may work together or oppose each other. For each ionic current across the membrane, a specific membrane potential perfectly matches and opposes the
concentration gradient forces. This potential, known as the equilibrium potential, is distinct for each different ion. It is formally described by the Nernst equation, which reveals its dependence on ion concentration and temperature:3
RT E,=RT In a,
zF
Equation 1: Nernst equation describing equilibrium potential
Here, E, designates the equilibrium potential, R is the universal gas constant, T is the absolute temperature, F is the Faraday constant, z is the charge on ion I, and at is the activity of ion I, dependent on its concentration. As the concentration of a specific ion changes, the equilibrium potential will change; thus, one can quantify the effects of an external stimulus, such as a drug, on the ion concentrations in both the intra- and extra-cellular environments.
2.2. Introducing Optical Nanosensors
Optical nanosensors, or PEBBLES (Probes Encapsulated By Biologically Localized Embedding), may be defined as devices that transduce a chemical or biological event using an optical signal. The PEBBLE concept was first introduced in 1998 by Raoul Kopelman's research group at the University of Michigan, specifically using optical nanosensors to make intracellular measurements.4 Since then, Dr. Clark's research group at Draper has been making significant progress in this field, revealing its potential for
application in quantifying cellular activities. A schematic of a generic optical nanosensor can be seen in Figure 2 below.
H *
hv
Figure 2: Schematic of a generic optical nanosensor
The small size of the nanosensors, typically about 100 nm in diameter, enables their insertion into biological cells with minimal perturbation. They are small enough to enter into cells non-disruptively, but large enough to be prevented from entering in and out freely through the ion-channels. These nanosensors consist of an inert, bio-friendly polymeric matrix in which a sensing component and optical component are entrapped.5 The polymer matrix must allow for selective ion transport, and it must allow for ion diffusion at a reasonable rate. For this reason, the polymer must remain above its glass transition temperature. The most often-used matrix, and that which is used for the optical nanosensors discussed in this report, is comprised of poly(vinyl chloride) (PVC)
plasticized with bis(2-ethylhexyl) sebacate (DOS).6 This material is relatively
inexpensive, can be easily plasticized, and has good physical and chemical properties, such as fast ion diffusion rates and strong charge neutrality characteristics.
Electroneutrality is an important feature of optical nanosensors, dictating a necessity for the polymer matrix to retain a constant charge. Whenever a charged particle, such as an ion, permeates the polymer matrix, it must be balanced by the co-extraction or expulsion
of another charged particle. In this way, the sensors detect the activity of a target ion based on the activity of a secondary ion. As the secondary ion, typically hydrogen, responds to balance the charge of the target ion, the ion activities within the system can be quantified with the use of a proton sensitive dye inside the nanosensor. These
sensitizing dyes change absorbance (and fluorescence) depending on their degree of hydrogen protonation.
Currently, the transduction method of choice is fluorescence because of its high
sensitivity and relative ease of measurement, as well as its ability to suit high-throughput systems. Furthermore, the optical nanosensors used at Draper can be used in standard fluorescent plate readers, which are already in usage in most laboratories. For most pharmaceutical companies, no additional equipment purchases would be required to use with these sensors.
The nanosensors described in this report utilize a fluorescent indicator, which transmits an optical signal that corresponds with varying ion fluxes. The changing ion fluxes are measured with the use of an ionophore, also contained within the nanosensor. An ionophore, defined as a lipid-soluble molecule to transport ions through the lipid bilayer of the cell membrane, allows the target analyte to permeate the polymer matrix
surrounding the optical sensor. As the activity or concentration of the target ion increases, the ionophore extracts these ions from the surrounding environment into the
optode. The proton sensitive dye, or chromoionophore, is deprotonated to maintain charge neutrality in the solution. These hydrogen ions are stripped from the
chromoionophore and expelled into the solution. From here, we get fluorescence
depending on the degree of chromoionophore deprotonation. The process is illustrated in Figure 3.
2.3.
Quantifying Ion Activity
In the 1990s, Bakker and Simon developed thorough theoretical equations to describe bulk optode behavior.7 Their work will be discussed in this section.
In the following equations and in Figure 3 below, L and C are two different ionophores, each selective for a different ion. R represents a negative lipophilic additive. L and C are assumed to be dissolved into the plasticized polymeric membrane, which can be modeled as a homogeneous organic solvent phase. The sensor is in equilibrium with an aqueous solution, and the target analyte ions are extracted by mass transfer into the organic membrane phase. C denotes the chromoionophore, which changes its optical signal upon forming a complex with a specific ion.8 As mentioned previously, one
typically uses a hydrogen ion-selective chromoionophore.
Fully
Protonated (
[1+]
=
0.0
)
Fully De-Protonated
(
[1+]
= Large
)
Sample
Solution
(aq)
Ion- Permeable SampleSolution (aq)
ion- Permeable""f
r-Figure 3: Optode-solution interface demonstrating ion extraction
In this situation, the ion-exchange equilibrium between the optical ion sensors and aqueous sample phases can be described by
,. + pyL[L]+vyCH. [CH+ ]<-' IL+ [ILp v++ vyc[C]+vaH+
Equation 2: Ion-exchange equilibrium
Equation 3: Ion-exchange coefficient
The chromoionophores are assumed to be ideally hydrogen ion selective, forming a 1:1 stoichiometry in all cases described in this report. In the above equations, the primary cation Jv+ (or X- in the case of anions) is assumed to form exclusively 1 :p complexes
with the neutral ionophore L. This leads to charged complexes IL," for cations and
XLP, for anions. The hydrogen ion selective chromoionophore C competes with the
neutral cation- or anion-selective ionophore L, leading to the ion complexes CH, CH+, IL V, or XLp, within the membrane. The activity symbols ai and aH refer to species in
the aqueous phase, while concentration symbols in the organic phase (within the polymer matrix) are denoted in square brackets. The corresponding activity coefficients are
expressed by y.
In the exchange coefficient defined in Equation 3, K', determines the overall selectivity of the optical ion sensor towards the target analyte ion. The value of this equilibrium constant is dependent on the acidity constant of the chromoionophore, Ka, and on the stability constant on the ionophore-cation complex, ,jI• . These constants are defined in
the following set of equations:
Equtio [L ]P.jI
Y
Equation 5: Stability constant of the ionophore
The corresponding distribution coefficients KH+ and Ki, of the free ions between the aqueous and organic (membrane) phase are defined by Equations 6 and 7.
aH+
Equation 6: Hydrogen activity ratio
K',·+ -- V+ ai,+
Equation 7: Target ion activity ratio
The exchange coefficient defines the midpoint of the range which can be detected by an optode. The larger this constant, the more selective the optode is for the target ion, and consequently, the optode detection limits are lower. The ability to vary this constant allows researchers to optimize an optical nanosensor's response in different types of environments, adjusting to changes in acidity or concentration.
Finally, these quantitative equations must be translated into a visual transduction method. This is done by defining a new variable, a, which represents the ratio of the concentration of deprotonated chromoionophore, C, to the total concentration of C.
[C] Fprot -F
S[Ctotal Fprot - Fdeprot
This value is the standard method used to normalize the optical response of an optical nanosensor. Here, F is the fluorescence of the chromoionophore for a given equilibrium, and Fprot and Fdeprot are the fluorescence values for the totally protonated and
deprotonated forms of the chromoionophore.
Thus it is evident that as the concentration of a target ion changes in the environment surrounding an ion-selective optical nanosensor, the sensor can detect these changes and fluoresce according to the degree of ion signaling, allowing one to quantify ion
fluctuations in the system.
2.4. High-Throughput Screening for Intra- and Extra-Cellular Analysis
As described in Section 2.2, optical nanosensors were first introduced and used to make intracellular measurements by the Kopelman group in 1998. However, Heather Clark's research group at Draper Laboratory has introduced a novel application of thistechnology: optical nanosensor-based whole-cell assays that allow for high-throughput ion screening. This rapid array system allows one to monitor both intra- and extra-cellular ion flux in a large population of cells. Furthermore, this is done in a non-disruptive manner: research has shown no indication that these nanosensors alter normal cellular processes. The assays developed by Dr. Clark's group are very flexible, allowing
for use with almost any cell line or drug compound.
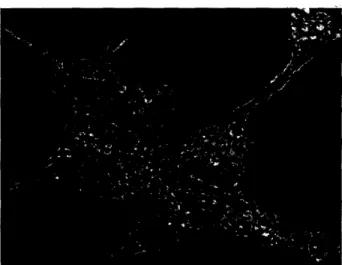
Intracellularly, the nanosensors are introduced into the cytoplasm of the cell. Their small size allows for them to be loaded into the cell via electroporation, liposomal transfection, or phagocytosis.9 Figure 4 below shows successful loading of the nanosensors into rat cardiac cells.
Figure 4: Rat cardiac myocytes loaded with sodium-selective optical nanosensors
When loading the nanosensors extracellularly, the assays use optode membranes to measure extracellular ion flux from whole cells in standard 96- or 384- well plates as depicted in Figure 5. Each well is a separate assay, containing multiple ion-selective nanosensors and biological elements, such as whole cells. The drug is applied to the wells, and changes in the ion and small molecule concentrations can be measured with the nanosensors. Important ion concentrations, such as those characteristic of sodium, potassium, and calcium, can be monitored to develop a "fingerprint" of the cellular response. This technique has the potential to yield valuable information about the effects of a particular compound on cellular activity.
3. Defining the Market Need
3.1. Applications in Drug Toxicity Screening
These optical nanosensor systems have strong applications in many areas of drug discovery, especially in the area of toxicity screening. The realization that unwanted activities at ion channels, such as the hERG channel, are best detected and eliminated early on in the drug discovery process has greatly heightened the need for screening techniques. Compared to just ten years ago, the issues involved in screening complicated ion channels are now much better appreciated across the pharmaceutical industry. As a result of this rapid growth, specialist ion-channel screeners, such as Evotec/Genion and ChanTest enjoyed booming business early on, while the larger pharmaceutical companies tried to develop their own strategies.10 Today, many of the big pharmaceuticals, such as Abbott Laboratories and Merck & Co., have caught up and are using their own in-house tools to perform ion-channel screenings." Several other large pharmaceutical
companies, such as Pfizer, and AstraZeneca have dedicated ion-channel programs to address this opportunity.
The rapid growth of the hERG-screening market is due in large part to the discovery of a class of drugs known as ion-channel modulators. Although only about 5% of the targets of marketed drugs are classed as ion channels,12 drugs that modulate ion channels had a
total market value in excess of $8 billion in 2000, and $12 billion in 2003. Overall, the global pharmaceutical market has an annual value of greater than $240 billion with major markets in the United States, Europe, and Japan. Within this multi-billion dollar
pharmaceutical market, ion-channel modulators have the most relevance in the cardiovascular market (with annual sales of $48 billion in 2002) and in the central nervous system (CNS) market (with annual sales of $40 billion in 2002), while having a presence in numerous other smaller but existing markets, such that of cancer and
The fluorescent ion-selective nanosensors developed by Dr. Clark's group have the potential to screen for countless ions and could thus play a crucial role in the drug development process. Ions crucial to the maintenance of cell membrane potential, such as sodium, potassium, calcium, and chloride have already been successfully tested in the laboratory environment. The proper functionality of each of these ions and their
corresponding ion channels is essential; should any fail to function properly, numerous diseases could result.
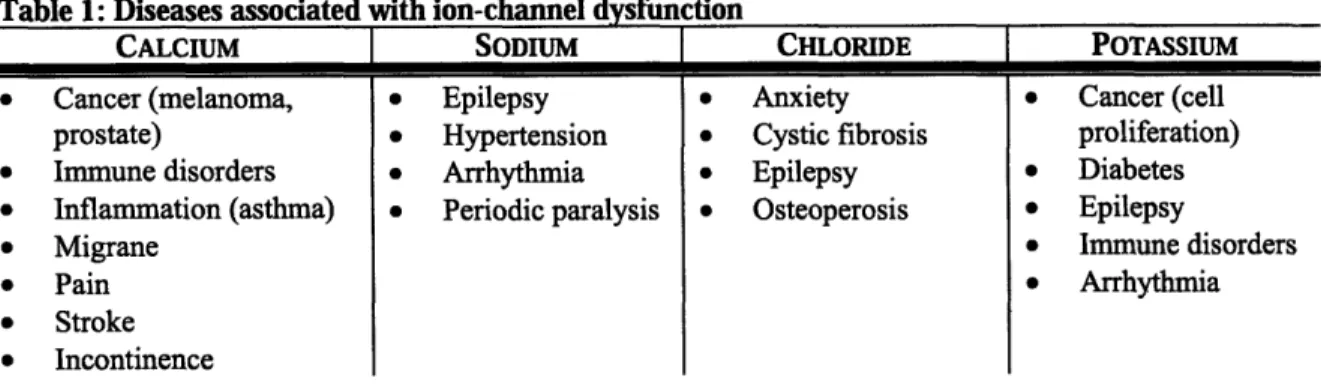
Diseases associated with ion-channel dysfunction are known as ion channelopathies. Some of these channelopathies may be a result of genetics, while others may arise from environmental factors. There are dozens of known ion channelopathies, each resulting from a non-functional ion channel. Some known ion channelopathies are listed below.
Table 1: Diseases associated with ion-channel dysfunction
CALCIUM * Cancer (melanoma, prostate) * Immune disorders * Inflammation (asthma) * Migrane * Pain * Stroke * Incontinence SODIUM Epilepsy Hypertension Arrhythmia Periodic paralysis CHLORIDE Anxiety Cystic fibrosis Epilepsy Osteoperosis POTASSIUM * Cancer (cell proliferation) * Diabetes * Epilepsy * Immune disorders * Arrhythmia
It is the hope that, aside from facilitating improved safety screening, the proposed nanosensors can screen for drugs that cause ion-channel dysfunction, thereby limiting or preventing many of these diseases.
3.2.
Market Need for a High-Throughput System
As is evident in the graph below (Figure 6A), drug toxicity accounts for almost one quarter of drug development compound failures. Of those failures, about 75 percent occur in the more advanced and expensive stages of pre-clinical and clinical development (Figure 6B). This poses a huge toll on the pharmaceutical industry; the inability to
anticipate toxicity early on in the drug discovery process cost the pharmaceutical industry an estimated $8 billion in 2003.13
(A) Market Reasons, 7% Lack of Efficacy, 300A Metabolism, and Excretion (ADME), 41% Toxicity, 22% (B) urug Discover Target ID / Validation Clinical
Figure 6: (A) Reasons for drug development failures in 2004, and (B) stages at drug compound failure [13]
A look at the drug discovery and development timeline below (Figure 7) further
emphasizes the need to detect drug toxicity early on in the drug discovery process. More than half of the finances that are required to develop a single drug go into the first five years of research, before preclinical trials even begin. It is in this initial phase of drug development that a need for a high-throughput screening system would be most
beneficial. The replacement of the current low-throughput electrophysiology system with this high-throughput, high-content optical nanosensor technology would greatly speed up the drug development process, potentially saving research groups millions of dollars.
$165M $205M $40M $120M $90M $45M $65FM
3 3 6 ~ 3 -*
Drg-isovry& e eop en Pocss(5 easS95M
u 5 ume [years) 10
Figure 7: Drug discovery timeline and associated costs; adapted from [14]
Absorption, Distribution, $205M a I " -`-I m Pre-_r. | I v II ..l..v
4. Optical Nanosensor Synthesis
The optical nanosensors used in Dr. Clark's laboratory can be formulated to monitor a virtually limitless selection of ions. With a focus on monitoring ion-flux across cellular membranes, the most essential ions to study are potassium, sodium, calcium, and chloride. The creation of nanosensors selective for all of these ions is possible with the technology being developed at Draper; however, for the scope of this section, only
fabrication methods for the first two ions will be described. This section will describe the detailed synthesis and characterization of potassium- and sodium-selective polymer nanosensors.
Three basic components are used to make the liquid polymer nanosensors: an ion-specific optode matrix that contains molecular indicators to signify a change in ion flux, a
plasticized polymer matrix, and a biocompatible coating.
4.1. Ion-Specific Optode Development
The nanosensor core is comprised of a standard optode matrix, which includes a
plasticized PVC membrane, an ionophore, a chromoionophore, and a negative lipophilic additive.15 It is the ionophore/ chromoionophore combination that allows for optimal optode performance in different physiological conditions, thus their selection is key to obtain optimal results.
The ionophore's function is to extract ions into the polymer matrix. To minimize
interference and cross-selectivity, it is important that the optodes are highly non-selective for the ionophore. Meanwhile, the chromoionophore must perform well in fluorescence; Nile Blue derivatives are most commonly used as chromoionophores.
Table 2 and Table 3 below detail the components of an optode matrix selective for potassium and sodium, respectively. All of these components are commercially
available. It can be observed that here, the only components that vary from one optode formulation to the other are the ionophore, chromoionophore, and lipophilic additive.
Table 2: Components in potassium optode formulation [8]
COMPONENT CODE NAME IMW (/mol)
lonophore BME-44 Potassium lonophore III 967.06
Chromoionophore ETH 2439 Chromoionophore II 733.98
Additive KTFPB Potassium Tetrakis[3,5- 902.31
bis(trifluoromethyl)phenyl]borate
Polymer PVC Poly(vinyl chloride) NA
Plasticizer DOS Bis(2-ethylhexyl) sebacate NA
Table 3: Components in sodium optode formulation
COMPONENT CODE NAME MW mol
lonophore NaIX Sodium lonophore X 993.27
Chromoionophore ETH 5359 Chromoionophore III 569.86
Additive NaTFPB Sodium Tetrakis[3,5- 886.20
bis(trifluoromethyl)phenyl]borate
Polymer PVC Poly(vinyl chloride) NA
Plasticizer DOS Bis(2-ethylhexyl) sebacate NA
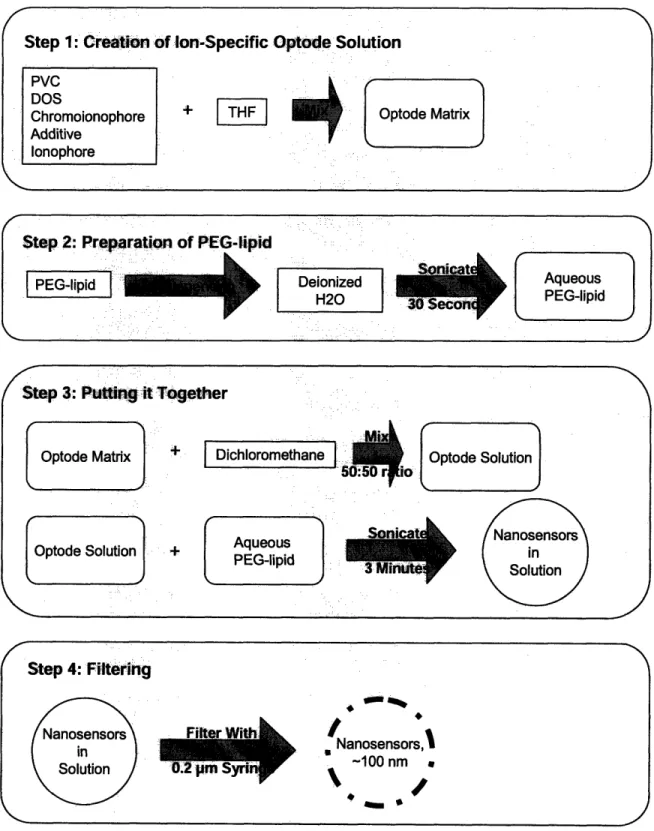
The components comprising the optode are mixed together in tetrahydrofuran (THF), an aprotic solvent often used to dissolve a wide range of compounds. The optode solution is then mixed in a 50:50 mixture with dichloromethane in a microcentrifuge tube and
sonicated for 30 seconds.
4.2. Subsequent Steps towards Nanosphere Formation
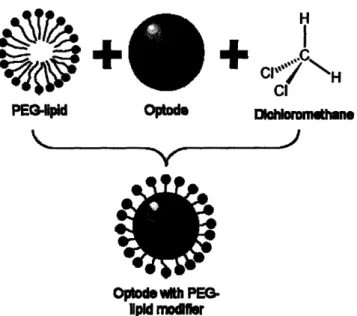
To make the organic, hydrophobic nanosensor more biocompatible with an aqueous solution, it is coated with an amphiphilic surface modifier. Generally, the sensors can be functionalized with any number of surface chemistries to aid intra-cellular loading, eliminate biofouling, or promote other desirable interactions. Many amphiphilic surface modifiers may be used, but the surface modifier used in this study is poly(ethylene
Poly(ethylene glycol), or PEG, is a water-soluble polymer that is often coupled with hydrophobic molecules to produce non-ionic surfactants. In this case, PEG coupled with
a lipid is used as the amphiphilic surface modifier. This formulation is commercially available.
The previously formulated optode solution, now mixed with dichloromethane, is then added to the dissolved PEG-lipid in an aqueous solution. This mixing occurs under intense sonication with a probe-tip sonicator for a total sonication time of 3 minutes. The dichloromethane acts as a solvent which then dissolves the surface modifier. Once dissolved in the aqueous solution, the PEG-lipid inserts its hydrophobic lipid tail into the nanosensor during formation, leaving the PEG group to stabilize the sensor in an aqueous solution (Figure 8). H CI
C-PEG-lpid Optode skkx I
Optod with PEG.
1pld mfodlsr
Figure 8: Simplified steps depicting PEG-lipid insertion into optode
Smaller nanospheres are more desirable than larger ones for reasons involving
biocompatibility. Beyond a certain size, the nanospheres are too large to be taken into a cell. Research has shown that generally, nanospheres smaller than 250 nm are more favorable for intracellular analysis, 6 so filtration through a standard filter is necessary to
remove particles that are too large. Here, a syringe with a 200 nm diameter is used to filter out unwanted nanoparticles. The resulting nanospheres have an average diameter on the order of 100 nm.
The process diagram on the opposite page (Figure 9) displays step-by-step details for the fabrication method described above. This diagram reveals that sonication is the method by which the polymer nanospheres are formed to contain all of the components needed
Step 4: Filtering
Nanosensors
in Solution Filter With0.2 p SyrirW
I
Nanosensors,l -100 nm\
/
Figure 9: Steps required for nanosensor fabrication
5. Cost Analysis
Successful entry into any market requires the fulfillment of at least one of two basic criteria: (1) Entry into an existing market with a superior product (where the new product has higher utility or worth), or (2) Entry into the market with a similarly performing, but more cost-effective, product.
The proposed optical nanosensor technology for use in drug screening applications would fall under the first category. It is entering into an existing, and flourishing, ion-screening market with a superior technology. However, this technology must prove to be cost-competitive with existing technologies in order to succeed and garner the interest of pharmaceutical companies.
5.1.
Cost Breakdown ofNanosensor Components
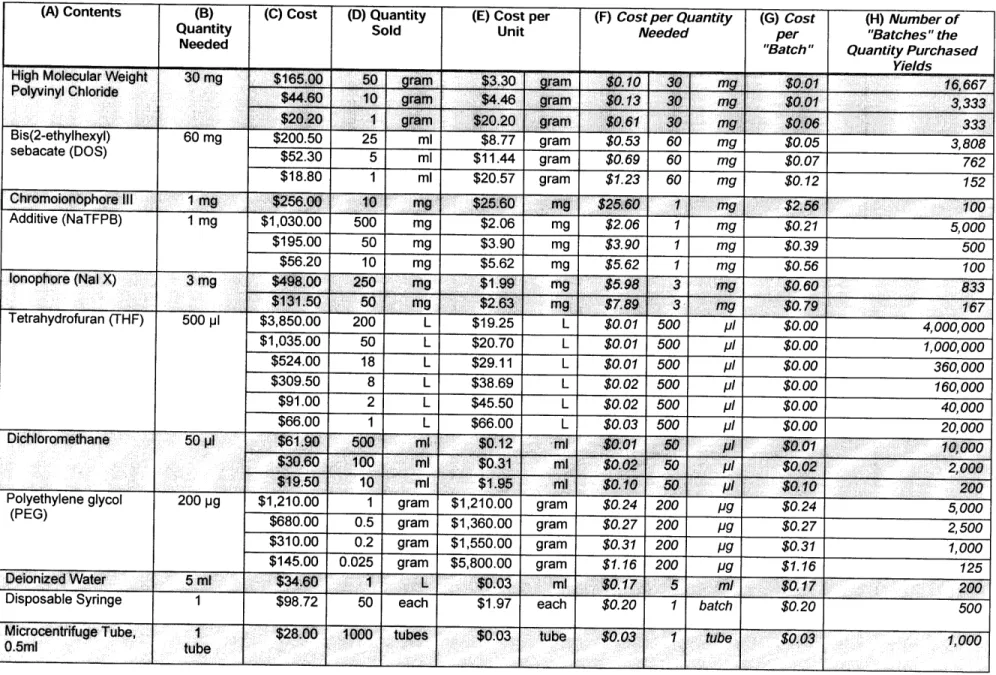
Table 4 is comprised of the materials necessary to create one 4 ml "batch" of sodium-selective nanosensor solution. As is evident in the prices quoted on this table (prices quote from Sigma Aldrich and Avanti Lipids, http://www.sigmaaldrich.com and http://www.avantilipids.com, respectively), the cost of each material in the nanosensor solution is dependent on the quantity of that component being purchased. As the quantity purchased increases, the price per unit of that material decreases. It is important to note that the quantity purchased is completely dependent on the volume of production, i.e, the number of "batches" one wishes to produce.
It should also be noted that the following calculations are a ballpark estimate of actual cost. The estimate is expected to be more conservative than actuality since purchasing chemicals in bulk will likely bring down cost, and one can assume that arrangements can be made with component vendors for bulk discounts. Furthermore, in bulk, one "batch" may not always equal 4 ml of nanosensor solution, and scaling up the batch size can
further drive down costs. However, the following calculations present an accurate
reporting of nanosensor fabrication on a smaller scale using actual vendor costs that scale with material size. As a greater number of batches of nanosensor solution are produced, the cost calculations consider that a larger sized container of material will need to be purchased, and the costs are calculated accordingly.
The first six components listed in Table 4 comprise the optode solution that is later added to the remaining chemical components. The stated "Quantity Needed" (Column B) for the materials that make up the optode solution yield enough for 10 "batches" of 4 ml nanosensor solution, accounting for the difference between the "Cost per Quantity Needed" (Column F) and the "Cost per 'Batch"' (Column G). The "Quantity Needed"
for the remaining materials, including the dichloromethane, PEG, and DI water yield just enough for one 4 ml batch of nanosensor solution; thus, the "Cost per Quantity Needed" and "Cost per 'Batch"' are the same. Also included are the non-chemical components that are required, such as the syringe that acts as a filter and a microcentrifuge tube, inside which the optode solution is combined with the dichloromethane solvent.
Calculating the dependency of batch cost on the production volume yields the graph shown in Figure 10. The general trend of this graph slopes downwards asymptotically. At small production quantities, the smallest quantity / container of material available (although most costly by-the-unit) would be purchased. Once the number of batches demanded exceeds the number of batches producible by a certain sized container, one would purchase the next smallest quantity of material. The batch cost reaches a
minimum when production quantity is at a maximum; this is due to lower unit prices for materials when a greater amount is purchased.
Table 4: Components required in optical nanosensor fabrication.
(A) Contents (B) (C) Cost (D) Quantity (E) Cost per (F) Cost per Quantity (G) Cost (H) Number of
Quantity Sold Unit Needed per "Batches" the
Needed "Batch" Quantity Purchased
High Molecular Weight 30mg $165.00 50 gram
Polyvinyl Chloride $44.60 10 gram
______ 6$20.20 1 gram Bis(2-ethylhexyl) 60 mg $200.50 25 ml I I TII-rlds% 16,667 3,333 333 3.,808
sebacate kuDU) $52.30 5 ml $11.44 gram $0.69 60 mg $0.07 762
$18.80 1 ml $20.57 gram $1.23 60 mg $0.12 152 Chromoionophore III 1 mg $256.00 10 mg $25.60 mg $25.60 1 g $2.56 100 Additive (NaTFPB) 1 mg $1,030.00 500 mg $2.06 mg $2.06 1 mg $0.21 5,000 $195.00 50 mg $3.90 mg $3.90 1 mg $0.39 500 $56.20 10 mg $5.62 mg $5.62 1 mg $0.56 100 lonophore (Nal X) 3 mg $498.00 250 mg $1.99 mg $5.98 3 mg $0.60 833 $131.50 50 mg $2.63 mg $7.89 3 mg $0.79 167 Tetrahydrofuran (THF) 500 pl $3,850.00 200 L $19.25 L $0.01 500 pl $0.00 4,000,000 $1,035.00 50 L $20.70 L $0.01 500 pl $0.00 1,000,000 $524.00 18 L $29.11 L $0.01 500 pJ $0.00 360,000 $309.50 8 L $38.69 L $0.02 500 IJI $0.00 160, 000 $91.00 2 L $45.50 L $0.02 500 pl $0.00 40,000 $66.00 1 L $66.00 L $0.03 500 pl $0.00 20,000 Dichloromethane 50 pl $61.90 500 mli $0.12 ml $0.01 50 pl $0.01 10,000
$30.60
100
ml
$0.31
ml
$0.02
50 ..
$0.02
2,000
... $19.50 10 ml $1.95 mi $0.10 50 pl $0.10 200Polyethylene glycol 200 pg $1,210.00 1 gram $1,210.00 gram $0.24 200 pg $0.24 5,000 (PEG) $680.00 0.5 gram $1,360.00 gram $0.27 200
pg $0.27 2,500
$310.00 0.2 gram $1,550.00 gram $0.31 200 pg $0.31 1,000
$145.00 0.025 gram $5,800.00 gram $1.16 200 pg $1.16 125
Deionized Water 5 ml $34.60 1 L $0.03 ml $0.17 5 m/ $0.17 200
Disposable Syringe 1 $98.72 50 each $1.97 each $0.20 1 batch $0.20 500
Microcentrifuge Tube, 1 $2800 1000 tubes $0.03 tube $0.03 1 tube $0.03 1,000
0.5ml .. ..: ,, tube
mg
mg
mg
mg
$11.00 $10.50 $10.00 $9.50 $9.00 $8.50 $8.00 $7.50 $7.00 $6.50 $6.00 $5.50 $5.00 $4.50 $4.00
Total Cost, Including Labor
Total Material Cost, Excluding Labor
-
/
200 400 600 800 1000 1200 1400 1600 1800 2000 Production Quantity (# Batches)
Figure 10: Nanosensor batch cost vs. number of batches produced
Also included in the graph in Figure 10 are the man-hours required to fabricate one batch of 4 ml nanosensor solution. A key aspect of this nanosensor technology is the ability to do high-throughput assays, and this is in large part due to the relative ease of fabricating and setting up the nanosensors for experimentation. The entire fabrication process takes only 15 minutes per batch, so for a lab technician earning $20 per hour, each batch would require $5 of labor. In the future, however, it is the hope that an automated process for nanosensor fabrication can be developed to require as little hands-on labor as possible,
further cutting costs.
Based on the graph in Figure 10, it is apparent that a production quantity of
approximately 500 batches is cost-effective. At this production quantity, batch cost (materials only) comes in at $4.17. One 4 ml batch yields enough nanosensor solution for 200 wells, each containing of 0.02 ml of nanosensors. Thus, 500 batches would yield enough nanosensor solution for 100,000 wells. Assuming a standard assay plate
-*
0Ce...
-I1~
consisted of 384 wells, this would yield enough solution for approximately 260 384-well plates. This number is certainly not out of the question as some ion-channel assay technologies today can read up to 100 384-well plates per day. In fact, in 2000, typical high-throughput screening programs in the pharmaceutical industry operated at
throughput rates on the order of 10,000 compounds per assay per day, with some laboratories working at "ultra-high throughput" rates in excess of 100,000 assays per day. 17
In order to calculate the initial investment required, it becomes necessary to calculate the total material cost. The dependence of the total material cost required for production on production quantity can be seen in Figure 11 below. The resulting graph depicts an
increasing step function. Similar to the graph in Figure 10, every step occurs at a point at which the number of batches demanded exceeds the number of batches producible by a
specified quantity (Column H of Table 4). Whenever this occurs, one would purchase the next smallest quantity of material that could satisfy the production quantity.
$10,000
$9,000
$8,000 $7,000$6,000
$5,000
$4,000
$3,000
$2,000
$1,000 $0 ~*0* -m. 0 200 400 600 800 1000 1200 1400 1600 1EProduction Quantity (# Batches)
Figure 11: Total material cost vs. number of batches produced
It should be noted that Figure 11 does not factor in labor costs but includes material costs only. This is due to the constancy of the wage rate. As long as the wage rate remains constant, one does not earn more or less depending on how many hours he or she works. Thus, there is no marginal increase or decrease in labor costs as production quantity changes. Furthermore, it should be noted that the labor associated with the optical nanosensor technology, whether automated or not, would be relatively unskilled (and hence more inexpensive) in comparison to the skilled labor required for patch clamping, a labor-intensive process described in Section 6.2.2.
Depending on the desired production quantity, the total cost for materials will change. Assuming production is occurring at the cost-effective quantity of 500 batches, the total material cost will be almost $4000. This investment will cover 100,000 wells of ion-channel analysis.
5.2. Cost per Nanosensor Data Point
In a technology that allows for the measurement of numerous data points via high- and low-throughput systems, it becomes necessary to measure the cost per data point as a valid unit of comparison between technologies.
To perform this calculation, one must consider the following information. In this system, there are:
*
1012 nanosensors per ml of sensor solution* 0.1 ml cells per well (with 100 pll solution per well) * 20,000 cells per ml (2,000 cells per well)
* 0.02 ml of nanosensors required per well of 2,000 cells in 100 p.1 solution
In the above calculations, one "batch" is defined as a 4 ml solution containing
ml of this nanosensor solution, which reveals that one 4 ml "batch" of nanosensors will fill up 200 wells.
Figure 10 reveals that at a production quantity of 500 batches, the batch cost, including labor, is $9.17. If we divide this number by the 200 wells that can be accommodated by one batch, the cost per well comes out to approximately $0.05. Assuming a mark-up of 100%, the cost per well increases to $0.10.
Since we had previously defined each individual well as one assay (Section 2.4), assuming one assay yields one usable data point, the optical nanosensor cost per data point comes to $0.10.
5.3. Production Efficiency
All of the above calculations are conducted assuming a production efficiency of 30%. This value is derived from the filtering step of the protocol for nanosensor synthesis, where only about 30% of the fabricated nanosensors make it through the 0.2 Pm filter. This step is necessary to account for the ineffectiveness of sonication in the fabrication process (Figure 9), where nanosensors exceeding the maximum allowable size are produced and must be filtered out of the system.
As we can see in Figure 12 below, the production efficiency has a great impact on the overall cost per 4 ml batch produced. Without a doubt, it would be advantageous and cost-effective to increase the production efficiency, thus driving down batch costs.
$2b.UU
$22.50
$20.00 $17.50 o $15.00 ~ $12.50 $10.00$7.50
$5.00
$2.50
$0.00
0% 10% 20% 30% 40% 50% 60% 70% 80% 90% 100% Production EfficiencyFigure 12: Graph revealing the dependence of batch cost on production efficiency
5.3.1. Suggestions for Increasing Production Efficiency
A look at previous polymer nanosphere fabrication methods detailed in the literature suggests that increasing production efficiency may be possible in a number of ways, perhaps increasing production efficiency to as much as 90%. Doing so will reduce batch costs to 33% of their original values.
Nanosphere size is controllable by adjusting the nanoparticle synthesis parameters, such as mixing speed, surfactant type, and surfactant concentration, all of which affect the
stable emulsion droplet size during hardening.18 The following three methods propose possible mechanisms for production efficiency improvement by varying such parameters:
(1) Liu et al. described the preparation of nanospheres with polystyrene shells.19 In their protocol, they sonicate the nanosphere cores and shells in a chloroform solution for 10 minutes. The analogous step in the Draper protocol would be to sonicate the optodes in the dichloromethane solution for 10 minutes, rather than for the 3 minutes that the current
40
Irrr- ~~
protocol calls for. However, doing this would require an additional step. It may be
necessary to decrease the amount of dichloromethane used, as the current 50:50 optode to solvent ratio forms droplets so quickly that increasing sonication time at this ratio would have little effect. By lowering the ratio of solvent used relative to the amount of optode in solution, and by increasing the sonication time, it may be possible to reduce resulting nanosphere size.
(2) A different approach was taken by Freitas et al. in their synthesis of biodegradable nanospheres.20 Poly(lactide-coglycolide) (PLGA) nanoparticles were produced using a modified solvent extraction/evaporation process. Similar to the Draper protocol, the PLGA was dissolved in dichloromethane. However, Freitas then dispersed this solution in an aqueous solution by means of a novel experimental set-up involving a contact-free ultrasonic flow-through cell (Figure 13). This special flow cell sonicates a medium indirectly but with a very high intensity. In a closed system, the medium is led
contamination-free through a glass tube, having no contact with the sonotrode or with the atmosphere.
=*. ,
A Ai
Figure 13: Design of the ultrasonic flow-through cell; with kind permission of reproduction from ecmjournal.org
Freitas discovered that by varying either the sonication power or nanoparticle solution residence time, the mean particle size was controllable. At a sonication power of 32 W and a residence time of 14 min, the mean particle diameter was 485 ± 15 nm.
Nanoparticle sizes in the 10th to 90th percentiles ranged from 175 to 755 nm. By ouli
increasing the sonication power or the residence time, it may be possible to reduce nanoparticle diameter to less than 200 nm, which is our maximum allowable size.
(3) In another demonstration, Landfester et al. showed that particle size is controllable by the ultrasonication time as well as the variation of the amount of surfactant used.2
1 As surfactant concentration increases, particle size will generally decrease (Figure 14). This occurs because the smaller the particle size, the higher the required surface coverage by the surfactant. With a constant ultrasonication time, particle size is dependent on the
ability to increase and stabilize "newly created" interfacial areas. This ability is solely dependent on the amount of surfactant used, and therefore, the area of the beads to be covered by surfactant chains becomes an important parameter in determining particle size. Specifically, Landfester showed that polymerization of styrene in miniemulsions stabilized with 0.5-50 wt % of anionic surfactant sodium dodecyl sulfate (SDS) relative to the monomer resulted in stable polymer dispersions. Resulting particle diameters ranged between 30 and 180 nm and had narrow size distribution. In the Draper protocol, increasing the concentration of the PEG-lipid relative to the optode solution may decrease particle size while also yielding size uniformity.
E 150-e E 100-
.5
0-U rU Un B U 0 50 100 150 200 250 300 350 400 (WM W.IsrW.udFigure 14: Dependence of particle size on weight fraction of the surfactant; here WM and Wu,, represent the weight of the monomer and surfactant, respectively.
Reprinted with permission from Macromolecules 1999, 32, 5222-5228. Copyright 1999 American Chemical Society.
In investigation into these other nanosphere fabrication mechanisms leads to the hypothesis that incomplete sonication of the optode solution in the aqueous solution is largely responsible for a low production efficiency. It may also be possible that insufficient surfactant concentration results in nanospheres above the maximum
allowable size limit. By sonicating for longer periods of time, using different sonication methods, or by increasing the solvent concentration, it may be possible to better
homogenize the nanospheres while reducing their mean diameters, yielding increased production efficiency.
6. Ion-Channel Assay Market Analysis
6.1. Market Segmentation
Ion-channel assays are commonly used across various fields of basic research, from investigating ion-channel related activities to their use in drug screening applications. Table 5 identifies four different market segments in the drug discovery value chain where ion-channel assays most significantly add value to the drug discovery process. 22 These market segments are: basic research, primary screening, secondary screening, and safety screening. Each of these market segments differentiates itself by its demands on different assay parameters. Among the most important parameters to consider are sensitivity, specificity, throughput, information content, robustness, flexibility, cost, and
physiological relevance.
Table 5: Requirements for each market segment; reprinted with permission from [22]
ASSAY PARAMETERS MARKET SEGMENTS
RESEARCH PRIMARY SECONDARY SAFETY SCREEN
SCREEN SCREEN " Sensitivity +++ +++ +++ + + + * Selectivity +++ + + +++ + + + * Throughput + +++ ++ ++ * Information Content +++ + +++ + + + * Robustness + +++ + + + + * Flexibility + ++ + + + " Cost +++ +++ + + * Physiological +++ + + + + + + + + relevance
Symbol key: +, moderate requirement; + +, high requirement; + + +, highest requirement
The optical nanosensors developed by Dr. Clark's group are targeted towards drug discovery for screening compounds affecting ion-channel-related targets, and such
activities would generally take place in the last of the four market segments identified: the safety screen. This market encompasses the toxicological data performed on all drug candidates by ion-channel assays, from the whole-cell to the whole-tissue level.
However, based on the cost calculations presented in Section 5, it appears that the sensors can also satisfy the needs of the other segments.
Table 5 reveals that in the safety screening market segment, almost all parameters are of either "high" or "highest" requirement with exception to cost and flexibility, which are stated as "moderate" requirements. Of the high or highest requirements, "sensitivity" describes the ability of an assay to detect target molecules, "selectivity" measures the ability of an assay to distinguish between a target molecule and other molecules,
"information content" describes the amount of data output from one test unit of an assay, "robustness" measures the ability of an assay to withstand and adapt to various external environments, "throughput" measures the speed and volume of an assay, and
"physiological relevance" describes how relevant the result of an assay is to a physiological setting.
The ion-selective, high-throughput and high-content optical nanosensor technology satisfies all of these criteria, making it an optimal choice for use in the safety screening market. It should be noted that all of the assay parameters described in Table 5 are
interrelated; each of these assay parameters can have positive or negative effects on the others (Figure 15). For example, some ion-channel assay technologies offer high throughput but relatively poor information content, while other screening techniques offer lower throughput but excellent information content.
1r N ~1 \' , 1 ' I -x , - -. ~- -I- xz I I .•/,
This interdependency of assay parameters would dictate that one single attribute should not be solely used to determine the superiority of one type of ion-channel assay over another, an important point to consider when comparing different technologies.
6.2. Alternative Ion-Channel Assay Technologies
With an increased number of ion channelopathies discovered every year, more advanced screening techniques are in demand. And as more advanced screening techniques are developed, more ion channelopathies are likely to be discovered, further increasing the need for improved screening abilities. Ionic conduction across a biological membrane
can generally be measured in two types of ways: directly or indirectly. Patch clamping and radioactive flux assays are two direct methods to measure ionic flux, while
fluorescence-based voltage and ion sensors measure ionic conduction indirectly.
6.2.2. Patch Clamping
The current gold standard for ion-channel analysis, as it has been for years, is the patch clamp. The patch clamp provides a technique for measuring currents passing through membrane channels. It gives extremely high quality and physiologically relevant results, but it requires a very labor-intensive process. Invented in the late 1970s by Sakmann and Neher,23 this technique controls, or clamps, the electrical potential difference across a cell
membrane while directly measuring the current carried by ions across the membrane at a specific voltage. Such a technology allows for a detailed characterization of ion channel gating, permeability, and most importantly, drug interactions. Furthermore, the
sensitivity of this technique allows even single ion channels to be investigated.
With the conventional patch clamp (Figure 16), a small patch of membrane is sealed (also known as a "gigaohm seal") to the tip of a micropipette, creating a "patch." A hole is created in the cell membrane under the pipette tip to enable voltage control and
measurements across the cell membrane. As specific ions enter or leave the cell, the changing ion current can be read and quantified by the electrode.
Electrode reads
- current change
Reference electrode
Figure 16: Schematic of whole-cell patch clamp setup
Although the patch clamp allows for unprecedented precise measurements of cellular ion-channel activity, its setup requires the attention of highly trained personnel. The high level of manual intervention required to make efficient measurements greatly restricts the measurement throughput. Even the most experienced patch clamper can clamp, at best,
10 to 30 cells per day.22 Such low throughput is unacceptable for high-throughput purposes and results in high costs per data point. It is estimated that one data point via the conventional patch clamping mechanism costs about $50.24
The automated patch clamp (APC) is a higher-throughput version of the manual patch clamp that is gaining popularity in the market, but is not yet as reliable as a manual patch clamp. The planar patch clamp is a type of APC, where a hole is etched into a silicon-based substrate and suction brings a cell close to the hole, creating a gigaohm seal (Figure
17). Doing so removes the need for an operator skilled in three-dimensional
manipulation to bring the conventional patch clamp's micropipette in contact with a cell. Consequently, the cost per data point is about $15, significantly lower than that of the conventional patch clamp.24'25
----Reference
electrode Silicon-basedsubstrate
Electrode reads current change
Figure 17: Schematic of planar patch clamp setup
There are a number of APCs currently on the market. Some of these, such as the PatchXpress TM 7000A (Axon Instruments; http://www.axon.com) are able to read data from 16 individual cell chambers simultaneously, while other devices, such as the Ionworks HT (Molecular Devices; http://www.moleculardevices.com) can record data from 48 channels at once. Of the APCs currently on the market, the system with the highest throughput belongs to the QPatch 9 6TM, developed by Sophion Biosciences. The
QPatch 96 TM can simultaneously read 96 channels of data, and the system works continuously and unattended until screening of a full compound library is completed, essentially eliminating the need for a trained technician.26
Although the future looks promising for automated patch clamp systems, currently even the most high-throughput APC system can only measure 96 channels simultaneously, which is far below the throughput required for safety and secondary (hundreds to thousands / day) or primary (thousands to tens of thousands / day) pharmaceutical drug screenings.27 Furthermore, measuring these 96 channels does not necessarily equal 96
usable data points. There are drawbacks associated with automated patch clamps as a result of testing only a single cell per channel. While other types of conventional plate-based assays gather data that is averaged from the signal across thousands of cells, there is a much greater risk involved with measuring only one cell as an automated assay. For
example, if the gigaohm seal were to fail during the measurement, there would be no data for that entire assay. The success rate for automated patch clamps is thus less than 100%, lowering its maximum throughput ability.
For these reasons, while APCs are currently the main technology used for ion-channel studies in secondary screening and non-compliant hERG liability testing, manual patch clamping remains the preferred technology for ion channel studies in safety screens (ex. hERG compliant assays).28 Manual patch clamps have demonstrated a reliability that has
so far been unmatched by automated patch clamps.
Even still, the APC market is on the rise. The pharmaceutical and biotechnology market for APC instrument sales was estimated to be about $32 million in 2005, while sales in 2006 were expected to peak even higher with over 200 APC orders placed worldwide. In the year 2005 alone, the mean annual laboratory budget for the purchase of ion-channel related consumables (ex. patch clamps) was estimated to be about $161 thousand. These dollar figures, coupled with the growing market for ion-channel modulating drugs, are indicative that a strong demand for an effective and efficient ion-channel screening method is in place.
6.2.3. Radioactive Flux Assays
In addition to patch clamping, another direct method of measuring ion flux occurs via radioactive flux assays. This method is not nearly as common as the patch clamp, but it is often used by many screening laboratories because it measures ion flux and gives a much higher throughput (several hundred data points per hour) than patch clamping. In addition, these are comparable to patch clamping in their highly sensitive readouts when measuring compound potency.
Radioactive flux assays make use of radioactive isotopes that are used to trace the cellular influx and efflux of specific ions. For example, 86Rb+ is a commonly used isotope that
has similar properties to K+ and permeates through KW channels. In this assay, cells expressing the ion channel of interest are incubated with the radioactive 86Rb÷ tracer for
several hours, followed by washing and removal of the excess tracer. The cells are then incubated with pharmacological modifiers to allow for 86Rb÷ efflux. Finally, the cells
and supernatant are collected for radioactive counting.29
Naturally, radioactive flux methods suffer from the inconvenience associated with handling radioactive material, such as the relatively short half-life and high-energy emission. There is also the added burden of requiring different radioactive ions for channels with different ion permeabilities. Although a non-radioactive Rb÷ efflux assay
exists where Rb÷ distribution between intracellular and extracellular space is determined
by atomic absorption spectroscopy, it is limited by its low sensitivity.30 Often, non-specific background fluxes are present and must be subtracted out of the data. Although the throughput of radioactive flux assays is greater than that of patch clamping, it is still much lower compared with that of fluorescence-based assays. The typical overall cost of using a radioactive rubidium flux assay is $1-$10 per data point. 24
6.2.4. Fluorescence-Based Voltage Sensors
The vast majority of current ion sensors are fluorescent dyes that are loaded directly into the cell. Unlike the above two methods, fluorescence-based assays do not directly measure ion current but instead measure either membrane potential-dependent or ion concentration-dependent changes of fluorescence signals resulting from ionic flux. Compared to the previous two technologies, these assays are relatively easy to set up and can achieve high throughout. Specifically, fluorescent voltage-sensitive dyes can detect and measure voltage changes across the cell membrane.


![Figure 7: Drug discovery timeline and associated costs; adapted from [14]](https://thumb-eu.123doks.com/thumbv2/123doknet/14107403.466215/25.918.141.791.882.1093/figure-drug-discovery-timeline-associated-costs-adapted.webp)