Non-structural carbohydrates in woody plants compared
among laboratories
Audrey G. Quentin
1,2,46, Elizabeth A. Pinkard
1, Michael G. Ryan
3,4,5, David T. Tissue
2, L. Scott Baggett
5,
Henry D. Adams
6, Pascale Maillard
7, Jacqueline Marchand
8, Simon M. Landhäusser
9,
André Lacointe
10,11, Yves Gibon
12,13, William R.L. Anderegg
14, Shinichi Asao
3,4, Owen K. Atkin
15,16,
Marc Bonhomme
10,11, Caroline Claye
17, Pak S. Chow
9, Anne Clément-Vidal
18, Noel W. Davies
19,
L. Turin Dickman
6, Rita Dumbur
20, David S. Ellsworth
2, Kristen Falk
21, Lucía Galiano
22,23,
José M. Grünzweig
20, Henrik Hartmann
24, Günter Hoch
25, Sharon Hood
26, Joanna E. Jones
17,
Takayoshi Koike
27, Iris Kuhlmann
24, Francisco Lloret
28,29, Melchor Maestro
30, Shawn D. Mansfield
31,
Jordi Martínez-Vilalta
28,29, Mickael Maucourt
13,32, Nathan G. McDowell
6, Annick Moing
12,13, Bertrand
Muller
33, Sergio G. Nebauer
34, Ülo Niinemets
35, Sara Palacio
30, Frida Piper
36, Eran Raveh
37, Andreas
Richter
38, Gaëlle Rolland
33, Teresa Rosas
28, Brigitte Saint Joanis
10,11, Anna Sala
26, Renee A. Smith
2,
Frank Sterck
39, Joseph R. Stinziano
40, Mari Tobias
35, Faride Unda
31, Makoto Watanabe
41, Danielle
A. Way
40,42, Lasantha K. Weerasinghe
15,43, Birgit Wild
38,44, Erin Wiley
9and David R. Woodruff
451CSIRO Land and Water, Private Bag 12, Hobart, Tasmania 7001, Australia; 2Hawkesbury Institute for the Environment, University of Western Sydney, Richmond, NSW 2753, Australia; 3Natural Resources Ecology Laboratory, Colorado State University, Fort Collins, CO 80523-1499, USA; 4Graduate Degree Program in Ecology, Colorado State University, Fort Collins, CO 80523-1401, USA; 5USDA Forest Service, Rocky Mountain Research Station, Fort Collins, CO 80521, USA; 6Earth and Environmental Sciences Division, Los Alamos National Laboratory, Los Alamos, NM, 87545, USA; 7INRA, UMR 1137, Ecologie et Ecophysiologie Forestières, Centre de Nancy, F-54280 Champenoux, France; 8INRA, UMR 1137, Ecologie et Ecophysiologie Forestières, Plateforme Technique d’Ecologie Fonctionnelle (OC 081) Centre de Nancy, F-54280 Champenoux, France; 9Department of Renewable Resources, University of Alberta, Edmonton, AB, T6G 2E3, Canada; 10INRA, UMR 0547 PIAF, F:63100 Clermont-Ferrand, France; 11Clermont Université, Université Blaise Pascal, UMR 0547 PIAF, F:6310 Clermont-Ferrand, France; 12UMR1332, Biologie du Fruit et Pathologie, INRA, Bordeaux University, 71 avenue Edouard Bourlaux, F-33140 Villenave d’Ornon, France; 13Plateforme Métabolome du Centre de Génomique Fonctionnelle Bordeaux, MetaboHUB, IBVM, Centre INRA, 71 avenue Edouard Bourlaux, F-33140 Villenave d’Ornon, France; 14Princeton Environmental Institute, Princeton University, Princeton NJ 08540, USA; 15Division of Plant Sciences, Research School of Biology, Building 46, The Australian National University, Canberra, ACT, 2601, Australia; 16ARC Centre of Excellence in Plant Energy Biology, The Australian National University, Canberra, ACT, 2601, Australia; 17Tasmanian Institute of Agriculture, School of Land and Food, Private Bag 98, University of Tasmania, Hobart, Tasmania 7001, Australia; 18CIRAD, UMR AGAP, F-34398 Montpellier, France; 19Central Science Laboratory, Private Bag 74, University of Tasmania, Hobart, Tasmania 7001, Australia; 20Robert H. Smith Faculty of Agriculture, Food and Environment, The Hebrew University of Jerusalem, P.O. Box 12, Rehovot 7610001, Israel; 21Department of Forest Ecosystems and Society, Oregon State University, Corvallis, OR 97331, USA; 22Swiss Federal Research Institute WSL, CH-8903 Birmensdorf, Switzerland; 23Institute of Hydrology, Freiburg University, Fahnenbergplatz, D-79098 Freiburg, Germany; 24Max Planck Institute for Biogeochemistry, Hans-Knöll Str. 10, 07745 Jena, Germany; 25Department of Environmental Sciences - Botany, University of Basel, Schönbeinstrasse 6, CH-4056 Basel, Switzerland; 26Division of Biological Sciences, University of Montana, Missoula MT-59812, USA; 27Silviculture and Forest Ecological Studies, Hokkaido University Sapporo, Hokkaido 060-8589, Japan; 28CREAF, Cerdanyola del Vallès E-08193 Barcelona, Spain; 29Universidad Autònoma Barcelona, Cerdanyola del Vallès E-08193 Barcelona, Spain; 30Instituto Pirenaico de Ecología (IPE-CSIC), Av. Nuestra Señora de la Victoria s/n, 22700 Jaca, Huesca, Spain; 31Department of Wood Science, University of British Columbia, V6T 1Z4 Vancouver, Canada; 32Université Bordeaux, UMR 1332, Biologie du Fruit et Pathologie, 71 avenue Edouard Bourlaux, F-33140 Villenave d’Ornon, France; 33INRA, UMR 759 LEPSE, Montpellier, F-34060 France; 34Plant Production Department, Universitat Politécnica de Valéncia, Camino de vera s.n. 46022-Valencia, Spain; 35Department of Plant Physiology, Estonian University of Life Sciences, Kreutzwaldi 1, 51014 Tartu, Estonia; 36Centro de Investigación en Ecosistemas de la Patagonia (CIEP), Simpson 471, Coyhaique, Chile; 37Department of Fruit Trees Sciences, Institute of Plant Sciences, A.R.O., Gilat Research Center, D.N. Negev 85289, Israel; 38Department of Microbiology and Ecosystem Science, University of Vienna, Althanstrasse 14, A-1090 Vienna, Austria; 39Forest Ecology and Forest Management Group, Wageningen University, Postbox 47, 6700 AA, Wageningen, the Netherlands; 40Department of Biology, Western University, 1151 Richmond Street, London, N6A 5B7, ON, Canada; 41Institute of Agriculture, Tokyo University of Agriculture and Technology Fuchu, Tokyo 183-8509, Japan; 42Nicholas School of the Environment, Duke University, Box 90328, Durham, NC 27708, USA; 43Faculty of Agriculture, University of Peradeniya, Peradeniya, 20400, Sri Lanka; 44Department of Earth Sciences, University of Gothenburg, Guldhedsgatan 5A, 40530 Gothenburg, Sweden; 45USDA Forest Service, Forestry Sciences Laboratory, Corvallis, OR 97331, USA; 46Corresponding author ([email protected])
Received November 22, 2014; accepted July 9, 2015; published online September 29, 2015; handling Editor Maurizio Mencuccini
Research paper
Introduction
Non-structural carbohydrates (NSC) are products of photosyn-thesis, provide substrates for growth and metabolism and can be stored by the plant. Consequently, NSC play a central role in plant response to the environment ( Chapin et al. 1990, Kozlowski 1992). Major theories of plant defense and growth such as the ‘growth–differentiation balance hypothesis’ ( Loomis 1932), the ‘carbon/nutrient hypothesis’ ( Bryant et al. 1983), revisions to the ‘hydraulic limitation hypothesis’ ( Ryan et al. 2006) and the ‘carbon limitation hypothesis’ ( Körner 2003) all outline a role for NSC, but that role has yet to be firmly estab-lished or rejected. In more recent years, NSC of woody plants have received wider attention in the context of understanding drought-induced mortality ( Grünzweig et al. 2008, McDowell et al. 2008, Galiano et al. 2011, Muller et al. 2011, Piper 2011, Adams et al. 2013, Duan et al. 2013, Hartmann et al. 2013, Mitchell et al. 2013, 2014, O’Brien et al. 2014, Sevanto et al. 2014, Dickman et al. 2015), altitudinal boundaries for forests ( Hoch et al. 2002, Hoch and Körner 2003, Handa et al. 2005, Li et al. 2008, Fajardo et al. 2011, 2012, 2013, Fajardo and Piper 2014), growth limitation ( Sala et al. 2010, 2012, Piper and Fajardo 2011, Palacio et al. 2014) and plant survival under poor resource conditions ( Kobe 1997, Strauss and Agrawal 1999, Haukioja and Koricheva 2000, Lusk and Piper 2007, Quentin et al. 2011, Piper and Fajardo 2014).
Several major questions about the role and regulation of stored carbohydrates in woody plants remain unanswered, such as their role in indicating plant carbon balance, helping plants cope with stress, and whether control of storage and use is active, passive or more complex ( Chapin et al. 1990, Sala et al. 2011, 2012, Wiley and Helliker 2012). The many uncertainties about how NSC are involved in the regulation of whole-tree car-bon metabolism make predictions of growth and productivity under environmental change difficult ( Ryan 2011).
Many carbohydrates can comprise NSC such as monosaccha-rides (glucose and fructose), disacchamonosaccha-rides (sucrose), polysac-charides (starch and fructans), oligosacpolysac-charides (raffinose) and sugar alcohols (inositol, sorbitol and mannitol) ( Rastall 1990, Stick and Williams 2010). Sucrose, fructose and glucose are gen-erally, but not always, the predominant soluble sugars, and starch is the pivotal non-soluble longer-term storage compound ( Mooney 1972, Chapin et al. 1990); many studies focus on these four carbohydrates while measuring plant NSC. The diver-sity of carbohydrates and matrices (tissue structural and bio-chemical characteristics), and the search for reliable and inexpensive methods that can be used for the large number of samples in environmental plant physiology studies, has led to the development of many analytical methods to determine the iden-tity and amount of carbohydrates in plant tissue (Table 1, Table S1 available as Supplementary Data at Tree Physiology Online; Non-structural carbohydrates (NSC) in plant tissue are frequently quantified to make inferences about plant responses to envi-ronmental conditions. Laboratories publishing estimates of NSC of woody plants use many different methods to evaluate NSC. We asked whether NSC estimates in the recent literature could be quantitatively compared among studies. We also asked whether any differences among laboratories were related to the extraction and quantification methods used to determine starch and sugar concentrations. These questions were addressed by sending sub-samples collected from five woody plant tissues, which varied in NSC content and chemical composition, to 29 laboratories. Each laboratory analyzed the samples with their laboratory-specific protocols, based on recent publications, to determine concentrations of soluble sugars, starch and their sum, total NSC. Labora-tory estimates differed substantially for all samples. For example, estimates for Eucalyptus globulus leaves (EGL) varied from 23 to 116 (mean = 56) mg g−1 for soluble sugars, 6–533 (mean = 94) mg g−1 for starch and 53–649 (mean = 153) mg g−1 for total
NSC. Mixed model analysis of variance showed that much of the variability among laboratories was unrelated to the categories we used for extraction and quantification methods (method category R2 = 0.05–0.12 for soluble sugars, 0.10–0.33 for starch
and 0.01–0.09 for total NSC). For EGL, the difference between the highest and lowest least squares means for categories in the mixed model analysis was 33 mg g−1 for total NSC, compared with the range of laboratory estimates of 596 mg g−1. Laboratories
were reasonably consistent in their ranks of estimates among tissues for starch (r = 0.41–0.91), but less so for total NSC (r = 0.45–0.84) and soluble sugars (r = 0.11–0.83). Our results show that NSC estimates for woody plant tissues cannot be compared among laboratories. The relative changes in NSC between treatments measured within a laboratory may be compa-rable within and between laboratories, especially for starch. To obtain compacompa-rable NSC estimates, we suggest that users can either adopt the reference method given in this publication, or report estimates for a portion of samples using the reference method, and report estimates for a standard reference material. Researchers interested in NSC estimates should work to identify and adopt standard methods.
Keywords: extraction and quantification consistency, non-structural carbohydrate chemical analysis, particle size, reference method, soluble sugars, standardization, starch.
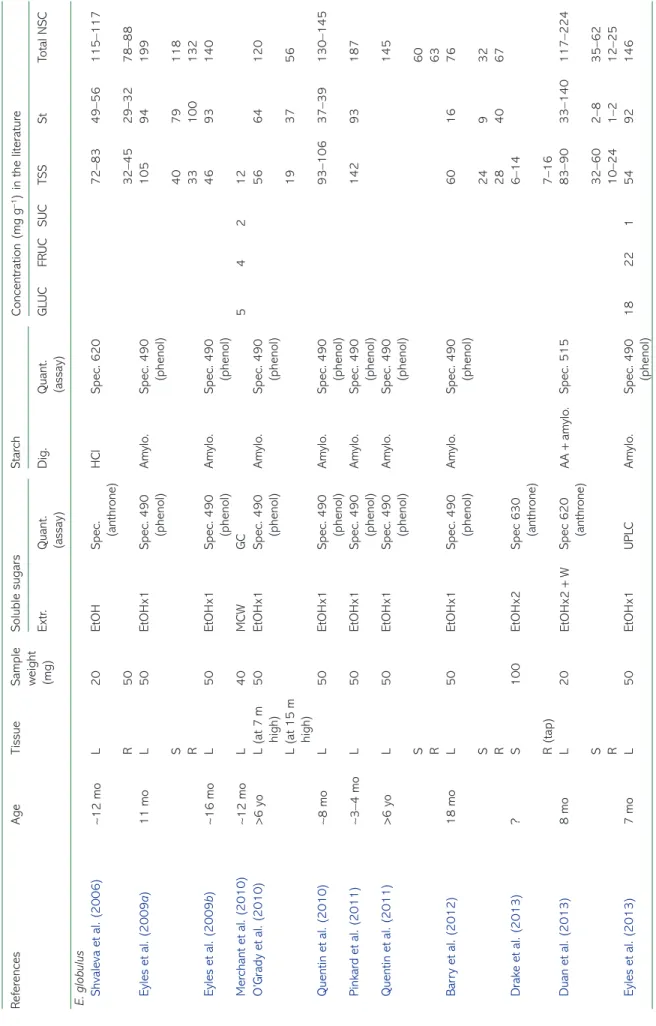
Gomez et al. 2003). Within any given plant species, a wide range of NSC values have been reported in different studies (Table 2). Potential explanations for these differences include plant age and growing conditions, but the extraction and quantification methods
may also have a major impact on the results ( Rose et al. 1991, Chow and Landhäusser 2004). For 8–12-month-old Eucalyptus globulus saplings, leaf total NSC concentration varied between 28 and 224 mg g−1 when measured using three different soluble
Table 1. Summary of the primary solvents and assays used for extraction and quantification methods to estimate soluble sugars and starch in five plant materials. The method categories also vary in the number of extractions, duration, temperature and standards. For further details on each specific method, please refer to Tables S1 and S2 available as Supplementary Data at Tree Physiology Online. AA, α-amylase; Amylo., amyloglucosidase; DMSO, dimethyl sulfoxide; EtOH, ethanol; FRUC, fructose; G6PDH, glucose-6-phosphate dehydrogenase; GHK, glucose hexokinase; GLUC, glucose; GOPOD, glucose oxidase/peroxidase-o-dianisidine; H2SO4, sulfuric acid; HCl, hydrochloric acid; HClO4, perchloric acid; 1H-NMR, proton nuclear magnetic reso-nance; HPAEC-PAD, high-performance anion exchange chromatography-pulsed amperometric detection; HPLC, high-performance liquid chromatogra-phy; KOH, potassium hydroxide; MCW, methanol : chloroform : water; NA: not attributed; NaOH, sodium hydroxide; PGI, phosphoglucose isomerase; SUC, sucrose. Soluble sugar methods include 31 laboratories and starch methods 28 laboratories. Two laboratories have used two methods to esti-mates the soluble sugars, whereas one laboratory did not estimate starch.
Strength No. of extraction Combination Duration (min) Temperature (°C) No. of laboratories Soluble sugars
Extraction methods
EtOH or MeOH 70–80%1 1–5 EtOH or W 2–60 60–100 19
W – 1–3 – 10–60 65–100 8
MCW – 1–3 – 5 to overnight 4–60 3
Absorbance Reagents Standards No. of laboratories
Quantification methods
HPLC – – Trehalose or
mannitol 8
HPAEC-PAD – – GLUC, FRUC, SUC 3
1H-NMR – – GLUC, FRUC 1
Enzymatic 340 G6PDH + GHK + PGI + Invertase GLUC, FRUC, SUC 10
Colorimetric 620 Anthrone GLUC 5
490 Phenol GLUC 4
Duration (min) Temperature (°C) No. of laboratories
Starch Gelatinization methods None – – 4 NaOH 30–180 50–100 8 DMSO 5 100 2 KOH 30 95 1 EtOH 30 100 1 AA 30 85–90 2 Others2 NA–90 120 5
Reagent/enzyme No. of extraction Temperature (°C) Duration (min h−1) No. of laboratories Digestion/extraction methods
Acid HClO4 1 Room temperature 16–20 h 2
H2SO4 Autoclave 3.5 min 1
HCl 100 6 min 1
Enzymatic Amylo. 1 or 2 45–100 30 min to 24 h 16
AA + amylo. 2 55–100 3–30 min 8
37–100 1 min to 16 h
Absorbance Reagent Standard No. of laboratories
Quantification methods
HPLC – – GLUC 4
HPAEC – – GLUC 2
Enzymatic 340 G6PDH + HK GLUC 10
Colorimetric 620–630 Anthrone GLUC 4
490 Phenol GLUC 4
510–5253 GOPOD GLUC 5
1Strength used for the first extraction. With further extractions, strength varied between 30 and 80% for ethanol, and 0% when water is used. 2Includes shaking, autoclaving, boiling and ultrasound.
3Method using the Megazyme® kit.
Ta ble 2. Pr ocedur es for solub le sug ar , star ch measur ements and NSC concentr ations and mean values for E. glob ulus and Pr un us per sica and for Pin us edulis for various en vir onmental response studi es . A A , α -am ylase; A m ylo ., am ylo glucosi da se; B A , β -am ylase; DMSO , di methyl sulf ox ide; Di g., di gesti
on; Enz., enzyma
tic; EtOH, etha
nol; Ex tr., e xtr acti on; FRUC , fructose; GL UC , glucose; GOPOD , glucose o xidase/per oxidase-o-dianisi dine; HCl, hy dr ochloride acid; HPL C, high-perf or mance liquid chr oma to gr aphy; L, leaf; MCW , methanol : chlor of or m : w ater ; mo: month-old; Qu ant., quantifica -tion; R, r
oots; spec, spectr
ophotometr y; S , stem; St, star ch; SUC, sucr ose; TSS , total solub le sug ar s; UPL C, ultr a perf or mance liquid chr oma to gr aphy; W , w ater ; y o, y ear -old. Ref er ences A ge Tissue Sample weight (mg) Solub le sug ar s Star ch Concentr ation (mg g −1) in the liter atur e Extr . Quant. (assay) Dig . Quant. (assay) GL UC FRUC SUC TSS St Total NSC E. glob ulus Shv ale va et al. (2006) ∼12 mo L 20 EtOH Spec. (anthr one) HCl Spec. 620 72–83 49–56 115–117 R 50 32–45 29–32 78–88 Eyles et al. (200 9 a) 11 mo L 50 EtOHx1 Spec. 490 (phenol) Am ylo . Spec. 490 (phenol) 105 94 199 S 40 79 118 R 33 100 132 Eyles et al. (200 9 b) ∼16 mo L 50 EtOHx1 Spec. 490 (phenol) Am ylo . Spec. 490 (phenol) 46 93 140 Mer chant et al. (2010) ∼12 mo L 40 MCW GC 5 4 2 12 O’Gr ady et al. (2010) >6 yo L (a t 7 m high) 50 EtOHx1 Spec. 490 (phenol) Am ylo . Spec. 490 (phenol) 56 64 120 L (a t 15 m high) 19 37 56 Quentin et al. (2010) ∼8 mo L 50 EtOHx1 Spec. 490 (phenol) Am ylo . Spec. 490 (phenol) 93–106 37–39 130–145 Pinkar d et al. (2011) ∼3–4 mo L 50 EtOHx1 Spec. 490 (phenol) Am ylo . Spec. 490 (phenol) 142 93 187 Quentin et al. (2011) >6 yo L 50 EtOHx1 Spec. 490 (phenol) Am ylo . Spec. 490 (phenol) 145 S 60 R 63 Bar ry et al. (201 2) 18 mo L 50 EtOHx1 Spec. 490 (phenol) Am ylo . Spec. 490 (phenol) 60 16 76 S 24 9 32 R 28 40 67 Dr ak e et al. (201 3) ? S 100 EtOHx2 Spec 630 (anthr one) 6–14 R (ta p) 7–16 Duan et al. (201 3) 8 mo L 20 EtOHx2 + W Spec 620 (anthr one) AA + am ylo . Spec. 515 83–90 33–140 117–224 S 32–60 2–8 35–62 R 10–24 1–2 12–25 Eyles et al. (201 3) 7 mo L 50 EtOHx1 UPL C Am ylo . Spec. 490 (phenol) 18 22 1 54 92 146 (Contin ued)
Ta ble 2. ( Contin ued ) Ref er ences A ge Tissue Sample weight (mg) Solub le sug ar s Star ch Concentr ation (mg g −1) in the liter atur e Extr . Quant. (assay) Dig . Quant. (assay) GL UC FRUC SUC TSS St Total NSC Mitchell et al. (2013) 6 mo L 20 EtOHx2 + W Spec 620 (anthr one) AA + am ylo . Spec. 515 (GOPOD) 85 120 206 S 20 13 33 R 46 30 76 Gauthier et al. (2014) 1 <6 mo L 5 EtOHx3 Enz. Am ylo . Spec 515 (GOPOD) 7 10 17 P . per sica Moing et al. (1992) 2 mo L ? EtOHx2 HPL C Am ylo . HPL C 11.1 5.69 36.7 95 89 184 Nii (1997) 37–38 yo L ? EtOH Spec (anthr one) 78 77 155 Tw or koski et al. (1997) 5–6 yo L 200 EtOH HPL C Am ylo . Spec. 38–158 33–48 86–191 S 44–77 39–45 83–122 Escobar -Gutiér rez et al. (1997) 2.5 mo L ? EtOHx2 HPL C Am ylo . 39 10 53 215 135 350 Inglese et al. (2002) 3 yo R 150 EtOH Enz. Am ylo . Enz. 6–9 Gr aham (2002) 2 mo R 50 MCW HPL C Am ylo . Spec. 450 16 9 9 57 52 109 S 11 3 7 54 33 88 L 20 7 15 106 26 132 Leite et al. (200 4) 11 yo S (Oct) 10 EtOHx2 HPL C Am ylo . Enz. 5 27 69 65.5 134 S (F eb) 14 35 74 16 90 Bonhomme et al. (2005) 4 yo S 10 EtOHx2 HPL C Am ylo . Enz. 15 28 72 12 84 Gor don et al. (2006) 2 yo R ? ? HPL C Am ylo . ? 150 Dichio et al. (2007) >3 yo L ? EtOH Spec. 625 (anthr one) Am ylo . Spec. 425 (GOPOD) 120 5 125 S 100 10 110 R 240 60 300 Li et al. (2007) 2 5 yo L 15 000 EtOHx3 HPL C Am ylo . Spec. (GOPOD) 4 2 9 51 25 76 Cheng et al. (2009) 2 8 yo L 15 000 EtOHx3 HPL C Am ylo . Spec. (GOPOD) 4 4 11 43 23 65 W eibel et al. (2008) 4–5 yo R EtOH Spec. (anthr one) 260 S ? 160 R 190 P . edulis Adams et al. (2013) 3 15–25 yo L 12 W Enz. Am ylo . Enz. 10–56 0–185 19–216 Ander
egg and Ander
egg (2013) 10–15 yo L ? EtOH + MCW Spec 595 BA + am ylo . Spec. 595 5–10 0–30 30–60 R 10–28 8–21 45–95 Dickman et al. (2015) 3 ? L (2007) 12 W Enz. Am ylo . Enz. 5 1 6 10 16 L (2008) 4 1 5 3 8 L (2009) 4 0 4 12 16 Se vanto et al. (2014) 3 15–25 yo L 12 W Enz. Am ylo . Enz. 13–27 1–19 27–36 6–31 36–59 1Values r epor ted in g m −2. 2Estima tions w er e made on fr esh w eight. 3No f er tiliz er used.
sugar and starch extraction methods, and three different quantifi-cation methods (Table 2). Studies have also used the same extraction and assay methods to analyze different tissues (leaves, stems, roots) that consist of different matrices (Table 2), despite evidence that different matrices can have a profound impact on the analytical results ( Smeraglia et al. 2002, Matuszewski et al. 2003, Thompson and Ellison 2005, Santiago da Silva et al. 2012). For example, the phenolics and tannins in many conifer needles can interfere with enzymatic/colorimetric techniques ( Ashwell 1957), but not all plant tissues contain these chemicals. Given such variability in NSC estimates, we believe that there is an urgent need to compare estimates of NSC of standard sam-ples for different laboratories around the world, with the labora-tories using the same methods as in their recent publications.
Several other factors suggest that a comparison of the NSC of standard samples would be worthwhile. First, such a comparison would allow plant ecophysiologists studying the role of NSC and regulation to assess and compare their own results. Second, the composition of NSC can vary widely among species, tissues and seasons ( Hoch et al. 2003, Landhäusser and Lieffers 2003, El Zein et al. 2011, Richardson et al. 2013, Dickman et al. 2015), and this diversity further contributes to potential misinterpretation when comparing results from studies that use different methods. Finally, knowledge of the comparability of quantitative estimates of NSC would benefit articles that review NSC among studies to formulate hypotheses about the regulation of plant carbon and growth mechanisms ( Körner 2003, Ainsworth and Rogers 2007, McDowell et al. 2008). To our knowledge, no study has addressed the comparability of NSC among different laboratories.
Our primary objective was to assess whether soluble sugar, starch and total NSC concentrations could be compared across laboratories that use NSC estimates to understand plant response to a variety of biotic and abiotic factors. Many of these studies focused on NSC estimates in woody species, so our common samples were from trees. We answered the question of inter-laboratory comparability in NSC quantification by sending sub-samples of five different tissue samples (leaf, root and stem) that we have hypothesized varied widely in NSC, matrix struc-ture and chemistry, to 29 laboratories. The laboratories evalu-ated the samples using their own ‘in-house’ protocols of NSC extraction and quantification (see Tables S1 and S2 available as Supplementary Data at Tree Physiology Online).
Our second objective was to determine whether estimates from an individual laboratory were consistent across the five standard samples. If a laboratory’s estimates were high, low or similar relative to all laboratories for a given sample, would the same rank apply for the other four standard samples? Consis-tency among samples would indicate the reliability of comparing relative change within and among laboratories.
The third objective was to determine whether any differences among laboratory estimates were related to the methods of extraction and/or quantification of soluble sugars and starch,
and if variability among laboratories differed by sample. Because our first objective was the primary purpose for the study, our ability to test the third objective suffered by having to group extraction and quantification methods into broad categories. This grouping and our sample of laboratories precluded testing factors that may be important sources of variability because of lack of replication. These factors include the number, tempera-ture and duration of extractions and the gelatinization of starch. We partially addressed this issue by investigating the effect of different extraction methods on sugar estimates in a single labo-ratory using a common quantification method.
Materials and methods
Non-structural carbohydrate analyses of standard samples in different laboratories
We selected five samples for our standards: leaves (EGL), roots (EGR) and stem (EGS) of E. globulus, Pinus edulis needles (PEN) and Prunus persica leaves (PPL). We selected these samples because a priori knowledge suggested that they differed in the concentration of soluble sugars and starch, and had very differ-ent structural or chemical matrices that would challenge NSC extraction. Each substrate was homogenized, irradiated at 27.8 kGy for microbiological control to meet international quar-antine requirements and then homogenized. Method S1 avail-able as Supplementary Data at Tree Physiology Online describes the collection and handling of samples used.
Sub-samples of the same five dried and ground samples were sent to 29 laboratories around the world (Austria, Australia, Canada, Chile, Estonia, France, Germany, Japan, Israel, The Netherlands, Spain, Switzerland and the USA), where each labora-tory used their own protocol to analyze the samples in triplicate (see Method S2, Tables S1 and S2 available as Supplementary Data at Tree Physiology Online). One laboratory (Q) only provided sugar estimates, and two other laboratories (L1, L2; Z1, Z2) pro-vided sugar estimates from two different methods. The number of estimates for starch was 28, the number of estimates for total soluble sugars was 31, and the independent estimates for sugars from laboratories L and Z were combined with the single starch estimate from those laboratories to yield 30 NSC estimates. One laboratory had samples analyzed twice by two separate investiga-tors, which we counted as six laboratory replicates, but only one starch, soluble sugar and NSC mean estimate. Table 1 summa-rizes the procedures used in this study to measure soluble sugars and starch in plant tissues and Tables S1 and S2 available as Supplementary Data at Tree Physiology Online provide more detailed methods. All data were reported as mg g−1 of dry mass.
Different methods for soluble sugar extraction within a single laboratory
We selected four methods of soluble sugar extraction: 80% ethanol (80% EtOH), 70% methanol (70% MeOH), methanol :
chloroform : water (MCW) at 80 °C (MCW 80) and MCW at ambient laboratory temperature (MCW amb). Individual soluble sugars (glucose, fructose, sucrose) were extracted from 20 mg of dried plant tissue for each of the five samples for each of the four methods. Alcohol methods (EtOH) were derived from Gomez et al. (2002), and ternary solvent methods (MCW) from Dickson and Larson (1975). All four methods were conducted within the same laboratory (see Method S3 available as Supple-mentary Data at Tree Physiology Online).
Other methods
We also performed an analysis of the effect of microwaving duration to halt enzymatic activity (see Method S4 available as Supplementary Data at Tree Physiology Online), and the effect of particle size (see Method S5 available as Supplementary Data at Tree Physiology Online) in single laboratories.
Statistical analyses
For Objective 1, we used a general linear mixed model analysis to determine differences in estimates among laboratories with labo-ratory and sample types as fixed effects and the extraction and quantification categories (below) as random effects. For Objective 2, we used Spearman rank correlations for laboratory ranks among all sample pairs to evaluate the consistency of laboratory esti-mates for samples with different chemical constituents. Correla-tions were estimated for total soluble sugars, starch and total NSC. For Objective 3, we used a different general linear mixed model analysis, with extraction and quantification groups and sample as fixed effects, and laboratory as a random effect. We could not perform one overall test with laboratories and meth-ods, because methods were confounded with laboratory. We grouped methods according to the type of solvent used for the extraction methods (EtOH, EtOH + W, MCW, W for the soluble sugars; and Acid, AA + amylo., Amylo. for starch) and by the type of quantitative assay for the quantification methods (HPLC, Enz., Spec. 490, Spec. 620 and Spec. 510). High-performance anion exchange chromatography-pulsed amperometric detection (HPAEC-PAD) and proton nuclear magnetic resonance (1H-NMR)
were grouped with HPLC. Both sugar and starch concentrations were log-normally distributed and all components were trans-formed for analysis. Least squares means (LSM) were back-transformed to original units after estimation of the model parameters. Other differences in laboratory protocols (differ-ences among the number, temperature and duration of extrac-tions or methods used for the gelatinization of starch) were not considered as factors within the method because of the lack of replication. General linear mixed model analyses were done using SAS PROC GLIMMIX (SAS Institute 2012). The proportion of the variance explained by the method categories compared with sample and laboratory was evaluated using the method of computing R2 for generalized linear mixed models described in Nakagawa and Schielzeth (2013). We assessed how differences
among method categories compared with differences among samples and laboratories by comparing the R2 for models with
only the method category as a fixed factor with (i) R2 for models
with only sample category as a fixed factor and (ii) with the R2
for the full model with sample and method as fixed factors and laboratory as a random factor. R2 measures were computed
using the ‘R’ statistical package version 3.1.2 ( R Development Core Team 2014) and the MuMIn library.
We examined the differences between soluble sugar extraction methods on total NSC in the same laboratory with an analysis of variance for each sample type (α = 0.05). For all tests and all experiments, we set α at 0.05. Participants were assured of ano-nymity in the experiment, and the results were coded by letters.
Results
Objective 1: estimates for soluble sugars, starch and total NSC for the same samples varied substantially among laboratories
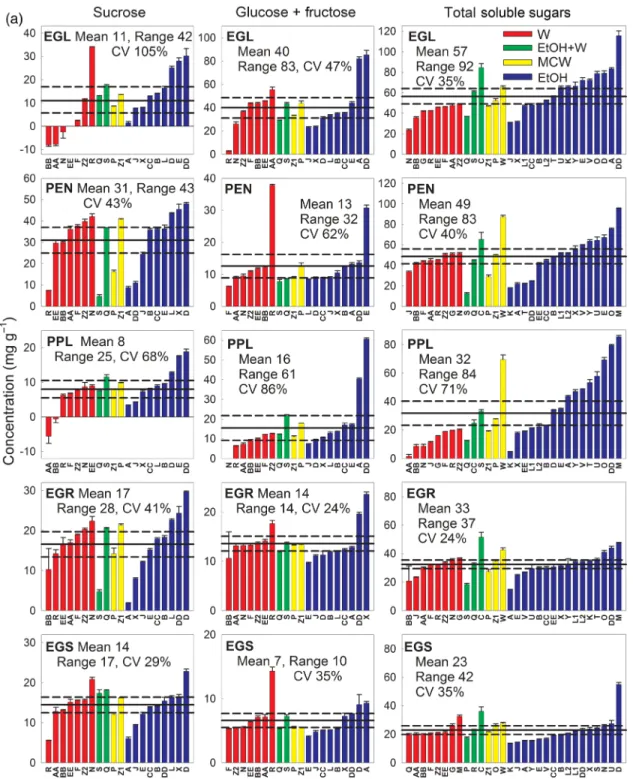
Estimates for individual sugars, total soluble sugars, starch and total NSC differed among laboratories (P < 0.001, Figure 1), with a large range for all components. For example, in E. globulus leaves (EGL), laboratory estimates ranged from 23 to 116 mg g−1
(coefficient of variation (CV) 35%) for total soluble sugars, 6–533 mg g−1 (CV 102%) for starch and 53–649 mg g−1 (CV
69%) for total NSC (Figure 1). Laboratory estimates for Prunus leaves (PPL, average CV = 87% for sugars, starch and total NSC) were more variable than those for other samples (average CV = 54–69% for all NSC components). Starch estimates were more variable among laboratories (CV 87–120%) than were soluble sugars and total NSC (CV 24–71% for sugars and 44–71% for total NSC, Figure 1). For all samples and NSC com-ponents, 10–57% of the laboratories were within the 95% con-fidence intervals estimated for the means. Laboratories were most consistent for starch estimated for the Eucalyptus leaf, stem and root samples (EGL, EGS, EGR, 16 of 28 laboratories were within the 95% confidence intervals), and least consistent for sugar estimates for Eucalyptus leaves (4 of 30 laboratories) and total NSC estimated for Pinus leaves (8 of 30 laboratories) and Prunus leaves (3 of 30 laboratories). The subset of the labora-tories that identified sucrose and glucose + fructose (n = 20) were relatively consistent, having an average of 51% or 10 of 20 laboratory estimates within the 95% confidence intervals (range = 7–14 laboratories, Figure 1a). The interaction between laboratory and sample type was highly significant for sugars, starch and total NSC (P < 0.001), indicating that differences among laboratories differed with sample type.
The range of estimates varied substantially with method and sample types (Figure 1, Figure S1 available as Supplementary Data at Tree Physiology Online). For example, NSC in the PPL sample showed high variability among laboratories (Figure 1, Fig-ure S1a available as Supplementary Data at Tree Physiology
Online), and estimates for soluble sugars varied largely within each method of extraction and quantification, except for the water extraction (W) (see Figure S1a available as Supplementary Data at Tree Physiology Online). In comparison, NSC in the EGS sample had the lowest variability among laboratories ( Figure 1b) and estimates varied less within each method (see Figure S1b available as Supplementary Data at Tree Physiology Online).
Objective 2: laboratories had similar rankings for all five common samples
Laboratory rankings were consistent for most sample pairs (Table 3; Figure 2), with higher rank correlations for starch (0.41– 0.91, mean = 0.71) and total NSC (0.45–0.84, mean = 0.60) than for soluble sugars (0.11–0.83, mean = 0.44). This consistency shows that laboratories with estimates below, above
Figure 1. Laboratory estimates of (a) sucrose, glucose + fructose, total soluble sugar, and (b) starch and NSC for five samples: EGL, PEN, PPL, EGR and EGS, with means (text and solid line), range, coefficient of variation (CV) and 95% confidence interval (dashed lines). Estimates are ranked by sugar extraction category: W, water; EtOH + W, ethanol water mixture; MCW, methanol : chloroform : water; EtOH, ethanol. Estimates differed substan-tially among laboratories and within method categories.
or near the mean for one sample tend to have a similar ranking for that carbohydrate relative to other laboratories for other samples.
Objective 3: extraction and quantification methods affect NSC estimates, but the effect is lower than variability among laboratories
We investigated whether the methods used to extract or quantify NSC could explain the variability in NSC results among laboratories
(Table 4; Figure 3). When analyses were pooled across laboratories and samples, NSC estimates did not differ by sugar or starch extrac-tion or quantificaextrac-tion methods (Table 4, P = 0.07–0.84, Figure 3c, e, g, and i: LSM). Across laboratories and samples, starch estimates were lower for ethanol + water sugar extraction than for the other three sugar extraction categories (Figure 3b: LSM, P < 0.05), but did not differ by starch extraction or quantification categories (Figure 3d and h: LSM). Across laboratories and samples, sugar estimates did not vary by extraction method category (Figure 3a: Figure 1. (Continued)
LSM), but did by sugar quantification method category (Figure 3f: LSM, P < 0.05), with the Spec. 620 colorimetric method produc-ing higher estimates than the HPLC, enzymatic or Spec. 490 method. A principal component analysis showed that within a method, the estimates for soluble sugars were more variable than were estimates for starch (see Figures S2 and S3 available as Supplementary Data at Tree Physiology Online).
An analysis of R2 for model components showed that the
dif-ferences in method category in our analysis accounted only for a small portion of differences in NSC among laboratories. R2 for
total soluble sugars with sugar extraction method category was 0.05 and 0.12 for sugar detection method category, compared with 0.30 for sample and 0.66–0.69 for the full model. R2 for
starch with starch extraction method category was 0.10 and 0.11 for starch detection method category, compared with 0.23 for sample and 0.88 or 0.92 for the full model; sugar extraction method category had an R2 of 0.33. R2 for total NSC with sugar
extraction method category was 0.09, 0.04 for sugar detection method category, 0.01 for starch extraction method category and 0.09 for starch detection category compared with 0.37 for sample and 0.79–0.84 for the full model. Additionally, differ-ences between the highest and lowest LSM for the overall effect of methods categories were small compared with the differ-ences among laboratories (compare Figure 3 with Figure 1).
Objective 3: method effects differ by sample
Sample and method had significant interactions (Table 4, P < 0.0001), with the foliar samples (EGL, PEN and PPL) showing
more variation among method categories than the wood sam-ples (EGR, EGS). For example, the sugar extractions with water (W and EtOH + W) yielded lower soluble sugar and total NSC estimates for the foliar samples (EGL, PEN and PPL), while having less effect on woody samples (EGR and EGS, Figure 3a and c). Starch concentration differences among extraction and quantification methods in woody samples were similar to those for foliar samples (Figure 3b, d and h). Colorimetric quantifica-tion (Spec. 490 and Spec. 620) of starch and soluble sugars almost always produced higher estimates for soluble sugars, starch and total NSC than did the HPLC or enzymatic methods ( Figure 3f–i).
Objective 3: single laboratory tests of soluble sugar extraction methods, microwaving and particle size
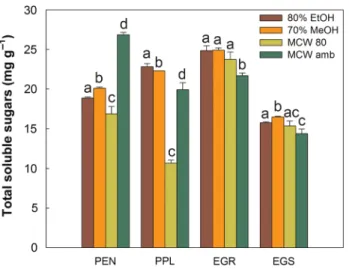
Soluble sugar extraction methods influenced sugar estimates when samples were quantified in the same laboratory using the same method. Estimates of total soluble sugars were affected by extraction methods for all samples (P < 0.05) except EGL (P > 0.10). Differences among sugar extraction methods tested in the same laboratory (Figure 4) were relatively minor com-pared with differences among laboratories (Figure 1a), with the largest differences occurring for the MCW extractions at different temperatures (Figure 4).
Microwaving small samples (<5 g) of P. edulis at 800 W required 180 s to deactivate enzymes. No microwaving or 90 s of microwaving was not effective at halting the conversion of sucrose and starch to glucose + fructose. At 300 s, starch and NSC increased, suggesting conversion of non-NSC compounds to NSC (see Method S4 available as Supplementary Data at Tree Physiology Online, Figure 5). Grinding Pinus banksiana tissues to a smaller particle size (<105 μm) yielded higher starch and total NSC estimates for root tissues (but not needles or stem) com-pared with extractions of larger particle size (<400 μm, Method S5, Figure S4 available as Supplementary Data at Tree Physiology Online).
Discussion
Absolute estimates of NSC are not comparable among laboratories (Objective 1)
Results demonstrate that estimates of soluble sugar, starch and total NSC provided by different laboratories in this study cannot be compared, even if they are obtained with the same general methods. Laboratories differed substantially in estimates for sugars, starch and total NSC, and the variability across laborato-ries and even within a method category was unexpectedly large. Therefore, comparing values for any NSC component across studies in the literature (e.g., Ainsworth et al. 2002, Morgan et al. 2003, Wittig et al. 2009) should not be done, either for individual studies or for meta-analyses, unless the study accounts for laboratory effects.
Table 3. The Spearman rank correlation indicates correlations for labo-ratories between sample pairs of 0.11–0.83 (mean = 0.44) for soluble sugars, 0.41–0.91 (mean = 0.71) for starch and 0.45–0.84 (mean = 0.60) for total NSC. These results suggest starch has the most consistency among laboratory ranks for the different samples. *P < 0.05, **P < 0.01.
EGL EGR EGS PEN PPL
Soluble sugars EGL EGR 0.33 EGS 0.11 0.73** PEN 0.29 0.52** 0.41* PPL 0.83** 0.39* 0.37* 0.41* Starch EGL EGR 0.69** EGS 0.59** 0.87** PEN 0.47* 0.83** 0.91** PPL 0.41* 0.68** 0.84** 0.81** Total NSC EGL EGR 0.59** EGS 0.49** 0.69** PEN 0.45* 0.84** 0.64** PPL 0.49** 0.54** 0.55** 0.72**
Figure 2. Correlations of laboratory ranks among all sample pairs that show the worst and best correlations for soluble sugars, starch and total NSC. Plots show that laboratory rankings can be consistent for the different samples. Spearman rank correlations for all sample pairs are given in Table 3. Solid lines are the 1 : 1 line.
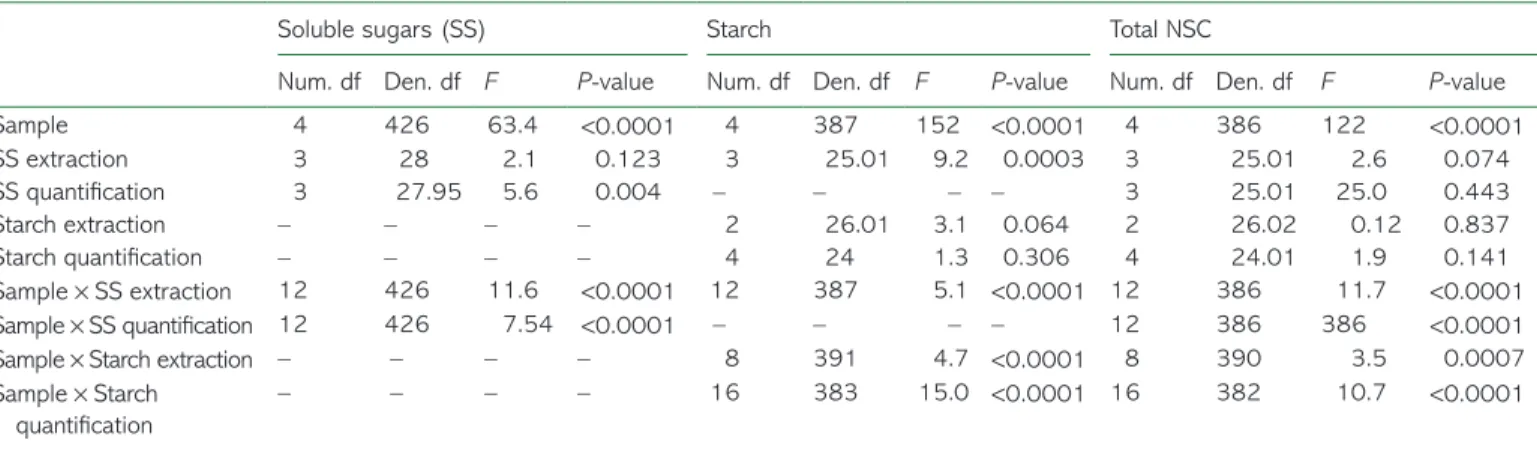
Table 4. The general linear mixed model analysis with laboratory as a random factor showed some differences for extraction and quantification methods for sugars and starch concentrations and interactions between extraction and quantification methods and sample for sugars, starch and total NSC. The interactions suggest that a method performs differently for different samples. df, degree of freedom; Num., numerator; Den., denominator.
Soluble sugars (SS) Starch Total NSC
Num. df Den. df F P-value Num. df Den. df F P-value Num. df Den. df F P-value
Sample 4 426 63.4 <0.0001 4 387 152 <0.0001 4 386 122 <0.0001 SS extraction 3 28 2.1 0.123 3 25.01 9.2 0.0003 3 25.01 2.6 0.074 SS quantification 3 27.95 5.6 0.004 – – – – 3 25.01 25.0 0.443 Starch extraction – – – – 2 26.01 3.1 0.064 2 26.02 0.12 0.837 Starch quantification – – – – 4 24 1.3 0.306 4 24.01 1.9 0.141 Sample × SS extraction 12 426 11.6 <0.0001 12 387 5.1 <0.0001 12 386 11.7 <0.0001 Sample × SS quantification 12 426 7.54 <0.0001 – – – – 12 386 386 <0.0001
Sample × Starch extraction – – – – 8 391 4.7 <0.0001 8 390 3.5 0.0007
Sample × Starch quantification
– – – – 16 383 15.0 <0.0001 16 382 10.7 <0.0001
Relative differences within a single laboratory can be consistent and meaningful (Objective 2)
The Spearman rank correlation analysis of sample pairs showed that laboratory ranks were fairly consistent among the five sam-ples for starch, but less so for soluble sugars and total NSC. These results suggest that relative differences among treatments and species within a laboratory can be meaningful. While we did not explicitly test how laboratories would perform using the same substrate with two different NSC concentrations, preserv-ing laboratory rank across such a diverse sample cohort was a significant finding in this experiment. Therefore, an assessment
of relative responses of different treatments to a control may be robust, especially for starch, and meaningful within and between studies.
Method differences explained only some of the variability among laboratories, but meeting Objective 1 compromised our ability to identify these differences (Objective 3)
Differences among methods, as captured by our extraction and quantification group approaches, were generally small relative to the differences among laboratories. However, fulfilling our Figure 3. Differences in LSM for all samples and for individual samples (EGL, PEN, PPL, EGR, EGS) for the extraction and quantification methods for soluble sugars, starch and total NSC show that method category generally had little effect on NSC difference, perhaps because of high within-method variance. Error bars are standard errors for the LSM. Total soluble sugars results are grouped by sugar extraction (a) and quantification (f) method. Starch results are grouped by sugar (b) and starch (d) extraction method and starch quantification method (h). Total NSC results are grouped by sugar (c) and starch (e) extraction methods, and for sugar (g) and starch (i) quantification methods. Significant differences (*) among methods within each tissue were assessed with Tukey–Kramer test (α = 0.05).
primary objective (to identify whether NSC estimates could be compared among laboratories) compromised the ability to iden-tify differences between methods. We can interpret these results to mean that: (i) real differences among methods would exist, and variation among laboratories would be minimized if the laboratories using the same method followed the same proto-cols exactly for extraction and quantification; or (ii) NSC quanti-fication is such a highly variable and sensitive procedure that even minor differences among laboratories’ procedures not cap-tured in an explicit protocol would cause variation among labo-ratories using the same method. We suspect that both explanations play a role in the low ability of ‘methods’ to explain laboratory differences.
Variation in protocols within a method category may have contributed to the lack of significant differences among meth-ods. For example, the number, temperature and duration of extractions and the method of starch gelatinization (Table 2, Tables S1 and S2 available as Supplementary Data at Tree Physiology Online) are known to affect soluble sugar and starch estimates ( Yemm and Willis 1954, MacRae et al. 1974, Rose et al. 1991, Johansen et al. 1996, Shi et al. 2002, Gomez et al. 2003, Kim et al. 2003). We were surprised at the variability among laboratories in these factors, and even laboratories using the same ‘method’ differed in these important factors. Variability of method application within a method category yielded little or no replication for these factors, and limited the evaluation to broad method categories. As an example of how these factors might contribute to differences among laboratories, yet not appear in our methods analysis, we found that higher tempera-ture increased sugar concentration for MCW extracts in two of the four samples (Figure 4).
The lack of differences among soluble sugar extraction method categories (P = 0.12, Table 4), coupled with the small differences between different methods within a single laboratory (Figure 4), suggests that variation in the application of extrac-tion methods across laboratories was larger than the effect of the extraction solvent. However, despite laboratory differences in protocol, we could still detect an effect of soluble sugar quan-tification methods on sugar estimates (Figure 3, P = 0.004). These differences may result from the fact that different methods quantify different sugars. This result suggests that systematic differences in quantification, especially between colorimetric and HPLC-based methods, might be interpreted and possibly corrected.
Figure 4. Means and standard errors for soluble sugars by extraction method for samples processed in one laboratory and using the same quantification method. Results show that extraction method can affect estimates especially for PEN and PPL samples. In all samples MCW-based methods produced consistently lower estimates than alcohol-based methods. Different letters indicate significant difference at α = 0.05
according to F-protected LSD test.
Figure 5. Effect of microwaving samples <5 g at 800 W on amount of glucose + fructose (Gluc + Fruc), sucrose (Suc), starch and total NSC for foliar (a) and twig (b) samples of P. edulis. See Method S4 available as Supplementary Data at Tree Physiology Online for details on the method. At 0 and 90 s microwaving time, sucrose hydrolyzing and starch deb-ranching enzymes are still active, leading to lower sucrose levels, higher glucose + fructose levels and higher starch levels because debranching enzymes make starch more accessible to the enzymatic assay. At 180 s and above, enzymes are deactivated, yielding consistent sucrose and glucose + fructose. At 300 s, starch starts to gelatinize, again making it more accessible to the assay. Orthogonal contrasts for trend with micro-waving time: glucose + fructose, quadratic for leaf and twig, P < 0.05; sucrose, linear for leaf and twig, P < 0.001; starch, quadratic for leaf and twig, P < 0.01; total NSC, quadratic for leaf and twig, P < 0.01.
We also did not assess the effect of other factors such as air temperature, level of expertise of the person conducting the analyses or quality of the laboratory equipment. Such factors might contribute to the variability among laboratories, even for those using the same general method, but they have not been assessed.
Method effects differ by sample (Objective 3)
Non-structural carbohydrate components exist within a complex and varied chemical matrix and need to be extracted from this matrix for analysis. Procedures to extract NSC from the matrix can free the target compound, but also convert other compounds into the target. Maximizing the extraction while minimizing the conversion is the goal of procedures, but may not always occur ( Hansen and Møller 1975, Thompson and Ellison 2005, Santiago da Silva et al. 2012, Huang and Fu 2013). In our study, soluble sugar estimates for Eucalyptus and Prunus leaves differ with the sugar quantification method (colorimetric ods generate higher estimates than do HPLC or enzymatic meth-ods, Figure 3; see Note S1 available as Supplementary Data at
Tree Physiology Online). Clearing interfering compounds from the solvent might minimize these effects ( Thompson and Ellison 2005), as would avoiding acid use during sugar extraction ( Chow and Landhäusser 2004). The significant interactions between sample type and methods also suggest that different extraction and quantification protocols will give different results for NSC in samples with different matrices.
How can we make quantitative, comparable estimates of the true value of NSC components?
Determination of the role and regulation of NSC is governed by what we can measure ( Dietze et al. 2014). Our study demon-strates that laboratories and methods produce widely different and non-comparable estimates and progress in plant science will be limited until this problem is resolved, although relative differ-ences in NSC have been and will continue to be important for many questions. Being able to compare between and within studies and knowing the true value are essential for a mechanis-tic understanding of NSC pools and fluxes ( Ryan 2011), espe-cially for questions about the role of NSC in ecosystem Figure 6. Instructions for sample collection, handling, preparation and sugar and starch extraction for reference method.
productivity, stress responses and plant adaptations. Relative differences within and across studies are valuable for testing many hypotheses, and this study shows that these have values, particularly for starch.
Comparability might be solved using two approaches: either adopt a standard method and report values for certified refer-ence material (CRM) or embrace a central laboratory for all pro-cessing. A standard method would require a detailed and easily applied protocol, from sample collection to quantification, so that any laboratory can reproduce values for the CRM. Another solu-tion to the comparability problem would be to establish and adopt a central laboratory for all NSC analyses, similar to the calibration laboratories of the Global Atmosphere Watch pro-gram (http://www.wmo.int/pages/prog/arep/gaw/qassurance. html) or the US National Atmospheric Deposition Program (http://nadp.sws.uiuc.edu). A central laboratory could use differ-ent methods for samples of differdiffer-ent characteristics and still maintain comparability among samples. Both approaches can be criticized for the lack of flexibility and freedom they impose on the scientific community, and raise the practical issue of what to do with the existing costly analytical equipment. Adopting a standard method for NSC determination in plants would likely be more practical than establishing a central facility, but would impose an investment for laboratories to comply with the selected standard. Adoption of either approach would depend on the cooperation of the science community.
Our results provide some insights into which methods might give the most homogenous results (i.e., those less affected by random error). High performance liquid chromatography was the quantification method with the least variable results, whereas colorimetric assays exhibited more variability (Figure 1, Figure S1 available as Supplementary Data at Tree Physiology Online). High performance liquid chromatography methods (including HPAEC-PAD and 1H-NMR) are increasingly chosen by
laborato-ries because of (i) their high resolution, even with a small amount of sample and (ii) reproducibility due to a close control of parameters affecting the efficiency of separation and quanti-fication ( Giannoccaro et al. 2008, Raessler et al. 2010). How-ever, the HPLC process is time-consuming, laborious and expensive—especially for carbon balance studies where only the total amount of glucose equivalents may be of interest. In addi-tion, HPLC still relies on sugar and starch extractions that vary substantially with solvent and other method details.
Colorimetric methods are less expensive than other tech-niques, rapid and can detect all types of sugars, and therefore are still widely used; nevertheless, they have major drawbacks, including: (i) the necessity to prepare a calibration curve using a series of standards because different carbohydrates give differ-ent absorbance responses (see Dubois et al. 1956, Hall 2013); (ii) the use of toxic and dangerous chemicals; and (iii) possible interference of metabolites with the concentrated sulfuric acid ( Ashwell 1957).
The enzymatic method also produced relatively consistent results and allowed for the measurement of individual sugars. This method requires expertise for timing of enzyme additions, checking for cross contamination (converting non-targeted oli-gosaccharides) and maintenance of a precise pH for NADPH. In this study, three laboratories using the enzymatic method reported negative results for sucrose (Figure 1; Table S1 avail-able as Supplementary Data at Tree Physiology Online). Negative results are not normally reported and are usually assumed to be zero, but indicate that something went wrong in the assay. This might be caused by inappropriate extraction (hydrolyzing sucrose into glucose and fructose) or too low pH (leading to NADPH degradation following the addition of invertase, the enzyme enabling the quantification of sucrose). To solve these issues, cross- validation with HPLC or NMR should be performed each time a new sample type is analyzed.
Best practice in other plant chemical analyses generally use CRMs to ensure comparability of results (e.g., Quevauviller et al. 1994, Clement et al. 1996, Saunders et al. 2004). Unfor-tunately, CRM for carbohydrates do not currently exist. Many laboratories use pure sugar and/or starch standards (n = 15 in our study) to define recovery of known concentrations of spe-cific sugars. However, these standards do not account for the effect of plant matrix which may generate incomplete carbohy-drate extraction or yield compounds that interfere with quantifi-cation ( Emons et al. 2004). A CRM is accompanied by a certificate, which specifies property values of the material: before the certificate is delivered, a procedure establishes material traceability to an accurate realization of the unit, and for which each certified value is accompanied by an uncertainty at a stated level of confidence ( Emons et al. 2004). Certified reference materials are a key element of analytical data quality assurance and are used for four main purposes: (i) instrument calibration; (ii) method validation, in particular for assessment of the reliability of a method; (iii) ensuring the traceability of measurement results; and (iv) statistical quality control ( Emons et al. 2004). Certified reference material for NSC will likely require several samples with different matrices, sugar and starch concentrations. Integration of CRMs into NSC analysis should be standard practice to improve comparability among laboratories.
In addition to the difficulty of quantitatively assessing soluble sugars and starch, studies assessing NSC may miss important components that could represent a substantial fraction of NSC. Most studies assessing NSC have focused on analyzing the three ‘major’ sugars (sucrose, glucose, fructose) and starch, and assume that this pool represents the NSC available to the plant— a reasonable assumption for most trees ( Hoch et al. 2003, Hoch and Körner 2005). A few studies suggest that we should some-times look deeper. For example, sorbitol is found in high concen-trations in PPL ( Zhang et al. 2013) and quercitol in droughted Eucalyptus astringens leaves ( Arndt et al. 2008), and raffinose
concentration was greater than that of starch in birch buds ( Ruuhola et al. 2011).
Conclusions and recommendations for the future
We conclude that absolute values of NSC, total soluble sugars, starch and individual sugars cannot be directly compared among laboratories, even among laboratories that use a method in the same method category. Differences relative to a control may have value with a single laboratory and for comparisons among laboratories for starch, but less so for total NSC and for soluble sugars. Differences in absolute values among laboratories were poorly related to our broad method categories, but many factors that may contribute to different estimates could not be assessed in our analyses.Our study shows that developing methods to produce reliable, absolute and comparable estimates of NSC and its components in plant tissue will be a serious challenge because of high vari-ability in methods currently in use, lack of absolute standards and little information about the causes of the high variation in estimates among laboratories. Our team discussed the benefits and pitfalls of proposing a standard method for sample collec-tion, storage, processing, extraction and quantification as a first step towards achieving comparability among laboratory esti-mates. Team members mostly supported the publication of a standard method (although there was less agreement about the particular method), but there were also strong arguments against such an approach. The small differences among method catego-ries and the high variability of laboratory processes within the method categories in this study suggest that adopting a stan-dard method would have a higher likelihood of producing com-parable estimates across studies. A standard method would at least insure that differences among studies are not because of methodological differences. However, neither this study nor any other of which we are aware has identified a ‘best’ method. Arguments against proposing a standard method are (i) that we do not have the data to support selecting any particular method, (ii) laboratories that change methods will lose a connection to past studies, (iii) laboratories that do not adopt the proposed standard method risk having difficulty in publishing their results, and (iv) there was disagreement over what the proposed method should be—with the largest disagreements over the sample size (50 mg samples processed in ∼10 ml vials versus 10 mg samples processed in standard 96-well plates) and sam-ple storage prior to processing (to freeze or not).
Recognizing the different viewpoints of our team members, to help the research community move towards NSC analysis that is comparable both among and within laboratories, we propose:
●
● A reference method for sample collection and storage, sample processing, sugar extraction, starch extraction and quantifica-tion. We use the term ‘reference method’ to identify the
method as one that can indicate comparability among labora-tory estimates, as distinct from a ‘standard method’ that might imply a ‘best’, fully vetted method. Our data showed that water extractions gave the least variability among laboratories for soluble sugar extraction (see Figure S2A available as Sup-plementary Data at Tree Physiology Online), and that the α-amylase + amyloglucosidase extractions gave the least vari-ability for starch (see Figure S3A available as Supplementary Data at Tree Physiology Online). Although water is the optimal extraction solvent for low molecular weight sugars and exhib-ited the least variability, it can also dissolve interfering hydro-philic polysaccharides and proteins. Extraction in aqueous alcohol can minimize this problem, and provide a high recov-ery of low molecular weight sugars. Standardization of alco-hol strength and the number, temperature and duration of extractions is important to minimize variability in the results (see Figure S2a available as Supplementary Data at Tree Physiology Online). Using these results, the discussion about methods in Note S2 available as Supplementary Data at Tree Physiology Online, and the results for microwave duration and intensity (Figure 5) and particle size (see Figure S4 available as Supplementary Data at Tree Physiology Online), we recom-mend the method detailed in Figure 6 be adopted as a refer-ence method. HPLC and variants showed the least variability among quantification methods because of its precision, but perhaps also because HPLC procedures incorporate filtration to remove interfering compounds. However, the reference method does not include a filtration or quantification step. We ended the reference method with extraction, because our study does not provide the data to support a recommendation for the adoption of the expensive HPLC quantification and fil-tration steps.
●
● That laboratories adopt the reference method for sample col-lection and storage, sample processing, sugar and starch extraction and filtration, or laboratories retain their current methods but analyze a portion of a study’s samples with the reference method for sample collection and storage, sample processing, sugar and starch extraction and filtration. Sam-ples selected for analysis with the reference method should span the range of NSC values identified using the laborato-ry’s current methods and results should be reported in publi-cations. Laboratories retaining methods different from the reference method should provide a rationale for their use and a full description of the method. Following either of these recommendations would aid both in-house procedures and comparability among studies.
●
● Researchers should implement standard procedures of inter-nal quality control and include a detailed description of this procedure to the method. Analytical results should evaluate and present ‘measurement uncertainty’, given by the sample replicates, starch and sugar standards and NSC values for the peach leaf standard (SRM 1547). While SRM 1547 does not
have certified estimates for NSC and its components, it is a widely available and standardized sample.
●
● Certified reference materials and laboratory inter-calibration should be developed and applied in all NSC analyses. The development of an appropriate range of CRMs will require coordination within the research community to ensure that the CRMs represent the range of tissues and matrices of interest. Once CRMs have been developed, an indication of quality control should be published with all NSC results, to aid in more effective among-laboratory comparisons.
●
● The research community, including ecologists and biochem-ists, should work to develop a small set of standard methods that are appropriate for particular samples and questions and test the reference method.
The problem we have highlighted here, that NSC estimates are not comparable among different laboratories, will likely limit understanding of plant response to environmental stress. While our study focused on NSC determination in woody vegetation, a similar range of methods is used in non-woody species (e.g., Campo et al. 2013, Jaikumar et al. 2014, Kagan et al. 2014, King et al. 2014), and our results are likely to be relevant to the broader plant science community. A more unified approach to NSC analysis and standardization of methods will contribute to better understanding of plant responses to environment and management.
Supplementary data
Supplementary data for this article are available at Tree Physiology Online.
Acknowledgments
A.G.Q. is grateful to members of the participating laboratories for their work and co-operation. We would like to thank Marc Vandame, Nicole Sonderegger, Laurianne Rouan, Mathieu Moreau, Alieta Eyles, Elena Lahoz, Leo Goudzwaard, Arjen van Peppel, Efrat Neuhaus, Julie Lavergne, Catherine Deborde, Britta Jahn-Humphrey, Dugald Close and Widad Al-Shawi for their help and contribution with the laboratory analyses.
Conflict of interest
None declared.Funding
M.G.R. was funded by McMaster fellowship (1158.C). S.P. was funded by Juan de la Cierva contract (MCI project) and project ARBALMONT/786-2012 (OPAN, MAAMA, Spain). F.P. was funded by Fondecyt 11121175. Ü.N. and M.T. were funded by
the Estonian Ministry of Education and Science, grant IUT-8-3. N.G.M. and L.T.D. were funded by DOE-BER. H.D.A. was funded by LANL-LDRD. J.M.-V. was funded by the Spanish Government (CGL 2010-16376). S.H. was funded by the Montana Institute on Ecosystems’ Graduate Enhancement Award from NSF EPS-CoR Track-1 NSF-IIA-1443108. Valuable comments from Dr Mauricio Mencuccini (University of Edinburgh), Dan Binkley (Colorado State University) and two anonymous reviewers were also greatly appreciated.
References
Adams HD, Germino MJ, Breshears DD, Barron-Gafford GA, Guardiola-Claramonte M, Zou CB, Huxman TE (2013) Nonstructural leaf carbo-hydrate dynamics of Pinus edulis during drought-induced tree mortality reveal role for carbon metabolism in mortality mechanism. New Phytol 197:1142–1151.
Ainsworth EA, Rogers A (2007) The response of photosynthesis and stomatal conductance to rising [CO2]: mechanisms and environmental interactions. Plant Cell Environ 30:258–270.
Ainsworth EA, Davey PA, Bernacchi CJ et al. (2002) A meta-analysis of elevated [CO2] effects on soybean (Glycine max) physiology, growth and yield. Glob Change Biol 8:695–709.
Anderegg WRL, Anderegg LDL (2013) Hydraulic and carbohydrate changes in experimental drought-induced mortality of saplings in two conifer species. Tree Physiol 33:252–260.
Arndt SK, Livesley SJ, Merchant A, Bleby TM, Grierson PF (2008) Quer-citol and osmotic adaptation of field-grown Eucalyptus under seasonal drought stress. Plant Cell Environ 31:915–924.
Ashwell G (1957) Colorimetric analysis of sugars. Methods Enzymol 3:73–105.
Barry KM, Quentin A, Eyles A, Pinkard EA (2012) Consequences of resource limitation for recovery from repeated defoliation in Eucalyptus
globulus Labilladière. Tree Physiol 32:24–35.
Bonhomme M, Rageau R, Lacointe A, Gendraud M (2005) Influences of cold deprivation during dormancy on carbohydrate contents of vege-tative and floral primordia and nearby structures of peach buds (Prunus persica L. Batch). Sci Hortic (Amsterdam) 105:223–240. Bryant JP, Chapin FS III, Klein DR (1983) Carbon/nutrient balance of
boreal plants in relation to vertebrate herbivory. Oikos 40:357–368. Campo L, Monteagudo AB, Salleres B, Castro P, Moreno-Gonzalez J
(2013) NIRS determination of non-structural carbohydrates, water soluble carbohydrates and other nutritive quality traits in whole plant maize with wide range variability. Span J Agric Res 11:463–471. Chapin FS, Schulze E, Mooney HA (1990) The ecology and economics
of storage in plants. Annu Rev Ecol Syst 21:423–447.
Cheng J, Fan P, Liang Z, Wang Y, Niu N, Li W, Li S (2009) Accumulation of end products in source leaves affects photosynthetic rate in peach via alteration of stomatal conductance and photosynthetic efficiency. J Am Soc Hortic Sci 134:667–676.
Chow PS, Landhäusser SM (2004) A method for routine measurements of total sugar and starch content in woody plant tissues. Tree Physiol 24:1129–1136.
Clement R, Keith L, Siu K (1996) Reference materials for environmental analysis. Lewis Publishers, Boca Raton, FL.
Dichio B, Xiloyannis C, Sofo A, Montanaro G (2007) Effects of post-harvest regulated deficit irrigation on carbohydrate and nitrogen par-titioning, yield quality and vegetative growth of peach trees. Plant Soil 290:127–137.
Dickman LT, McDowell NG, Sevanto S, Pangle RE, Pockman WT (2015) Carbohydrate dynamics and mortality in a piñon-juniper woodland