R o a d T r a f f i c N o i s e L C A M e t h o d o l o g y
LCA Methodology
[
i ill 84 iii: i !7
i;
[ )i 84
ii iiii ii:i
!
A M e t h o d to Include in LCA Road Traffic Noise and its Health Effects
R u e d i M i i l l e r - W e n kInstitut f Wirtschaft u Oekologie, University of St.Gallen, Tigerbergstr. 2, CH-9000 St. Gallen [email protected])
DOh http://dx.doi.oroJ10.1065Bca2003.12.143 Abstract
Background, Aims and Scope. Transport noise represents an en- vironmental problem that is perceived by humans more directly than the usual chemical emissions or resource uses. In spite of this, traditional LCA applications still exclude noise - probably due to the unavailability of an appropriate assessment method. In order to fill the gap, this article presents a study proposing a new computational procedure for the determination of health impairment resulting from noise emissions of road vehicles. Main Features. The magnitude of health impairment due to noise is determined separately for each vehicle class (cars, trucks,..) and is calculated per vehicle-kilometre driven during the day or at nighttime on the Swiss road network. This health impair- ment is expressed in cases of sleep disturbance or communica- tion disturbance, and furthermore aggregated in DALY (Dis- ability Adjusted Life Years) units representing the number, duration and severity of the health cases. The method is model- ling the full cause-effect chain from the noise emissions of a single vehicle up to the health damage. As in some other mod- ern concepts of environmental damage assessment, the analysis is subdivided into the four modules of fate analysis, exposure analy- sis, effect analysis and damage analysis. The fate analysis yielding the noise level increment due to an additional road transport over a given distance is conducted for transports with known or with unknown routing, the latter case being more important in LCA practice. The current number of persons subject to specific back- ground levels of noise is determined on the basis of the road traf- fic noise model, LUK, developed by the Swiss canton of Zurich. The number of additional cases of health impairment due to in- cremental noise is calculated with data out of the Swiss Noise Study 90. An assessment of the severity of sleep disturbance and communication disturbance, in comparison to other types of health impairment, was performed by a panel consisting of physicians experienced in the field of severity weighting of disabilities. Results and Discussion. The quantities of health cases and of DALY units are given per 1'000 truck or car kilornetres on Swiss roads, and the range of the confidence interval is estimated. A plausibil- ity check is made by a quantitative comparison of the results with health damage due to traffic accidents in Switzerland, and with health damage due to traffic noise in the Netherlands.
Condusions and Outlook. The method is ready for use in LCA practice. However; the temporary solution for transports outside of Switzerland should be replaced by feeding country specific data into the fate and exposure model. Further; a comparable assess- ment for rail transport would facilitate decisions on road or rail transport. A decisive element of transport noise assessment is the availability of robust links between noise level and medical condi- tions. Whilst the number of the corresponding studies is sufficiently large, a design for better pooling of study results is desirable. Keywords: Communication disturbance; DALY; disability ad- justed life years; dose-effect characteristics, exposure-response relationship; interference with speech communication; noise ef- fects; road traffic noise; sleep disturbance; vehicle noise
1 Background, Aims and Scope
Noise is a type o f environmental emission leading to ad- verse effects on a large percentage o f the h u m a n p o p u l a t i o n . Whilst noise f r o m stationary e q u i p m e n t is m o s t l y kept en- closed by building walls, noise from mobile e q u i p m e n t (road vehicles, aircraft, railways) p r o p a g a t e s into the s u r r o u n d - ings. Noise is generally a c k n o w l e d g e d to be a severe a n n o y - ance to as m u c h as 2 0 - 3 0 % of the p o p u l a t i o n in m a n y E u r o p e a n countries, w h e r e b y r o a d noise is seen to clearly demonstrate the highest share o f people affected (Eurostat
1995:288-289).
Further, it is clear t h a t this noise does n o t merely p r o d u c e t e m p o r a r y a n n o y a n c e , but is a cause o f last- ing health impairments ( W H O2000:20-35,
UBA 2003). In spite of this, m o s t L C A case studies so far neglect the im- pacts of noise: if processes to be analysed include a r o a d trans- port activity, a typical L C A w o u l d only include the m o t o r ' s chemical emissions and energy consumption. The reasons for this neglect are mainly the unavailability of appropriate noise assessment methods (Guin6e2000:68-69),
as well as the opin- ion that noise effects are very local and difficult to interpret in relation to other impact categories (Gorree 2000:26). H o w - ever, a remarkable attempt to assess noise effects in L C A (Lafleche 1997) was made for the case of car and truck trans- ports on the h i g h w a y from Milan to Bologna: In this report, the n u m b e r of persons currently living beyond legal noise thresholds is counted, and the resuk is imputed to the single vehicles participating in the current traffic.This article describes a recently published m e t h o d (Mtiller-
Wenk 2002) for a quantitative assessment in L C A of noise impacts on h u m a n health originating f r o m road vehicle noise. An a d a p t a t i o n to rail noise is planned.
The method starts out f r o m the following data: transport dis- tance in kin, quantity transported, category of vehicle, time (day/night) and country of transport. T h e L C A user c a n nor- mally made available such data for the direct c o m p o n e n t s and materials entering into his functional unit, whilst the data can be derived for preliminary products f r o m accessory informa- tion given by generic LCI databases. The numerical result pro- duced by the m e t h o d is the n u m b e r of cases per relevant type of health impairment, suitable as midpoint category indicator. In addition, the health damage is also expressed in aggregable DALY (Disability Adjusted Life Years) units, a well k n o w n health damage indicator at endpoint level.
2 The Cause-effect Chain of Road Vehicle Noise
There is a t e n d e n c y in m o d e r n L C A m e t h o d o l o g y t o link the various types of emissions to their consequences by means of cause-effect chains and with respect to h u m a n health im-
7 6 Int J LCA 9 (2) 76 - 85 (2004)
LCA Methodology
Road Traffic Noise
pairments. The procedure for building up the links of the cause-effect chains is comparatively well known in the case of toxic gas emissions:
1. First chain link: fate analysis describes the increase of the pollutant
concentration in the environment, caused by the emission quantity of
the toxic substance as registered in the LCI of the functional unit; 2. Second chain link: e x p o s u r e analysis shows how many people
are affected by such changes in concentration of the toxic sub- stance, a n d to w h a t extent;
3. Third chain link: effect analysis describes the incremental effect on health that is likely to occur if humans are exposed to a certain concentration increase of the substance during a certain period; 4. Fourth chain link: d a m a g e analysis describes the total extent of
damage to human health that is represented by the above-men- tioned health effects.
This concept for chemical emissions may also be applied to noise emissions, w h e r e b y the pollutant concentration is re- placed by the time-averaged level of noise. However, the situation with noise is m o r e complex than that with sub- stances. First, the reverberation time of a sound is very short in comparison to the life time of the usual toxic chemicals, so that the resulting noise level from all sources varies heavily in time and f r o m location to location. It is therefore difficult to determine the noise level at the ear of every individual and the contribution of a single source to this noise level. Second, the dependence of health impairment upon a given level of noise is substantially conditioned by structural ele- ments of the noise as well as by the circumstances of life a n d the attitudes of the persons involved. The variance of noise effects f r o m person to person is therefore larger than in the case of toxic substance effects.
The corresponding noise-specific problems - complicating the development of a cause-effect chain from road vehicle noise to health d a m a g e - are approached here by the fol- lowing procedures:
A) Instead of the actual physical noise, the energy-equiva- lent continuous sound-pressure level LAeq,T, averaged over all daytime or nighttime hours of period T (= 1 year), is used for representing the real noise situation at a given location. LAeq averaged over 1 year is the most c o m m o n acoustical measure and a reasonably adequate indicator of the c o m - plex p h e n o m e n o n of a real noise - although other acousti- cal measures m a y be preferable for expressing specific noise structures in the context of specific health impairments. B) The current noise b a c k g r o u n d situation for each surface element of a geographical region is calculated by available computer models on the basis of recorded traffic densities and road/terrain properties. Combining this with maps of residential structures yields the current distribution of the population over the different noise levels, expressed in LAeq. C) The assessment of the noise effects due to an additional journey of a road vehicle is made depending on the available routing information: If the precise routing of the vehicle's jour- ney is known, procedure B) can be repeated with the current traffic frequencies increased by 1 unit on all roads actually used by the vehicle. The comparison of the two calculations according to B) then yields the tiny shift of the population distribution towards higher noise levels due to the vehicle's journey. This shift to higher noise levels concerns only the fraction of population that lives along the vehicle's route.
If information on the precise routing of the journey is un- available, the procedure is different. The journey is then in- terpreted not as an isolated local event but rather as a con- tribution to the annual traffic increase over the whole regional road network. Consequently, the calculation carried out does not express the actual physical noise increase along the vehicle's unknown route, but rather a calculational noise increase over the whole road network during a full year. Obviously, this calculational increase of the year-averaged noise level is ex- tremely small. On the other hand, it relates to the whole road network and not only to a few roads.
D) The additional n u m b e r of health cases due to a noise increase is calculated on the basis of dose-effect characteris- tics. These are developed f r o m social surveys or epidemio- logical research. This increase of health effects has the for- m a t 'additional cases per unit of noise (LAeq) increase'. As noise m a y cause various types of health effects; an aggrega- tion of these health effects into a total damage can be ac- complished by weighting the various health impairments. Consequently, the cause-effect chain of road transport noise - developed here for the p u r p o s e of life-cycle impact assess- ment - has the structure of Fig. 1. It is important to notice that the concept according to Fig. 1 does not require any knowledge on the vehicle's exact routing, but it can use the corresponding i n f o r m a t i o n if available. In LCA practice, information on the precise route of a r o a d transport (and of the vehicle's return to its starting point) is mostly not avail- able, e.g. because t r a n s p o r t s are combined for better use of the vehicle's loading capacity and drivers adapt the routes according to m o m e n t a n e o u s traffic situations. An assessment procedure for u n k n o w n routes is therefore necessary. Sur- prisingly, the calculation of the 'calculational' noise increase of a transport w i t h o u t routing information is much simpler than the calculation of the actual noise increase of a trans- port with a precisely k n o w n routing, as the following sec-
Additional journey of a vehicle with vehicle-specific noise emissions
,L Fate analysis
$
Calculational noise increase LAeq over whole road network
,L
] x sura ana'ysis I
$Shifting of population distribution to slightly higher LAeq levels, due to calculational noise increase
J.
I Effect analysis I
J.
Number of additional cases per type of health impairment,
due to shifting of population distribution to
slightly higher LAeq levels
$
I Damage analysis I
J.
Comprehensive damage to human heath due to the
additional vehicle journey, based on summation of additional health cases weighed by
disability weight per type of health impairment Fig. 1 : Cause-effect chain for road transport noise
Road Traffic Noise
LCA Methodology
tions will demonstrate. In consequence, the former m a y be preferred even where precise routing is available from the life-cycle inventory. This text therefore focuses on the case of road transports w i t h o u t routing information.
In the following sections, the four modules of the analysis ac- cording to Fig. 1 will be developed for the case of the Swiss road network. In addition, comments will be given regarding the application of the concept to other European countries. 3 Fate Analysis in Detail
Several noise models are available which calculate the year- averaged noise level LAeq of a road, starting from data on the average number of vehicles per vehicle type, the average speeds and the properties of the road (gradient, type of surface). In a second step, such models also calculate the noise attenuation between road axis and the facades of buildings located in the proximity of the road, so that the noise level LAeq can be determined at the outside of any building. In Switzerland, the model according to Fig. 2 is used most widely.
According to Fig. 2, the noise level of the road LAeq is com- posed of the car noise LE1 and the truck noise LE2. The truck noise LE2 depends on the traffic volume of the trucks N2, on their average speed V2, and the slope of the road i. Such noise models can be used to calculate the actual noise level on roads on the basis of current traffic quantities N1 (cars) and N2 (trucks). However, they also are suitable for the calculation of the tiny noise level increase DeltaLeq caused by the increase by 1 unit of the average hourly number of ve-
Input variables:
9 N1 Average number of Type 1 vehicles (cars, vans, light motorcycles) per hour
9 N2 Average number of Type 2 vehicles (trucks, buses, tractors, heavy motorcycles) per hour
9 Vl, V2 average vehicle speed in km/h 9 i gradient of road in %
Simplifying assumptions:
9 N1 + N2 are higher than 100 vehicles/hour (will be revised later)
9 Road surface is normal asphalt
9 No. of vehicles is the same in both directions of a road Calculation of annual mean LAeq at a point +1 metre from the centreline of the road:
LAeq = 10 x log(10 ~ • + 100.1 • where: LE1 = E1 + 1 0 x log(N1) LE2 = E2 + 10 x log(N2) E1 = max [{12.8 + 19.5 x log(V1)}, {45 + 0.8 x (0.5 x i -2)}] E2 = max [{34 + 13.3 x log(V2)}, {56 + 0.6 x (0.5 x i -1.5)}]
Fig. 2: Calculation of average annual LAeq on a road, as described in (SAEFL 1991)
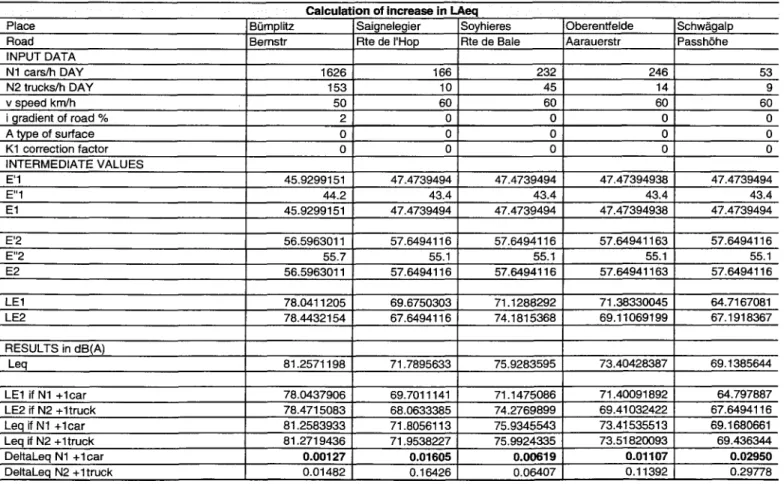
hicles on a road. A practical way to do this is to calculate LAeq first with N1+1 cars per hour, and then with NI+0 cars, whereby the difference of these two LAeq values yields the value of DehaLeq. Table 1 shows such calculations for 5 examples of Swiss roads with different traffic and road properties.
Table 1: Examples of calculations of increases in sound level for additional traffic during the day Calculation of increase in LAeq
Place Oberentfelde Road INPUT DATA N1 cars/h DAY N2 trucks/h DAY v speed krn/h i gradient of road % A type of surface K1 correction factor INTERMEDIATE VALUES E'I E"I E1 E'2 E"2 E2 LE1 LE2 RESULTS in dB(A) Leq LE1 if N1 +1car LE2 if N2 +1truck Leq if N1 +1car Leq if N2 +1truck BOmplitz Bernstr 1626 153 50 45.9299151 44.2 45.9299151 56.5963011 55.7 56.5963011 78.0411205 78.4432154 81.2571198 78.0437906 78.4715083 81.2583933 81.2719436 Saignelegier Rte de I'Hop 47.4739494 Soyhieres Rte de Bale 166 232 10 45 60 60 0 0 0 0 0 0 47.4739494 43.4 47.4739494 57.6494116 55.1 57.6494116 71.1288292 74.1815368 75.9283595 71.1475086 74.2769899 75.9345543 75.9924335 0.00619 0.06407 43.4 47.4739494 57.6494116 55.1 57.6494116 69.6750303 67.6494116 71.7895633 69.7011141 68.0633385 71.8056113 71.9538227 DeltaLeq N1 +1 car 0.00127 0.01605 DeltaLeq N2 + 1truck 0.01482 0.16426 Aarauerstr Schw&galp i Passh6he 246 53 14 9 60 60 0 0 0 0 0 0 47.4739494 43.4 47.4739494 57.6494116 55.1 57.6494116 64.7167081 67.1918367 69.1385644 64.797887 67.6494116 69.1680661 69.436344 0.02950 0.29778 47.47394938 43.4 47.47394938 57.64941163 55.1 57.64941163 71.38330045 69.11069199 73.40428387 71.40091892 69.41032422 73.41535513 73.51820093 0.01107 0.11392
78
Int J LCA 9 (2) 2004LCA Methodology
Road Traffic Noise
An inspection of Table 1 shows that DeltaLeq for 1 addi- tional car per hour circulating on a road varies within wide limits (bold type): T h e noise increase DeltaLeq is small for a main road with high traffic volume (Biimplitz), whilst it is 23 times higher for the least important road of the table (Schw/igalp). Remote by-roads with a few vehicles per hour only would progressively show increasing DeltaLeq values. In addition to traffic density, DeltaLeq for 1 additional car per hour is also influenced by average vehicle speed and by road properties, but this influence is less important in practice. Due to this strong dependency on background traffic densi- ties of the DeltaLeq for I additional vehicle per hour, it seems to be impossible to determine a meaningful noise increase DeltaLeq, if exact routing of this vehicle is not known. A solution for this problem can be found if the transport to be assessed is not considered as an isolated single event, but rather as a tiny part of the yearly increase of the traffic den- sity over all portions of the road network of a region or country. Statistics show that the yearly traffic increase of individual roads - as a first a p p r o x i m a t i o n - is proportional to the traffic level of the preceding year: If a road with 100'000 vehicles per day gets an annual increment of 2000 vehicles per day, the corresponding increment for a minor road with a daily circulation of 1000 vehicles would only be 20 vehicles. In reality, this is not entirely true: the traffic increase from year to year, in percent of previous year, is generally higher on main roads connecting large cities than on by-roads in the country side. Further, new roads deviate traffic from neighbouring roads so that during some time the former show traffic increases above average, the latter below average. Nevertheless, it is an admissible approximation to consider annual traffic increases of individual roads as pro- portional to their pre-existing traffic volume. Proportionality of traffic increase to pre-existing traffic volumes on all ele- ments of the road network means that the annual total of additional vehicle-kilometres is spread over the whole road network according to the traffic distribution of the past year. It is logical to proceed the same way with the amount of vehicle-kilometres required for a product to be assessed by LCA, if the routing of the corresponding transport is un- known: Instead of an arbitrary choice of a route, it is more adequate to stretch these vehicle-kilometres over the whole road network of the corresponding region or country. This way, the transport is seen as part of the annual traffic in- crease, and its environmental effects can be determined on the basis of this annual traffic increment.
But how can one n o w calculate the noise increase LAeq over the whole regional r o a d network, as caused by 1000 ve- hicle-kilometres of an LCA case, spread over this network? Table 1 gives access to the answer. If Table 1 c o n t a i n e d - instead of the 5 roads - all 1-km segments of all roads of the network, it would be possible to split up these 1000 vehicle- kilometres to all road segments in proportion to their hourly vehicle frequencies. Consequently, the number of cars or trucks per hour w o u l d increase by a tiny percentage. The DeltaLeq of the last two rows of Table 1 could then be re- calculated, replacing the increase of +1 car or truck by the tiny increase proportional to each road segment's past traf- fic frequencies. The surprising result would then be that the
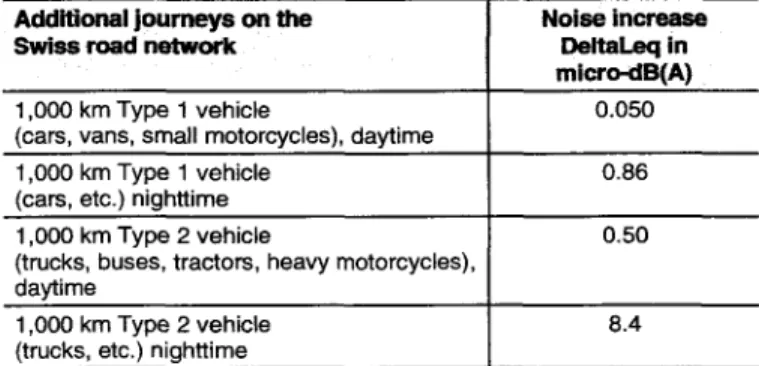
Table 2: Calculational noise increase LAeq, averaged over I year, for the entire Swiss road network, resulting from an additional journey of 1000 km on an unknown route
Additional journeys on the Noise increase
Swiss road network DeltaLeq in
micro-dB(A)
1,000 km Type 1 vehicle 0.050
(cars, vans, small motorcycles), daytime
1,000 km Type 1 vehicle 0.86
(cars, etc.) nighttime
1,000 km Type 2 vehicle 0.50
(trucks, buses, tractors, heavy motorcycles), daytime
1,000 km Type 2 vehicle 8.4
(trucks, etc.) nighttime
corresponding DeltaLeq show only small differences between road segments, these differences being mainly due to differ- ent vehicle speeds and road gradients. In fact, if traffic in- creases on every road are taken as proportional to the pre- existing traffic volume, calculations as well as theoretical considerations (see M~iller-Wenk 2002:22-26) show that the calculational noise increase DeltaLeq is roughly constant over all road segments of the network, with minor differences being attributable to different vehicle speeds and road sur- face properties. In fact, the DeltaLeq of N + I vehicles per hour is roughly proportional to the first derivative of logN, which is proportional to 1/N. But if the traffic increase on every road segment is proportional to N instead of a con- stant + 1 vehicle, the corresponding DeltaLeq is proportional to N* l/N, that is to say, independent of N and therefore equally high for low traffic roads and high traffic roads. The results of these calculations can be seen in Table 2. It is plausible that the noise increase due to a truck journey (as shown in Table 2) is about 10 times higher than in the case of a car journey, because trucks are noisier. It is also plausible that the noise increase due to a vehicle's circula- tion is substantially higher at nighttime than during day- time, because traffic at night is much lower so that one ad- ditional vehicle counts more than during the day with its high traffic volumes. As mentioned before, DeltaLeq is the increase of noise level LAeq averaged over a full year, and this (calculational) increase pertains to the totality of the Swiss road network. It is therefore obvious that the noise increase due to 1000 vehicle-kilometres must be extremely low, and is not expressed in decibels, but rather in millionths of decibels (micro-dB). Let's recap that the noise increase is 'calculational' insofar as it is not the noise increase due to a vehicle's physical journey that could be measured by an in- strument along the route used; it is rather the calculational contribution of this single journey to the yearly increase of traffic noise over the whole road network.
The attractiveness of the result shown in Table 2 lies in the fact that the noise increase pertains to every road of the road network, due to the principle of stretching the 1000 vehicle- km over the whole network in proportion to pre-existing traf- fic frequencies. This greatly simplifies the following step of the exposure analysis: The noise increase is burdening the whole population of the region, and it is not necessary to split up this population into sub-populations per road.
Road Traffic Noise
LCA Methodology
One could object here that the buildings are not immedi- ately adjacent to the roads in general, so that a noise attenu- ation takes place between the r o a d and the location of the building. This objection is correct, but it is important to notice that noise attenuation between the noise source and the location of noise impact is a function of geometry and materials only, and it does n o t depend on the noise level of the noise source (see SAEFL 1991:12). In other words, the amount of a noise increase DeltaLeq stays unchanged on its way from the noise source to the point of the noise impact. This is not in contradiction with the fact that a given DeltaLeq causes a smaller health effect if occurring at the low noise level of a building far away from the road, this aspect being dealt with in the effect analysis (see section 5).
4 Exposure Analysis in Detail
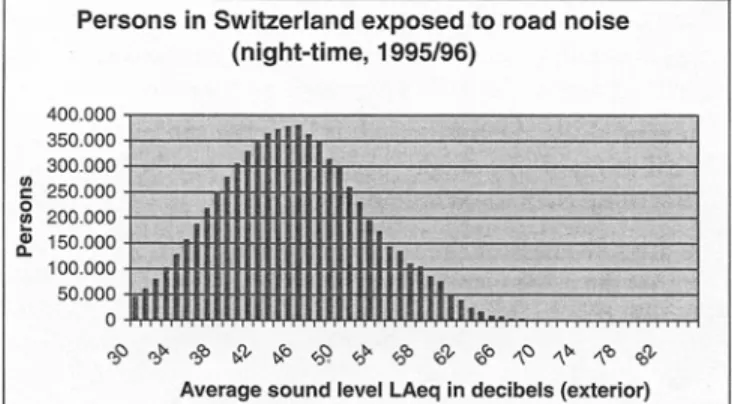
The objective of the exposure analysis is to determine the num- ber of people being exposed to a certain increase of time-aver- aged noise level. In the light of the preceding comments, the very simple result of the exposure analysis is the total number of Switzerland's inhabitants, roughly 7.1 million of people. In fact, this is the p o p u l a t i o n living along or between any of the roads that constitute the Swiss road network. However, some people live so far away from public roads that the road noise does not have any kind of impact on them. Al- though the noise increases DeltaLeq according to Table 2 arrive at their houses too, this noise increase builds up at low noise levels of 40 dB or less, so that neither noise nor noise increase produce an adverse effect on human organ- isms. It is therefore a useful p r e p a r a t o r y work for section 5 to determine here the repartition of Swiss population with respect to the exposure to time-averaged road noise. For the time being, the officially published Swiss data on num- bers of inhabitants per level of noise (BFS 2002:185) are rather old and not very reliable. To obtain better data quality, the computer-based road noise model available for the Kanton of Zurich (covering approximately 1/6 of Swiss population) was used to calculate the corresponding data with updated traffic figures, and the result for Zurich was extrapolated for the total of the Swiss population. Fig. 3 gives a graphical repre- sentation of the data generated, indicating the year-averaged noise levels LAeq outside the buildings at nighttime
(22.00-
06.00). Similar data were generated for daytime.
Fig. 3: Swiss population's exposure distribution to road noise (year-aver- aged LAeq, nighttime, 22.00-06.00, outside of building), extrapolated from LUK Zurich data. (Daytime figures are approx. 9 dB higher)
Fig. 3 represents the road noise background situation in Switzerland. Additional traffic activities cause tiny noise in- crements DeltaLeq according to the data of Table 2, which penetrate to the outsides of the buildings where the persons of Fig. 3 live. This means that the population segment con- cerned is shifted slightly to the right: Each column of Fig. 3 generates a tiny overflow to the next column at its right side. Although such noise increase m a y not be audible, the subsequent effect analysis will show that noise effects are allocatable to these DeltaLeq.
5 Effect Analysis in Detail
Noise is recognised to provoke several types of adverse health effects: hearing impairment, interference with speech com- munication, sleep disturbance, cardiovascular and physi- ological effects, mental health effects (WHO 2000:20-30). Where health in the strict sense is not impaired, people can nevertheless get annoyed by noise. A loss of working capac- ity may be a consequence of such primary noise effects. Focusing here on road noise, we can exclude the effect to hearing organs and mental health effects, because these ap- pear to be caused by higher noise levels than those transmit- ted from roads to nearby buildings. In general, people are unable to notice a connection between noise and cardiovas- cular/physiological effects so that the corresponding rela- tionship has to be based on epidemiological research, where the detected associations are weak or inconsistent so far (WHO 2000:29). We therefore exclude the corresponding effects here, although they were modelled in (Miiller-Wenk 2002:42,56). In contrast, the connection between road noise and speech communication or sleep disturbance is obvious for the affected persons as well as for the medical specialists. The effect analy- sis here therefore concentrates on sleep disturbance and com- munication disturbance. Although many people need to sleep during the daytime (06.00-22.00), and many people commu- nicate during nighttime (22.00-06.00), the simplification is made here to associate sleep disturbance to nighttime noise, and communication disturbance to daytime noise.
Undoubtedly, sleep disturbance of a certain intensity and duration is a serious health impairment justifying the inter- vention of doctors or hospitals (sleep clinics). In contrast, communication disturbance is not a health impairment in the strict sense, because the affected person would have no problems to hear speech or music in the absence of noise. But as the affected persons in practice cannot escape from the noise because financial or other restrictions make a change to a quiet apartment impossible, they are compa- rable to a person with damaged hearing organs: the com- munication with other persons or acoustical equipment has deteriorated. The masking of auditory signals by the exter- nal noise is equivalent to a defect of the auditory organs. We therefore consider communication disturbance as a health impairment in the wider sense here.
The relationship between sleep/communication disturbance and the level of road noise has been the object of many so- cial survey studies: People were asked to what extent they experience - due to road noise penetrating into their rooms
- problems with sleeping-in or awakenings, or with listen-
L C A M e t h o d o l o g y R o a d T r a f f i c N o i s e
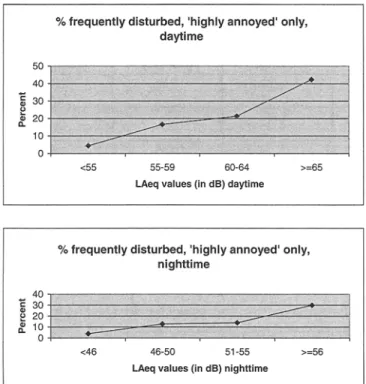
Fig. 4: Percent of interviewees per LAeq-class who declared to be dis- turbed every day or every few days with respect to sleep (nighttime) or communication (daytime). LAeq level is outside of buildings. Data from Swiss Noise Study 90
ing to partners or to equipment like television, telephone or recorders. In parallel, a measurement or a calculation of the road noise level LAeq outside of their building facade was made. Although the answers of a single interviewee may be distorted (intentionally or unintentionally), social surveys interviewing a sufficient number of persons are appropriate to produce reasonably reliable data. Most social survey stud- ies in c o n n e c t i o n with road, air and rail noise ask the interviewees to express their degree of annoyance caused by the noise. In addition to this, a study with 2000 interviewees made in Switzerland in year 1991 (Oliva 1998) asked ex- plicit questions about the frequency of their sleep-in and sleep interruption problems, as well as concerning the fre- quency of their problems to understand speech and to enjoy music. The noise level LAeq outside of the most exposed facade of the building was calculated but not communicated to the interviewees. The corresponding dose-effect relation- ships are shown in Fig. 4.
The lower part of Fig. 4 refers to nighttime and gives the percentage of interviewees reporting frequent and serious sleeping problems due to road traffic noise at night. It is very possible that certain interviewees put the blame on noise, although something else was the real reason for their sleep disturbance. However, it is remarkable that the percentage of disturbed persons at nighttime rises steadily from 4% at a noise level of below 46 decibels to 30% at locations where the noise level is above 55 decibels. This supports the as- sumption that the increasing noise level is the essential cause to which the increasing percentage of sleep complainers is attributable. Although the lowest and the highest point of the dose-response relationships of Fig. 4 refer to open classes,
and although the apparent non-linearity of these curves is justifiable (Miiller-Wenk 2002:39), we take the simple con- clusion from the lower part of Fig. 4 that the approximate percentage of persons declaring themselves to suffer from sleep disturbance increases linearly by 1.7 percentage points per one additional dB, starting at a nighttime o u t d o o r LAeq of 46 dB. This slope of 1.7% per dB LAeq compares reason- ably well with the slopes of other studies (Maschke et al. 2001), despite the fact that those studies indicate noise lev- els in the form of peak measures (LAmax or SEL) and not in the form of energy-equivalent averages (LAeq). Further, the starting level of LAeq 46 dB compares well with the W H O guideline value of LAeq 45 dB (recommended noise level o u t s i d e f a c a d e o f b e d r o o m s ) for p r e v e n t i o n of sleep dusturbance ( W H O 2000:45). The results of a Japanese so- cial survey (Kabuto 2002), using averaged LAeq and not peak levels, and measuring the LAeq near to the sleeper's ear by a personal sound exposure recorder, are in reason- able c o n f o r m a n c e with the Swiss data: Complaints in Japan to be w o k e n up by road traffic noise start at a threshold LAeq of 34 dB (at sleeper's ears), and the fraction of com- plainers increases by 1.44 % per one additional dB. The analysis of the correlation between the noise level outside the building and at a sleeper's ears of Kabuto's Japanese sample resulted in a regression line of LAeq at sleeper's ears = 0.96 LAeq outside building - 9.7 dB, which means that LAeq at the sleeper's ears was roughly 10 dB lower than LAeq outside building. This means that the findings (Kabuto 2002) are reasonably similar to the Swiss results (threshold level LAeq 46 dB outside building, and slope 1.7% sleep disturbance per one additional dB).
The upper part of Fig. 4 shows the percentage of interviewees reporting frequent and serious communication problems due to road traffic, depending on the LAeq level at daytime. The conclusion d r a w n from this c o m m u n i c a t i o n disturbance curve is that the approximate percentage of persons declar- ing themselves to suffer from communication disturbance increases linearly by 2.5 percentage points per one additional dB, starting at a daytime o u t d o o r LAeq of 55 dB.
This result of the effect analysis is shown in Table 3. R o w 4 of Table 3 gives the number of additional disturbance cases per one additional dB above threshold level, for sleep dis- turbance at nighttime and for communication disturbance at daytime. Instead of showing additional cases per 100 per- sons per 1 dB above threshold level, the result is expressed in additional cases per 1 million persons per noise increase of 1 micro-dB. This matches more conveniently with the results of the fate analysis in row 1 of Table 3, being ex- pressed also in micro-dB. The totals of the population living above the threshold levels (row 2 and 3) are the results of the exposure analysis in section 4.
The last two rows of Table 3 give the overall results, ex- p r e s s e d in a d d i t i o n a l h e a l t h cases p e r 1000 vehicle- kilometres. The calculation for the case of column 1 (cars circulating at daytime) is as follows: Per one micro-dB, the number of additional cases would be 0.025 times 3.05, yield- ing 0 . 0 7 6 2 5 cases. But according to r o w 1, 1000 car- kilometres during daytime cause an increase of only 0.050 micro-dB over the whole Swiss road network during one
Road Traffic Noise
LCA Methodology
Table 3: Determination of additional cases of communication and sleep disturbance in Switzerland, per 1000 vehicle-kilometres Daytime Vehicle Type 1 (car, etc.) Daytime Vehicle Type 2 (truck, etc.) Night-time Vehicle Type 1 (car, etc.) Night-time Vehicle Type 2 (truck, etc.)
DeltaLeq in micro-dB per 1,000 vehicle-km according to 0.050 0.50 0.86 8.4
fate analysis
Million persons in Switzerland exposed to daytime 3.05 3.05 LAeq _> 55 dB threshold
Million persons in Switzerland exposed to night-time 3.36 3.36
LAeq > 46 dB threshold
Additional cases of disturbance per million persons caused 0.025 0.025 0.017 0.017 by DeltaLeq 1 micro-dB according to effect analysis
Additional cases of communication disturbance 0.0038 0.038 per 1,000 vehicle-km in the daytime
Additional cases of sleep disturbance per 1,000 vehicle-km 0.049 0.48
at night-time
year. Consequently, the number of sleep disturbance cases is 0.07625 times 0.050 micro-dB, or 0.0038 cases, as shown in c o l u m n 1 of Table 3. We repeat here that the duration of a case is one year, because the disturbance lasts as long as the calculational noise increase, the latter being the DeltaLeq maintained during one year.
6 Damage Analysis in Detail
If we were satisfied with knowing the n u m b e r of additional cases per 1000 vehicle-kilometres for each relevant type of health impairment, the last two rows of Table 3 would be the final result for the assessment of road traffic noise in Switzerland. But if we want to c o m p a r e the damage to hu- m a n health caused by night traffic with the corresponding damage of daytime circulation, or if we want to compare damage to human health due to vehicle noise to the corre- sponding damage due to vehicle exhaust gas, it is useful to express the severity of the health cases involved in a com- prehensive system of health metrics.
As mentioned before, the choice was taken to use the 'DALY' health metrics system that was developed for the W H O ( M u r r a y
1996)
and that is currently used by the W H O for reporting the annual world-wide damage to human health due to all kinds of causes, including environmental ones ( W H O 2002:Annex Table 3). DALY (Disability Adjusted Life-Years) is a measure to express the a m o u n t of damage to h u m a n health, counting the n u m b e r of life-years 'fully' lost due to premature death and the n u m b e r of life-years 'par- tially lost' as a consequence of a disease or an accident ('dis- ability'). Disability in comparison to death is weighted by means of 'disability weights' (DWs), which are recorded in tables for each disease category according to the severity of the associated impairment: Whilst one year lost by prema- ture death has a D W of 1.0, one year lived with blindness gets a D W of 0.600 and one year lived with angina pectoris a D W of 0.227. The W H O tables of disability weights ( M u r r a y1996:Annex
Tables) have been developed through the co-operation of 9 regional panels of medical specialists and are designed for world-wide application. Hence, they are geared towards diseases occurring outside the developedindustrial countries. This is why the W H O tables have been supplemented with studies conducted in the Netherlands (Stouthard 1997) and Australia (VGDHS
1999)
focusing on medical conditions that are particularly characteristic of de- veloped countries. However, sleep disturbance and communi- cation disturbance could not be found in these published DW tables. For this reason, we organised a special investigation in Switzerland in order to obtain representative DWs for these two types of health impairment (Mfiller-Wenk 2002:46-50) After a pre-test, a questionnaire was distributed in the year 2000 to the 64 members of the medical staff of the Swiss National Accident Insurance Institute (SUVA). This special group of physicians was selected because they have a broad professional experience in evaluating and comparing the severity of various disability situations caused by accidents. The questionnaire contained a table of disease conditions with the available Disability Weight D W issued by the sources mentioned above. These available DWs were put into as- cending order. In addition, a circumscription of sleep distur- bance and communication disturbance was supplied, match- ing the questions of the Swiss noise study 90 used in the effect analysis. The task given to the physicians was to in- sert sleep disturbance and communication disturbance at the adequate location into the sorted table of disease conditions with already existing DWs. This interpolation exercise was performed by 42 of the 64 physicians, and 41 of the 42 questionnaires returned could be used for the following analysis. The result thereof is shown in Table 4.The disability weights of Table 4 express the panellists opin- ion that communication disturbance is roughly equally se- vere as 'mild to moderate asthma, symptom-flee with or
Table 4: Disability weights for one year of sleep disturbance or communi- cation disturbance, resulting from the panel exercise with physicians of the Swiss National Accident Insurance Institute SUVA
Condition Disability Weight DW
(95% Co~dence interval) Communication disturbance during 1 year 0,033 (0.026;0.040) Sleep disturbance during 1 year 0.055 (0.039;0.071)
LCA Methodology
Road Traffic Noise
Table 5: Health damage in DALY units per 1000 vehicle-kilometres on Swiss road network, during the day (DAY) or at night (NIGHT)
Communication disturbance
DALY 11000 Ion DAY DALY 11000 Ion DAY Vehicle type1 ~ .V e h i c l e type 2 . (car, van, light motorbike): :(truck, bus; ~ motorbike)
0.00013 0.0013
DALY/1000 km NIGHT Vehicle type 1 (car, van, light motorbike)
DALY/1000 km NIGHT Vehicle type 2 (truck bus heavy motorbike)
Sleep 0.0027 0.026
disturbance
without maintenance therapy', and that sleep disturbance is roughly equally severe as 'chronic hepatitis B infection with- out active viral replication'.
With the disability weights of Table 4, it is possible to ex- press the health damage due to 1000 vehicle-kilometres in Switzerland in the generalised form of [DALY per 1000 ve- hicle-km]. This final result is shown in Table 5.
Considerations on uncertainty (MiJller-Wenk 2002:52-56) lead to the conclusion that low estimates are roughly 50% of the Table 5 values, and high estimates roughly 200%.
7 Road Transport Outside of Switzerland
More and more, road-transport exceeds country borderlines. H o w can we treat international road transport showing up in LCA studies? Obviously, the concept presented here can be applied to the traffic and noise data of other countries: The basic data required per country are the annual vehicle- kilometres per vehicle class with a day/night split, the length of the national road network, and the population distribu- tion with respect to road noise LAeq. It can be expected that the health damage per 1000 vehicle kilometres will be low for countries with low traffic density, and houses being well insulated and/or relatively distant from main roads. Until country-specific results are made available, we propose (Miiller-Wenk 2002:60), as a very coarse temporary solu- tion, to categorise European countries into average-noise, low-noise and high-noise countries: Spain and Slovakia be- long to the high-noise group, Finland, Sweden and Denmark to the low-noise group, and the remaining countries to the average-noise group. It is proposed to use the Swiss figures (Table 3 and 5) for the countries of the average-noise group, to double these figures for the high-noise group and to di- vide them by two for the low-noise group.
8 Results and Discussion
The problem to solve is the following: According to the life- cycle inventory content or available supplementary infor- mation, 5500 kg of packaging material is to be transported by a 40-ton truck from the supplier to the food packer over an average distance of 500 km - how can the damage to human health due to the corresponding road noise be calcu- lated? Assuming a daytime transport in a country compa- rable to Switzerland, the calculational damage due to the vehicle's journey is 0.038 x 500/1000 = 0.019 cases of com- munication disturbance (see Table 3) or 0.0013 x 500/1000
= 0.00065 DALY (see Table 5). The averaged net load (in- cluding empty sections) of a 40-ton truck can be set at 10800 kg (Maibach 1995:44) so that 5 0 . 9 % of the damage caused by the vehicle can be allocated to the 5500 kg of our case. The result of the noise impact assessment is therefore 0.0095 cases of communication disturbance or 0.00033 DALY. If the truck travelled during the nighttime, the analogous cal- culation yields a damage allocatable to the 5500 kg of 0.12 cases of sleep disturbance or 0.0066 DALY.
Are these results reasonable? It is interesting to compare the health damage due to road noise in Switzerland - calculated according to the preceding sections - to other quantitative data on health damages.
The Swiss statistical yearbook (StatJB 2000:table T 14.4) specifies the number of life years lost in Switzerland in the year 1995 due to road traffic accidents at 12938 life-years or DALY. This figure contains life-years lost due to prema- ture death only, and years are counted only up to the age of 70. If the life-years above age 70 and the life-years partially lost due to non-fatal road accidents were also counted, we might expect a figure of 2 0 0 0 0 - 3 0 0 0 0 DALYs for road ac- cidents in 1995.
On the other hand, the number of DALYs due to road noise in 1995 in Switzerland can be estimated with the data of the preceding sections. The number of cases of sleep disturbance is roughly 13% of 3.36 million persons living above 45 dB road noise at night, equalling 436,800 cases (compare Fig. 4 for % disturbed, see Table 3 for population above thresh- old level). The number of cases of communication distur- bance is roughly 19% of 3.05 million persons living above 54 dB during the day, equalling 579,500 cases. Multiplying the sleep disturbance figure with its disability weight of 0.055 and the communication disturbance figure with its D W of 0.033, the total health damage due to road noise in the year 1995 in Switzerland results in 43147 DALY.
This means that road traffic in Switzerland in 1995 caused a damage volume of 2 0 0 0 0 - 3 0 0 0 0 DALY due to traffic ac- cidents and a damage volume of 40000 DALY due to road noise. Intuitively, we would have expected the damage from accidents to be higher than the damage from noise, but o u r feelings may be influenced by the high presence of road ac- cidents in the media and the non-visibility of noise-related damage. Could the DALY figure for road noise be greatly exaggerated ? Reviewing the key figures of population living above the threshold noise levels, the number of sleep/com-
Road Traffic Noise
LCA Methodology
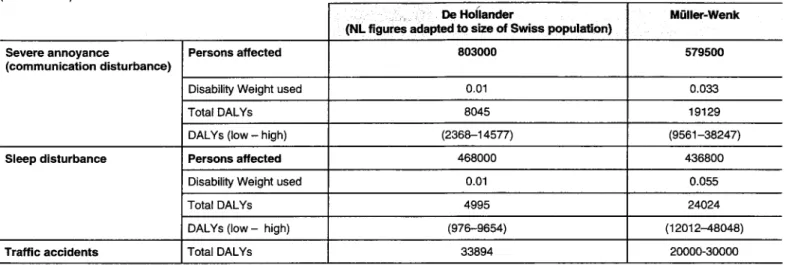
Table 6: Comparison of DALYs (normalised to population size 7.08 million persons) between The Netherlands (De Hollander 1999) and Switzerland
(MQIler-Wenk)
Severe annoyance
(communication disturbance)
Persons affected Disability Weight used Total DALYs
DALYs(Iow -high)
De Hol~lander MOller-Wenk
, (HE figures adapted to size of Swiss population) ,
803000 0.01 8045 (2366-14577) 579500 0.033 19129 (9561-38247)
Sleep disturbance Persons affected 468000 436800
Disability Weight used 0.01 0.055
Total DALYs 4995 24024
DALYs (low - high) (976-9654) (12012-48048)
Traffic accidents Total DALYs 33894 20000-30000
munication cases per 100 persons living above threshold lev- els, and the DWs for the two types of disturbance, we do not find r o o m for substantial errors: Our noise-level-distri- bution of the population coincides reasonably well with other Swiss data and with figures for comparable European states. The slope of the dose-effect characteristics used here for sleep disturbance and communication disturbance is comparatively steep, but not excessive in comparison to other social sur- veys. And the disability weights developed by the physicians' panel m a y be somewhat high, but could not be set very much lower compared with other low-level disabilities of the DW- catalogue currently used by the W H O . We therefore con- clude that it is not inadequate to state that the importance of noise damages due to road traffic in Switzerland is simi- lar to the importance of road accidents.
A further comparison of our results is possible with calcula- tions from the Netherlands (De Hollander 1999). The Neth- erlands and Switzerland are countries of reasonably compa- rable structure, whereby the population of N L is 2.2 times larger than the Swiss population. De Hollander gives fig- ures for noise related 'severe annoyance' and 'sleep distur- bance' (whereby noise includes not only road noise) and the definitions of the disturbances may be different from those we used in Switzerland. Nevertheless, the comparison of the results in Table 6 is quite interesting.
Assuming that road traffic is the dominant source of noise also under Dutch conditions, it is apparent that the main difference between De Hollander's and Miiller-Wenk's fig- ures stem from the disability weights. Unfortunately, the ef- forts to obtain details on the origin of de Hollander's dis- ability weights and other background data have not been successful so far. Consequently, the provisional result of the comparison is that the data of the two studies are not con- tradictory, except for the disability weights. Irrespective of this open point, it can be stated that both studies come to the conclusion that the damage in DALY units of r o a d traf- fic accidents and of road traffic noise effects are of the same order of magnitude.
9 C o n c l u s i o n s a n d O u t l o o k
The health damage caused by road vehicle noise is so im- portant that LCA studies involving non-negligible road trans- port volumes are clearly incomplete if the noise effects are neglected. The m e t h o d proposed here can be used immedi- ately in LCA practice, and LCI data should be prepared in such way that road transport noise assessment can be ex- ecuted according to this method. For Swiss conditions, the method appears to be adequate, but for other countries it has as yet not been w o r k e d out in detail. Although a provi- sional adaptation of the results to other European countries is proposed here, it is desirable to undertake additional ef- forts to collect basic data on road traffic noise at the indi- vidual country level, and to continue and broaden the con- ceptional work on road noise assessment.
Rail transport is sometimes an alternative to road transport, and LCA may be used to justify a decision 'rail or road' from an environmental point of view. In analogy to the solution proposed here for road traffic noise, the life-cycle assessment of rail transport noise can be developed as follows: A rail trans- port from A to B is considered to be using a fraction of the transport capacity of one additional freight train on the net- work segments connecting points A and B: as rail networks are much wider meshed than road networks, the exact rout- ing of a rail transport is better known than that of road trans- port. On the basis of data on the number of persons per noise level LAeq'along each segment of the rail network, the results of the fate and exposure analysis can be obtained easily: These results consist in the DeltaLeq for the fraction of one addi- tional train used by the transport, as well as the current rail noise distribution of the population along the rail network segments used. The effect analysis of rail noise should reflect the fact t h a t - compared to road transports - the noise pattern of railway lines contains less noise events per day, so that the momentaneous noise level deviates more from the average Leq than in the case of roads. This means that the effect analysis of railway noise should be based on rail-specific dose-effect char- acteristics which can be found in primary studies being listed and charted in (Miedema 1998).
L C A M e t h o d o l o g y R o a d T r a f f i c N o i s e
Information on types and magnitude of health effects depend- ing on noise levels is still a weak point of transport noise im- pact analysis. Until now, social surveys generally focus on an- noyance and do n o t indicate noise effects in terms o f the medical diagnosis type. This, in spite of the fact that transport noise is n o w clearly recognised to cause observable health effects in the persons affected. Further, the available medical studies on noise effects are difficult to compare because they express noise levels in varying units (Leq, L m a x or SEL) which are not eas- ily convertible. As all of these three noise measures have their merits, chances are p o o r that researchers will agree on a best unit. It is therefore desirable that medical studies indicate h o w the noise units they use can be converted to the other units mentioned above in the context of the respective study, so that a pooling of study results is facilitated.
R e f e r e n c e s
BFS (2002): Bundesamt ffir Statistik BfS: Umwelt Schweiz 2002 - Statistiken und Analysen, Neuch~tel 2002
De Hollander (1999): De Hollander AEM et al.: An Aggregate Public Health Indicator to Represent the Impact of Multiple Environmental Exposures, Epidemiology 10, 606-617
Eurostat (1995): Europe's Environment, Statistical Compendium, Luxembourg 1995
Gorree (2000): Gorree M, Guinee JB Huppes G van Oers L: Envi- ronmental Life Cycle Assessment of Linoleum - Final Report, Report No 151, CML Leiden 2000. Available for download through httm//Leidenuniv.nl/interfac/cml
Guin~e (2000): Guin~e JB et al.:Life Cycle Assessment - An op- erational guide to the ISO Standards, Part 2a (Guide), Final Report May 2001. Available for download through http://vcww. Leidenuniv.nl/interfadcml/lca2/index.html
Kabuto (2002): Kabuto M: A dose-response between nighttime indoor sound level due to road traffics and risk for insomnia in Japan, Article 50389233-2002/14, Presented at the W H O tech- nical meeting on exposure-response relationships of noise on health, September 11 th, 2002
Lafleche (1997): Lafleche V, Saccbetto F: Noise Assessment in LCA - A Methodology Attempt, Int J LCA 2, 111-115
Maibach (1995): Maibach M e t al.: Okoinventar Transporte - Technischer Schlussbericht, INFRAS Zfirich, 1995 (ISBN 3- 9520824-5-7)
Maschke (2001): Maschke C, Hecht K, Wolf U: N~ichtliches Er- wachen durch Flugl~irm. In: Bundesgesundheitsbl - Gesund- heitsforsch- Gesundheitsschutz 44, 1001-1010
Miedema (1998): Miedema HME, Vos H: Exposure-response re- lationships for transportation noise, J. Acoust. Soc. Am 104, 3432-3445
Miiller-Wenk (2002): MiJller-Wenk R: Attribution to road traffic of the impact of noise on health, Environmental Series no. 339, BUWAL Berne 2002. Available for download through www. buwalshoD.ch
Murray (1996): Murray Ch et al.: The Global Burden of Disease, World Health Organisation, Geneva 1996
Oliva (1998): Oliva C: Belastungen der Bev61kerung durch Flug- und StrassenEirm, Berlin 1998
SAEFL (1991): BUWAL: Strassenliirmmodell fiir fiberbaute Ge- biete, SRU No.15, Bern 1991
StatJB (2000): Bundesamt fiir Statistik: Statistisches Jahrbuch 2000 der Schweiz, Bern 2000
Stouthard (1997): Stouthard MEA et al.: Disability Weights for Diseases in the Netherlands, Rotterdam 1997
UBA (2003): Maschke C et al.: Epidemiologische Untersuchungen zum Einfluss von Liirmstress auf das Immunsystem und die Ent- stehung von Arteriosklerose, WaBoLu 01-03, Umweltbun- desamt, Berlin 2003
VGDHS (1999): Victorian Government Department of Human Services: Victorian Burden of Disease Study - Morbidity, Mel- bourne 1999, http://www.dhs.vic.gov.au/phd/9903009/index.htm W H O (2000): Guidelines for Community Noise, World Health
Organisation, Geneva 2000
W H O (2002): The World Health Report 2002, World Health Organisation, Geneva 2002, downloadable from htm://www. who.int/whr/en Received: July 8th, 2003 Accepted: December 9th, 2003 OnlineFirst: December 15th, 2003 Int J LCA 2 (2) 111-115 (1997) N o i s e A s s e s s m e n t i n L C A - A M e t h o d o l o g y A t t e m p t : A C a s e S t u d y w i t h V a r i o u s M e a n s o f T r a n s p o r t a t i o n o n a Set Trip Vincent Lafleche and Francesco Sacchetto
This paper focuses on impact assessment of noise disturbance in the f r a m e w o r k of LCA studies.
A number of difficulties arose in the course of the study, namely expressing noise measurements in an easy-to-handle unit, im- porting disturbance engendered by several simultaneous sources to every single course, handling additive quantities non linearly, taking into account the space and time depen- dence of potential impacts associated with noise.
It is shown h o w all these issues were tacHed in an LCA study that assessed different modes of transportation. The methodol-
ogy developed takes into account the disturbance to noise level, exceeding a set threshold and no other kinds of noise effects. It is obvious that disturbance due to noise emission depends on people density in the neighborhood of the emission source. In this context, a 'site-dependent approach' was taken, mean- ing that we did include local factors into the valuation. The methodology developed in this article may be extended to other types of emissions when it is necessary to integrate local fac- tors in the assessment phase of LCA.