Publisher’s version / Version de l'éditeur:
12th International Conference on Fracture 2009 (ICF-12): Ottawa, Ontario, Canada, 12-17 July 2009. Volume 4, pp. 3265-3273, 2009
READ THESE TERMS AND CONDITIONS CAREFULLY BEFORE USING THIS WEBSITE. https://nrc-publications.canada.ca/eng/copyright
Vous avez des questions? Nous pouvons vous aider. Pour communiquer directement avec un auteur, consultez la première page de la revue dans laquelle son article a été publié afin de trouver ses coordonnées. Si vous n’arrivez pas à les repérer, communiquez avec nous à [email protected].
Questions? Contact the NRC Publications Archive team at
[email protected]. If you wish to email the authors directly, please see the first page of the publication for their contact information.
NRC Publications Archive
Archives des publications du CNRC
This publication could be one of several versions: author’s original, accepted manuscript or the publisher’s version. / La version de cette publication peut être l’une des suivantes : la version prépublication de l’auteur, la version acceptée du manuscrit ou la version de l’éditeur.
Access and use of this website and the material on it are subject to the Terms and Conditions set forth at Fatigue crack growth rate evaluation in a turbine disc after spin rig testing
Beres, W.; Dudzinski, D.; Murzionak, A.
https://publications-cnrc.canada.ca/fra/droits
L’accès à ce site Web et l’utilisation de son contenu sont assujettis aux conditions présentées dans le site LISEZ CES CONDITIONS ATTENTIVEMENT AVANT D’UTILISER CE SITE WEB.
NRC Publications Record / Notice d'Archives des publications de CNRC: https://nrc-publications.canada.ca/eng/view/object/?id=b7c77eeb-9d43-4569-9fcb-cb288c497aa9 https://publications-cnrc.canada.ca/fra/voir/objet/?id=b7c77eeb-9d43-4569-9fcb-cb288c497aa9
Fatigue Crack Growth Rate Evaluation in a Turbine Disc after Spin Rig Testing
W. Beres, D. Dudzinski, A. Murzionak
National Research Council Canada, Institute for Aerospace Research Ottawa, Ontario, Canada
1.0 Abstract
This paper describes the destructive inspection analyses of cracks growing from firtree serrations of a turbine disc spun in a spin rig facility. The cracks were initiated by introducing EDM notches in predefined locations of the discs. Finite element based predictions of crack growth from these notches are also reported. ZENCRACK as well as a 2D in-house deterministic fracture mechanics software were used. Both the crack depth and the surface crack length were predicted and correlated with the results obtained during the spin rig testing. The results obtained are used in damage tolerance analyses of critical components of gas turbine engines.
2.0 Introduction
Gas turbine components are subjected in service to a combination of damage processes induced by the combined effects of mechanical forces, temperature and environment [1]. One such process is fatigue damage where the majority of life is taken up by nucleation and propagation of a crack.
The lifing methodology for gas turbine engines is typically developed and applied by the Original Equipment Manufacturer (OEM) at the engine design stage. Lifing of critical components in commercial aviation engines is governed by requirements of regulatory agencies such as Transport Canada or the FAA in the USA. Commercial engine operators have to adhere to strict lifing policies established by OEMs, but in a military environment life-cycle managers have airworthiness authority to decide on engine overhaul policies and the extension of the gas turbine lives beyond recommended life intervals. These airworthiness decisions must be made on the basis of sound technical data and proper risk assessment. Lifing of critical components of aerospace gas turbine engines has a significant effect on the safety and economics of operation for both military and commercial fleets. The need to balance risk and escalating maintenance costs explains the growing interest in the application of life extension technologies for safely extracting maximum usage out of life-limited parts [2-4].
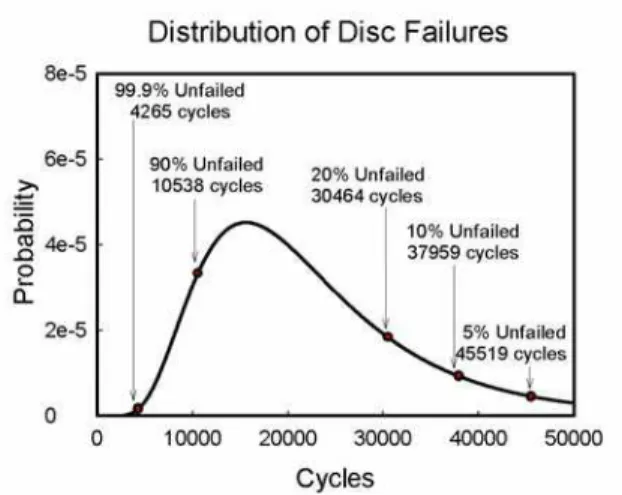
Damage tolerance concepts for gas turbine engines have emerged due to limitations of the traditional safe life design concept, where only 1 in 1000 components is expected to develop a small fatigue crack at the end of a safe life period, Fig. 1. The remaining 999 components are needlessly retired in a crack-free condition with a large amount of potential life still available. Many critical rotating components, such as turbine discs and spacers, are treated in this wasteful manner.
*Email : [email protected]
Figure 1. Probability of failure in the safe life approach.
By applying a safety-by-inspection life-cycle management approach, which relies on predictions of crack growth life and non-destructive evaluation (NDE) of components at overhaul, integrity of these components can be assured and significant cost savings can be realized. This is often referred to as the “damage tolerance based life-cycle management” (DTLCM) concept [4]. In this philosophy at the end of each Safe Inspection Interval (SII), all components are inspected and the components with no crack indications are returned to service for another SII. This procedure is repeated until a crack is found. With this approach the components are retired based on their individual condition. DTLCM procedures assume that: (i) flaws exist in manufactured parts, (ii) they are located in the fracture critical locations of the components, and (iii) their sizes are just below the detection limit of the NDE techniques used to inspect the components.
Damage tolerance analyses have been performed at the NRC-IAR for several components of gas turbine engines [5,6]. Current work is focused on a widely used turboprop engine for transport aircraft. An international collaboration program was formed as described in [5-7] to comprehensively re-evaluate and update the low-cycle fatigue (LCF) lives of critical turbine rotor components of this engine. This was done using spin tests, thermal and stress analyses, and the most current life prediction techniques. Other objectives of this research program were to provide crack growth data and to improve the life management procedures of the selected, life-limited, rotating turbine components.
This paper describes the destructive inspection analyses of cracks in serrations of a turbine disc subjected to spin rig testing that was performed as part of the international collaboration program. Numerical analyses results were compared with the fatigue crack growth rate data (FCGR) generated in the spin rig test. To protect the intellectual property of the OEM, relative (non-dimensional) data are reported in this paper.
2.0 Method
After the finite element (FE) analyses of the entire engine rotor, four components were chosen for experimental validation of component lives through spin rig testing. The NRC-IAR evaluated a spacer and a disc in its spin rig facility. The spin rig has dimensions of 1219 mm in diameter and 1219 mm in depth and allows for component testing in vacuum at high temperatures.
The turbine disc from the engine has blade slots equally spaced around the rim area. Each blade slot has three symmetric serrations to form a blade attachment, and is inclined with
respect to the rotation axis of the disc. Through the FE analyzes [5], the serration closest to the disc axis, that is the bottom serration, was established as the critical location for crack nucleation for the disc and consequently, this location was the target or life-limiting location in the spin rig test, Fig. 2.
Figure 2. Location of the maximum stress where the EDM notches were embedded
The spin rig test was performed in a back-to-front configuration, such that two discs were installed on the rotor and tested at the same time. The discs were mounted and driven in the rig in a manner similar to their installation in the engine.
The test was performed under conditions that generated the same Walker equivalent stress range in the fore side of the lowest slot of the serration as that experienced under a generic engine mission spectrum. This was achieved with rotational speeds ranging from 2,000 to 14,000 rpm, under an isothermal condition of 373 °C. Each cycle duration was 95 s. Non-destructive evaluation of both discs was carried out at predetermined intervals throughout the entire test program. Four NDE techniques were used: visual examination, fluorescent penetrant inspection (FPI), eddy current technique, and scanning electron microscope (SEM) examination of replicas.
For both discs tested, cracks did not develop naturally after the predetermined number of cycles that corresponded to the predicted crack nucleation life in the expected life-limiting locations in the blade slot areas. Therefore, ten rectangular notches were introduced in the life limiting locations for each disc using an electrical discharge machining (EDM) method, after which further spin cycles were applied. To facilitate examination of the fracture surfaces, the discs with the EDM notches were heat tinted at a point halfway through the test, in a furnace, to mark possible crack growth out of the EDM notches.
3.0 Test results
After the test a systematic destructive investigation of notch-induced crack growth was performed on both discs. Firtrees with and without notches were removed from both discs using EDM. A systematic surface examination of each of the removed firtrees in the critical life-limiting locations was then performed optically and using SEM. In the firtrees without notches, no evidence of crack formation was found. However in firtrees containing EDM notches, cracks emanating from both sides of the notch were evident in varying sizes. A typical example is shown in Fig. 3. Despite lack of indications by the NDE techniques, it was evident that the spin rig test resulted in crack nucleation and
growth.
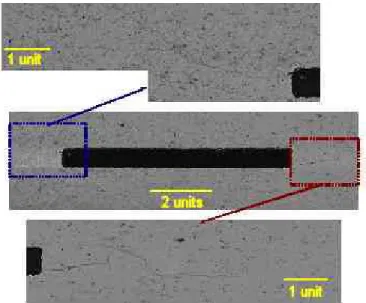
Subsequently, the cracks in the firtrees were mechanically opened to reveal the fracture surfaces. Due to the difficulty of opening the cracks with a short surface crack length, only those firtrees with a crack length of at least 1500 µm were mechanically opened. A typical optical image of the fracture surface is shown in Fig. 4. During this metallographic analysis of the fracture surface morphology it was observed that the crack propagation occurred through a transgranular fatigue mechanism, which is indicative of a high-stress state in the crack growth region.
In Fig. 4 both the thumbnail crack and the bulk material are discernable. The EDM notch at the centre of the thumbnail crack is surrounded by a region of crack growth. Evolution of the crack shape from rectangular to semi-elliptical is also clearly visible. This crack growth region was further subdivided into two areas based on the colour variation which were attributed to the heat tinting. Using this colour variation the crack lengths were measured and the crack growth rates were estimated by counting the number of cycles in the rig between each region. The normalized crack growth curves for both surface length and depth are summarized in Fig. 8 and Fig. 9. Each of these experimentally obtained curves has only three data points.
Figure 3. Typical SEM images of the EDM notch in a firtree with emanating cracks.
Figure 4. Typical optical image of a fracture surface for a crack emanating from an EDM notch.
4.0 Crack Growth Simulation Results
The objective of fracture mechanics analysis [8,9] was to determine the rate of change in the shape of the existing crack under given loading and environmental conditions, as well as its propagation rate and configuration.
The difficulties of stress intensity factor (SIF) calculations in gas turbine components are mainly caused by their complex 3D geometries and complex loadings. Furthermore numerical complexities make crack prediction difficult in the presence of residual stresses as well as due to material and geometrical nonlinearities. Moreover, stress ratio effects associated with variable amplitude loading history, as well as load interaction effects and threshold effects, should also be taken into account in the numerical modelling of crack growth for damage tolerance applications.
Three elements that need to be accounted for during crack growth analyses include crack growth direction, crack growth rate, and crack growth plane. General solutions of the crack growth plane must take into account arbitrary crack shapes that may be non-planar and thus cause difficulties for practical numerical application methods. Several successful 2D and 3D analyses of gas turbine components have been reported in [7]. As a result, the NRC-IAR research has focused on the ZENCRACK application [10]. This software takes the uncracked 3D mesh and facilitates the insertion of one or more cracks. The new mesh is then submitted for FE analysis with the results extracted and processed automatically by ZENCRACK. The crack front is advanced and the process is repeated until the analysis reaches a termination point. Therefore, automatic calculation of fatigue crack growth in a 3D body under arbitrary loading can be performed. Most importantly, a predetermined crack growth plane is not required in this FE analysis.
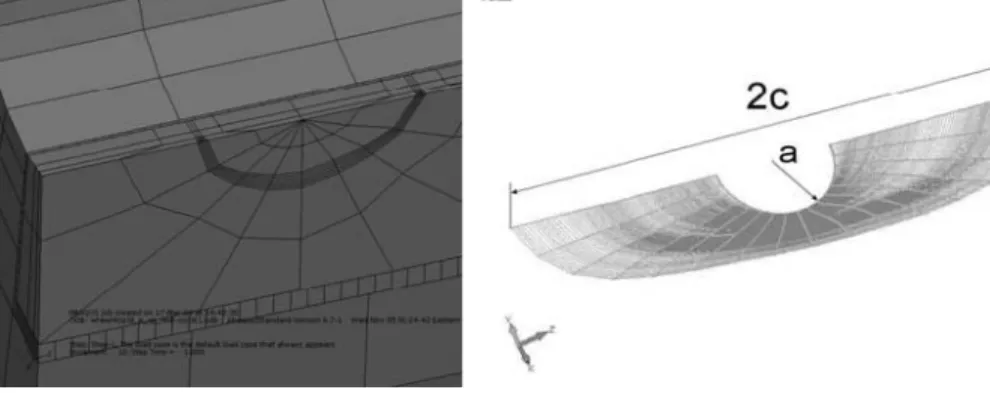
ZENCRACK predictions of crack growth at the serration of the turbine disc, in the location illustrated in Fig. 2, were performed. ABAQUS [11] was used as a main FE solver for these calculations. Fig. 5 shows typical mesh arrangement around the crack generated by ZENCRACK, while Fig. 6 illustrates a typical progression of the crack front, from the initial semi-circular to a final semi-elliptical shape.
Figure 5. Half of the mesh generated by ZENCRACK. Transition elements are visible around the crack block.
Figure 6. Progression of crack growth in ZENCRACK. A shape change from semi-circular to semi-elliptical is evident.
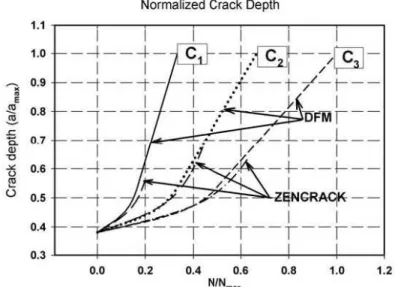
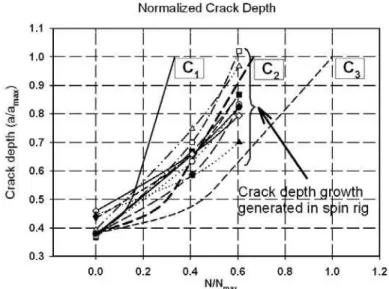
The fatigue crack growth rate data for Paris regime were provided by the OEM for conditions corresponding to the local temperature in the rim and the appropriate stress ratio. However these data were generated from a different batch of new material compared to the service exposed material evaluated in the spin rig. Therefore, to account for an inherent scatter and also to take into account differences resulting form the changes in crack propagation due to service exposure of the disc material, scatter was taken into account by assuming three values of the coefficient C in the Paris law. i.e. C1 as delivered by the OEM, C2=0.5·C1, and C3 = 0.33·C1. These variations in C represent variable conditions such as microstructure, loading, temperature, stress ratio and natural scatter of the fatigue process. Cyclic loadings used for calculation represented the loadings applied in the spin rig testing. Significant efforts were required to adjust the ZENCRACK control parameters to achieve numerical progression of the crack. Approximately 123 ZENCRACK iterations and 51 hours of clock time were required to obtain results shown in Fig 6. Numerical analyses of crack growth in the serration of the blade and disc contact are extremely challanging due to the need to take into account temperature gradient and contact between two types of finite elements located exactly in the crack opening area. In addition, comparison of these 3D ZENCRACK based crack growth predictions to predictions based on the numerical integration of crack depth progression in 2D for all three values of the coefficient C is shown in Fig. 7. The latter analyses were performed using deterministic fracture mechanics in-house software. Analysis of the curves in Fig. 7 shows that in the direction of crack depth predictions generated by ZENCRACK corresponded well with the predictions obtained with the in-house 2D software for all three values of the coefficient C. However, ZENCRACK results were obtained for only 0.55–0.67 crack depth when compared to 2D results. One of the main advantages of using the 2D crack propagation software is that the results for one run can be obtained in a time shorter that one second, and therefore further probabilistic Monte Carlo fracture mechanics analyses can be performed.
Figure 7. Comparison of the crack depth growth prediction obtained using ZENCRACK and the in-house fracture mechanics software in the disc serration for three values of the coefficient C in the Paris law; C1 > C2 > C3 .
ZENCRACK numerical crack propagation predictions and analyses for the crack emanating from the disc serration were made for both the crack depth and surface crack length. They are summarized in Fig. 8 and Fig. 9 together with crack growth measurements obtained from the spin rig test discussed in section 3.0. As mentioned, all results are presented in non-dimensional form.
Analysis of the experimental crack growth data in Fig. 8 showed that the initial normalized crack depth varied in the range of 0.37 to 0.44, while the final crack depth varied from 0.70 to 1.02. From Fig. 8, the curve using the coefficient C2 has the best agreement with the experimental crack growth data. Normalizations in this figure were performed with respect to the base values corresponding to Fig. 7 and Fig. 8.
Figure 8. Comparison between predictions of the crack growth progression in the direction of crack depth and the data obtained in the spin rig environment.
Fig. 9. Comparison between ZENCRACK predictions of the crack growth progression on the surface with the data obtained in the spin rig environment.
Analysis of the experimental crack growth data in Fig. 9 showed that the final normalized surface crack length 2c (Fig. 6) for 12 cracks varied in the range of 1.47 to 3.01. This means that the variation within the surface crack length measured was in the order of 2. The shape of most of the surface crack growth curves was close to linear. This was different from the crack depth growth curves in Fig. 8 that had an expected parabolic shape. But these observations were based on the basis of three data points per curve only and thus should be treated as first-order estimates. From Fig. 9, the curve using the coefficient C3 has the best agreement with crack length data the best.
Regarding the shape of the predicted crack, ZENCRACK showed that the final aspect ratio of predicted crack 2c/a was approximately 6, as the crack progressed from semi-circular to semi-elliptical in shape. These results did not agree well with the experiments where the crack aspect ratio 2c/a was found to be in the range of 2.3 to 3.0. These latter values are typical for natural cracks.
5.0 Summary
ZENCRACK generated predictions of the crack growth from the notch embedded in the serration of the turbine disc differed from the experimentally obtained curves by a factor of 2 for the crack depth and a factor of 3 for the crack surface length. An important conclusion is that all ZENCRACK predictions were conservative from the disc safety point of view. The results obtained show that numerical predictions of crack growth can be made for complicated 3D stress states with complicated features in gas turbine engine components. The factor of 2–3 difference between predictions and experiments can be attributed to many reasons with the most significant being that the FCGR data provided was not based on service exposed material. In addition, analysis of the existing FCGR data for the disc material showed that the coefficient C in the Paris law varied by a factor of 14.7 (Cmax/Cmin) as a result of the stress ratio R. When combined with the natural variability of FCGR curves, which are known to exhibit an order of magnitude scatter, it can be concluded that the modeling and testing efforts have generated comparable results, however all finite element crack prediction results should be treated as preliminary. The results reported here are being implemented in damage tolerance analyses of critical components of gas turbine engines at NRC-IAR.
6.0 Acknowledgements
The work was partially supported by DND-DAEPM(TH) and DND-DRDC-AVRS of Canadian Department of National Defence under FE No. D1431AVR14 Thrust 13gq13.
7.0 References
[1] X. Wu, W. Beres and S. Yandt “Challenges in Life Prediction of Gas Turbine Critical Components,” CASI Canadian Aeronautical and Space Institute Aero 2007 Conference, Toronto, ON, April 23-26, 2007, Paper 413, CASI-2007-0016, .
[2] J-P. Immarigeon, W. Beres, P. Au, A. Fahr, W. Wallace, A.K., Koul, P. Patnaik and R. Thamburaj, “Life Cycle Management Strategies For Aging Engines,” NATO RTO Workshop on Life Management Techniques for Aging Engines, Manchester, UK, October 2001. “Aging Mechanisms and Control, Specialists’ Meeting on Life Management Techniques for Ageing Air Vehicles,” RTO-MP-079(II), pp. 17.1–17.16, 2003.
[3] J-P. Immarigeon, A.K. Koul, W. Beres, P. Au, A. Fahr, W. Wallace, P. Patnaik and R. Thamburaj, “The Aging of Engines: An Operator’s Perspective,” NATO RTO Lecture Series 218 on “Aging Engines, Avionics, Subsystems and Helicopter,” RTO-EN-14, 2000, pp. 2.1–2.20.
[4] W. Beres and A.K. Koul, “Damage Tolerance Based Life Assessment for Aging Nene 10 Turbine Discs,” NATO RTO Workshop on Life Management Techniques for Aging Engines, Manchester, UK, October 2001. “Aging Mechanisms and Control, Symposium B: Monitoring and Management of Gas Turbine Fleets for Extended Life and Reduced Costs,” RTO-MP-079(I), pp. 14.1–14.16, 2003.
[5] W. Beres, D. Dudzinski, S. Robertson, C. Prentis, “Damage tolerance assessment of ageing gas turbine engines through analyses and testing,” NATO RTO Symposium AVT-157 “Ensured Military Platform Availability,” Montreal, Canada, October 13-17, 2008, Paper 19, pp. 19-1–19-22.
[6] W. Beres, D. Fread, L. Harris, P. Haupt, J. Kappas, R. Olson, P. Reineke, S. Robertson, G. Stocks “Critical Components Life Update For Gas Turbine Engines–Case Study of an International Collaboration,” ASME Turbo Expo 2008: Power for Land, Sea and Air June 9-13, 2008, Berlin, Germany, GT2008-50655.
[7] J. Hou, J. Dubke , K. Barlow, S. Slater, L. Harris, S. Calcuttawala, and W. Beres, “3D Crack Growth Analysis and its Correlation With Experiments for Critical Turbine Components under an International Collaborative Program,” ASME Turbo Expo 2008: Power for Land, Sea and Air, June 9-13, 2008, Berlin, Germany, GT2008-50548.
[8] A.R. Ingraffea, “Computational Fracture Mechanics,” in Encyclopaedia of Computational Mechanics, Vol. 2: Solids and Structures, Chapter 11, J. Wiley, 2004. [9] A.R. Ingraffea, P. Wawrzynek, FE Methods for Linear Elastic Fracture Mechanics, in Comprehensive Structural Integrity, Vol. 3: Numerical and Computational Methods, Chapter 3.01, Elsevier, 2003.
[10] “User Manual for ZENCRACK 7.5,” Zentech International Ltd, 2007. [11] ABAQUS Ver. 6.8, Dassault Systèmes, 2008.