Publisher’s version / Version de l'éditeur:
Proceedings of the International Fuel Cell Conference with Exhibition, European Fuel Cell Forum 2009, 2009
READ THESE TERMS AND CONDITIONS CAREFULLY BEFORE USING THIS WEBSITE. https://nrc-publications.canada.ca/eng/copyright
Vous avez des questions? Nous pouvons vous aider. Pour communiquer directement avec un auteur, consultez la
première page de la revue dans laquelle son article a été publié afin de trouver ses coordonnées. Si vous n’arrivez pas à les repérer, communiquez avec nous à PublicationsArchive-ArchivesPublications@nrc-cnrc.gc.ca.
Questions? Contact the NRC Publications Archive team at
PublicationsArchive-ArchivesPublications@nrc-cnrc.gc.ca. If you wish to email the authors directly, please see the first page of the publication for their contact information.
Archives des publications du CNRC
This publication could be one of several versions: author’s original, accepted manuscript or the publisher’s version. / La version de cette publication peut être l’une des suivantes : la version prépublication de l’auteur, la version acceptée du manuscrit ou la version de l’éditeur.
Access and use of this website and the material on it are subject to the Terms and Conditions set forth at
Performance evaluation of different configurations of biogas-fuelled
SOFC micro-CHP systems for residential applications
Farhad, Siamak; Yoo, Yeong; Hamdullahpur, Feridun
https://publications-cnrc.canada.ca/fra/droits
L’accès à ce site Web et l’utilisation de son contenu sont assujettis aux conditions présentées dans le site LISEZ CES CONDITIONS ATTENTIVEMENT AVANT D’UTILISER CE SITE WEB.
NRC Publications Record / Notice d'Archives des publications de CNRC: https://nrc-publications.canada.ca/eng/view/object/?id=38bc538d-09f9-485f-94ae-a3b2c8e731cd https://publications-cnrc.canada.ca/fra/voir/objet/?id=38bc538d-09f9-485f-94ae-a3b2c8e731cd
Performance Evaluation of Different Configurations
of Biogas-Fuelled SOFC Micro-CHP Systems
for Residential Applications
Siamak Farhad
1, Yeong Yoo
2, Feridun Hamdullahpur*
,11
Department of Mechanical & Aerospace Engineering, Carleton University
1125 Colonel By Dr.
Ottawa, Ontario, K1S 5B6 / Canada
*Tel.: +1-613-520-3806 *Fax: +1-613-520-2536 *feridun_hamdullahpur@carleton.ca 2
Institute for Chemical Process and Environmental Technology, National Research Council of Canada
1200 Montreal Rd.
Ottawa, Ontario, K1A 0R6 / Canada
Abstract
Three configurations of solid oxide fuel cell (SOFC) micro-combined heat and power (micro-CHP) systems are studied with particular emphasis on the application toward single-family detached dwellings. Biogas is considered to be the primary fuel for the systems considered. In each system, a different method is used for processing the biogas to prevent carbon deposition over the anode catalyst. Anode gas recirculation, steam reforming, and partial oxidation are the methods employed in systems I to III, respectively. The SOFC stack used in these systems is based on the electrolyte-supported planar cells with Ni-GDC anode, dense YSZ electrolyte and YSZ-LSM cathode, operated at 850 °C. A computer code has been developed for the simulation of planar SOFCs in cell, stack and system levels and applied to the performance prediction of these systems. The results show that the net AC electrical efficiency of systems I to III is around 42.4, 41.7 and 33.9%, respectively, at a cell operating voltage of around 0.7 V and a fuel utilization ratio of 80%. Depending on the size, location and building type and design, all the systems studied can be suitable to provide the domestic hot water and electricity demands for single-family detached dwellings. The effect of the cell operating voltage on the thermal-to-electric ratio, the net AC thermal-to-electrical and CHP efficiencies were also studied, and the number of cells in SOFC stack to generate around 1 kW net AC electricity was determined. It is concluded that the optimum cell operating voltage is higher than the cell operating voltage at which the minimum number of cells is obtained.
Keywords: Solid oxide fuel cell, Micro-combined heat and power system, biogas,
residential application, distributed power generation, anode gas recirculation, steam reforming, partial oxidation.
Introduction
Biogas is a renewable and alternative fuel that can assist to reduce the consumption of fossil fuel and emission of greenhouse gases. This fuel is mainly produced by anaerobic digestion (AD) or fermentation of biodegradable materials such as biomass, manure or sewage, and municipal waste. Biogas produced via AD process involves the breakdown of organic waste by bacteria in an oxygen-free environment. AD facilities have been recognized by the United Nations Development Program as one of the most useful decentralized sources of energy supply as they are less capital intensive than large power plants [1]. In developing countries, simple home and farm-based AD systems offer a potential for low-cost energy for cooking and lighting. Pressure from environmental legislations on solid waste disposal methods in developed countries has increased the application of the AD process, especially in wastewater treatment plants (WWTPs).
Biogas contains mainly methane and carbon dioxide; however, its composition varies depending on the source of waste. Biogas has long been recognized as a potential source of renewable energy for producing heat and electricity. Fuel cells convert the chemical energy of a fuel to electricity directly and efficiently are promising power generation devices to use biogas as fuel [2-4]. Solid oxide fuel cell (SOFC) has significant advantages of fuel flexibility and high electrical and overall efficiencies even in small scale power generation. It can achieve satisfactory performance using biogas even with low methane content. Laboratory tests confirmed that the SOFC electrical efficiency drops around 5% when the mole fraction of methane in fuel decreases from 70 to 30% [5]. Yi et al (2005), showed that the electrical efficiency of an integrated SOFC system drops around 1.1% once biogas is used instead of natural gas [6]. Biogas can be internally reformed at high temperatures in SOFC stack; however, carbon deposition may easily occur and deactivate SOFC anode catalysts gradually [7,8]. A large temperature gradient is another serious problem for the SOFC stack fed directly by biogas due to a significant cooling effect caused by the fast internal steam reforming reaction [9]. Therefore, a fuel processor is usually installed in biogas-fuelled SOFC systems to relieve these problems [10]. The steam reforming, partial oxidation, auto-thermal reforming, and anode gas recirculation are typical fuel processing methods which are used in SOFC systems [11].
Three biogas-fuelled SOFC micro combined heat and power (CHP) systems, different in the method of fuel processing, for application in residential dwellings are evaluated in this paper. Anode gas recirculation (AGR), steam reforming (SR), and partial oxidation (POX) are the methods employed in these systems. These systems are studied through modelling and computer simulation of cell, stack, and balance-of-plant for matching residential thermal-to-electric load ratios (TER), indicating the ratio of the thermal energy load to the base electrical demand [12]. The TER for residential houses can be determined based on space heating, space cooling, or domestic hot water demands and its magnitude is highly dependent on location, building type, design, usage patterns, time of day, and time of year [12]. The TER for hourly average annual domestic hot water at a modest (200 m2) home can range from 0.7 to 1.0 [13]. The TER for space heating can be substantially higher (greater than ten times) than that for domestic hot water in cold climates [12].
1. Biogas-fuelled SOFC systems
The average biogas produced in WWTPs in Ontario is considered to be the source fuel in this study. This gas is consisted of 60.8% CH4, 34.8% CO2, 2.4% N2, 1.5% O2 and 0.01%
H2O. The range of H2S and silicon compounds is 2.5-3450 and 0-2500 ppm, respectively
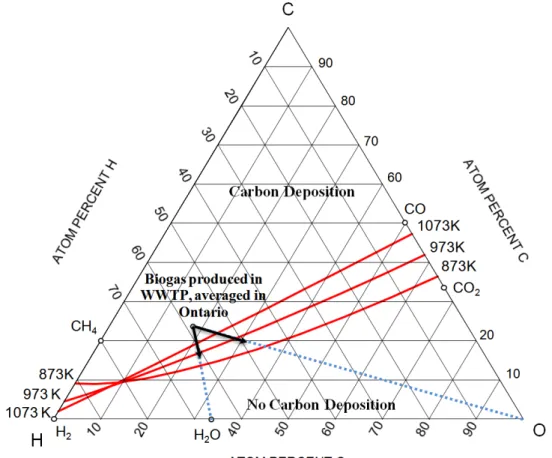
temperatures of 873 K, 973 K, and 1073 K under atmospheric pressure are shown in the C-H-O ternary diagram in Fig. 1. According to this figure, the biogas is located above the carbon deposition curves, indicating the solid carbon deposition that should be prevented over the anode catalyst [15]. By adding water and/or the sources of oxygen to the biogas or increasing the equilibrium temperature, the carbon deposition can be prevented or reduced.
Fig. 1. The location of the average biogas produced in WWTPs in Ontario and carbon deposition curves at atmospheric pressure in the C-H-O ternary diagram.
The configuration of biogas-fuelled SOFC micro-CHP systems is shown in Fig. 2. The systems are mainly comprised of an SOFC stack to produce DC electricity and heat; an air heater to increase the temperature of air before entering the SOFC stack; an air blower to overcome the pressure drop in the system; a burner to convert the chemical energy of the unutilized fuel in SOFC stack to heat; a boiler to generate hot water; an inverter to convert the generated DC electricity to AC; and a reformer control volume. The effects of the boiler feedwater pump and the biogas blower on the overall system efficiency and exergy destruction of system are assumed to be negligible.
The reformer control volume is comprised of a biogas clean up system, heater/reformer and a device for mixing anode exit gas (line 15 (I)) for system I, water (line 15 (II)) for system II, and air ((line 15 (III)) for system III with the biogas stream. In the clean up system, the contaminants in the biogas are reduced to the levels acceptable to avoid damaging the anode and/or reformer catalysts. The most attractive and convenient method to remove H2S from the biogas is the use of an activated carbon bed. This method
is highly effective at relatively low loadings of H2S (<200 ppm) [16]. In the case of high H2S
content, additional H2S removal technologies are required to reduce the H2S content to
below 200 ppm. A similar absorption bed can be used to remove silicon compounds [14] that cause the significant deactivation of anode catalysts.
Fig. 2. The configuration of the biogas-fuelled SOFC micro-CHP systems (system I with AGR, system II with SR, and system III with POX reformer).
2. Computer simulation of the SOFC micro-CHP systems
To evaluate the performance of the biogas-fuelled SOFC systems, a computer code developed for the simulation of planar SOFCs at cell, stack and system levels was used. In the computer code, a detailed model of the cell including chemical and electrochemical reactions, thermodynamics, polarizations, and transport phenomena has been considered. In the stack level, heat transfer from the SOFC stack and its effect on the cell performance has been taken into account. The balance of plant (BOP) such as heater, blower, and burner was thermodynamically modelled at steady state operating conditions. To prevent carbon deposition over the anode catalyst, the minimum required flow rate of anode gas recirculation for system I, water for system II and air for system III was determined from thermodynamic equilibrium. In the cell level, it was assumed that the inlet and outlet fuel streams from cells are in thermodynamic equilibrium. In the stack level, a 5% voltage drop in the SOFC stack was considered. In the system level, heat transfer from the air heater, reformer, burner, and boiler was assumed negligible.
To validate the computer code in the cell level, the performance of ESC 4 electrolyte-supported cells produced by H.C. Strack Company [17] was simulated. As shown in Fig. 3, the cell performance predicted by the computer simulation shows a satisfactory agreement with the experimental data at the cell operating temperature of 850 °C.
Fig. 3. Results of the computer simulation and experiment for ESC 4 cells.
The electrolyte-supported cell used in the computer simulation is comprised of Ni/GDC (Gadolinia-doped Ceria) anode, dense YSZ (Yttrium Stabilized Zirconia) electrolyte and YSZ/LSM (Lanthanum Strontium Manganese Oxide) cathode. Input data to evaluate the SOFC systems are listed in Table 1.
Table 1. Input data for simulation of the biogas-fuelled SOFC micro-CHP systems.
Parameter Value
Cell operating temperature 850 °C Cell operating pressure 1 atm Fuel inlet temperature to the SOFC stack 750 °C Air inlet temperature to the SOFC stack 700 °C Fuel utilization ratio (Uf) 60%, 70%, 80%
Anode thickness porosity tortuosity 40 μm 0.33 (-) 4 (-) Cathode thickness porosity tortuosity 40 μm 0.33 (-) 4 (-) Electrolyte thickness 90 μm Interconnect thickness 3000 μm Cell active length 10 cm Cell active width 10 cm Insulation system of the SOFC
stack
thickness 50 mm
thermal conductivity 0.025 Wm-1K-1 Emissivity of the outer surface of the SOFC stack 0.8 (-) Number of cells in the SOFC stack 27 Net AC electric power output from the SOFC system ≈ 1 kWe Pressure drop in the system 0.3 bar
Air blower efficiency 62.5% Inlet cold water temperature to the boiler 40 °C
Outlet hot water temperature from the boiler 90 °C DC to AC inverter efficiency 92% Flue gas exhaust temperature TdewPoint+50 °C
3. Results and Discussion
According to the input data in Table 1, the results of the computer simulation for the biogas-fuelled SOFC micro-CHP systems are obtained and listed in Table 2. To prevent carbon deposition over the anode catalyst, the minimum mass flow rate of the reforming agent (recirculated anode gas for system I, water for system II and air for system III) for each system was determined. The minimum AGR for system I depends on the fuel utilization ratio (Uf) and is equal to 0.63, 0.68, and 0.74 of the input biogas mass flow rate
at Uf=80, 70 and 60%, respectively. The minimum mass flow rate of water for system II
and air for system III is 0.29 and 1.08 of the input biogas mass flow rate, respectively, and these values are independent of the Uf.
The results show that at a specific Uf, the inlet biogas mass flow rate to system I is minimal
among the studied systems. At Uf=80%, the inlet biogas flow rate to systems I to III is
approximately 0.432, 0.436 and 0.536 kg/hr, respectively.
System I exhibits the net AC electrical efficiency of 42.4, 40.5 and 37.5% at Uf= 80, 70,
and 60%, respectively, which is maximal among the studied systems. At Uf=80%, the AC
electrical efficiency of systems II and III is around 41.7 and 33.9%, respectively.
The computer simulation of system III provides the highest CHP efficiency among the studied systems, and is followed by systems I and II. At Uf=60%, the CHP efficiency of
systems I to III are around 80.4, 77.6, and 84.5%, respectively.
The operating voltage of system II is maximal among the studied system. At Uf=60%, it
reaches around 17.5 V; however, it is around 17.3 V for system I and 17.1 V for system III. The excess air required to control the temperature of the SOFC stack is minimal for system II and accordingly, the size and initial investment cost for the air heater, air blower, boiler, and burner are minimal for this system compared to systems I and III.
The TER of systems I and II at Uf=70 and 80% is well-matched with the TER based on the
domestic hot water demands for single-family detached dwellings [13]. The studies show that the TER of system III is suitable for this application at Uf=90%.
The exergy analysis shows that the total exergy destruction of systems I and II are very close, especially at Uf>80%, and are significantly less than that in system III.
Table 2. The results obtained from the computer simulation for the SOFC micro-CHP systems.
Item System I (AGR) System II (SR) System III (POX)
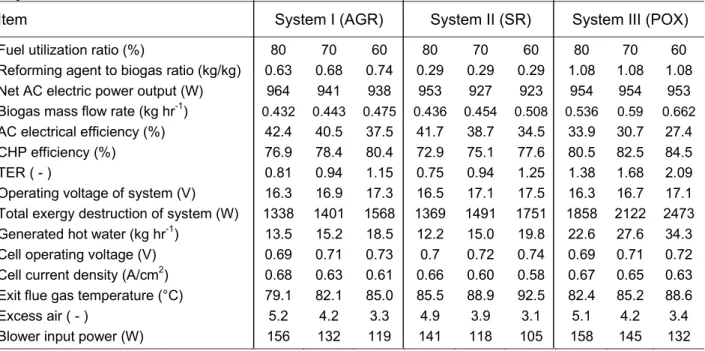
Fuel utilization ratio (%) 80 70 60 80 70 60 80 70 60 Reforming agent to biogas ratio (kg/kg) 0.63 0.68 0.74 0.29 0.29 0.29 1.08 1.08 1.08 Net AC electric power output (W) 964 941 938 953 927 923 954 954 953 Biogas mass flow rate (kg hr-1) 0.432 0.443 0.475 0.436 0.454 0.508 0.536 0.59 0.662
AC electrical efficiency (%) 42.4 40.5 37.5 41.7 38.7 34.5 33.9 30.7 27.4 CHP efficiency (%) 76.9 78.4 80.4 72.9 75.1 77.6 80.5 82.5 84.5 TER ( - ) 0.81 0.94 1.15 0.75 0.94 1.25 1.38 1.68 2.09 Operating voltage of system (V) 16.3 16.9 17.3 16.5 17.1 17.5 16.3 16.7 17.1 Total exergy destruction of system (W) 1338 1401 1568 1369 1491 1751 1858 2122 2473 Generated hot water (kg hr-1) 13.5 15.2 18.5 12.2 15.0 19.8 22.6 27.6 34.3 Cell operating voltage (V) 0.69 0.71 0.73 0.7 0.72 0.74 0.69 0.71 0.72 Cell current density (A/cm2) 0.68 0.63 0.61 0.66 0.60 0.58 0.67 0.65 0.63 Exit flue gas temperature (°C) 79.1 82.1 85.0 85.5 88.9 92.5 82.4 85.2 88.6 Excess air ( - ) 5.2 4.2 3.3 4.9 3.9 3.1 5.1 4.2 3.4 Blower input power (W) 156 132 119 141 118 105 158 145 132
3.1. Exergy analysis
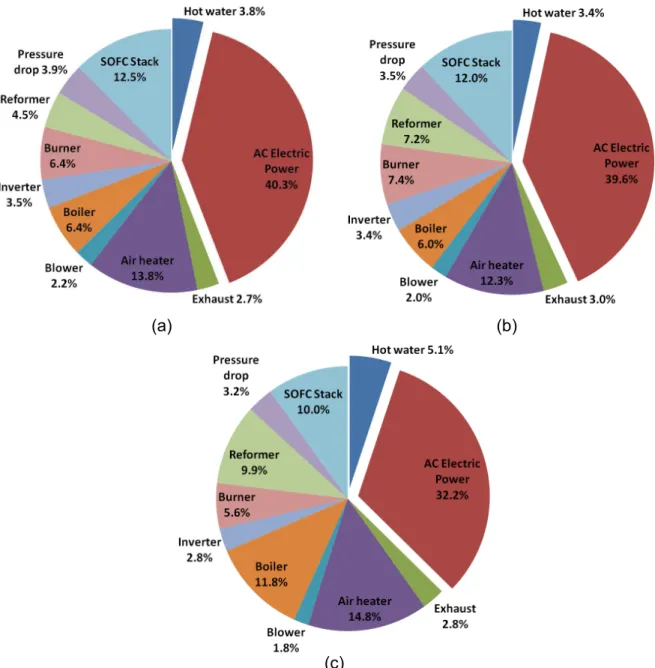
Fig. 4 shows the share of each component in exergy destruction of the input biogas to the studied systems at Uf=80%. According to this figure, the exergy destruction in the SOFC
stack is not as significant as the air heater because the heat generated due to polarizations in a high temperature cell is valuable for generating more electricity. In all the studied systems, the air heater has the largest share in exergy destruction of the input biogas, and is followed by the SOFC stack and burner/boiler for system I, the SOFC stack and burner for system II, and the boiler and SOFC stack for system III. There is a considerable potential to generate more electricity from these systems if they are combined with other power generation systems (e.g. thermal cycles) and appropriately optimized using pinch technology and exergy analysis [18-19].
(a) (b)
(c)
Fig. 4. The share of each component in exergy destruction of the input biogas to the (a) system I with AGR, (b) system II with SR, and (c) system III with POX reformer at Uf=80%.
3.2. Performance of systems I to III at different operating voltages of a cell
For the results shown in Table 2, an SOFC stack with 27 cells was employed for each system. Based on the number of cells, the operating voltage of a cell is averagely around 0.7 V to generate around 1 kW net AC electric power. Since the SOFC stack represents 30 to 50% of the initial investment cost of an SOFC system [20], the number of cells has an important role for economically optimizing the SOFC systems. Therefore, it is useful to determine the correlation between the cell operating voltage and SOFC stack performance-related parameters such as the number of cells, TER, and electrical/CHP efficiencies of the studied systems at different fuel utilization ratios.
According to Fig. 5, the number of cells changes parabolically with the cell operating voltage. The cell operating voltage at which the minimum number of cells is obtained for the studied systems at different fuel utilization ratios are listed in Table 3. In the investigated range of the cell operating voltage, the number of cells reduces with decreasing the Uf in all the studied systems. The TER for all the studied systems increases
progressively with decreasing the cell operating voltage. The TER increases also with decreasing the Uf. The TER of system III is higher than that of systems I and II at any cell
operating voltages. (a)
(c)
Fig. 5. Effect of the cell operating voltage on the number of cells in SOFC stack and TER in (a) system I with AGR, (b) system II with SR, and (c) system III with POX. Table 3. The cell operating voltage at which the minimum number of cells is obtained.
System I System II System III Fuel utilization ratio (%) 60 70 80 60 70 80 60 70 80 Cell operating voltage (V) 0.62 0.58 0.55 0.57 0.61 0.62 0.58 0.60 0.61 Minimum number of cells (-) 21 22 23 21 22 23 22 23 24 As shown in Fig. 6, the increase of the cell operating voltage leads to a linear increase in the net AC electrical efficiency of all the studied systems. In the investigated range of the cell operating voltage, the net AC electrical efficiency is higher at elevated Uf. The net AC
electrical efficiency of system I is also maximal at any cell operating voltages among the studied systems, and is followed by systems II and III.
(b)
(c)
Fig. 6. Effect of the cell operating voltage on the net AC electrical efficiency and CHP efficiency in (a) system I with AGR (b) system II with SR, and (c) system III with POX. According to Fig. 6, the CHP efficiency of all the studied systems is almost constant at cell operating voltages less than 0.65 V and decreases for systems II and III once the cell operating voltage exceeds 0.65 V. The CHP efficiency of system II is less than that of systems I and III.
Our studies also show that the decrease of the cell operating voltage leads to an increase in the excess air required controlling the temperature of SOFC stack and accordingly, the size and initial investment cost for the BOP components such as air heater, air blower, boiler, and burner increase for all the studied systems.
According to the effect of the cell operating voltage on the number of cells, TER, excess air, and net AC electrical and CHP efficiencies, the cell operating voltages can be divided into two groups. The cell operating voltages of the first group are less than the cell
operating voltage at which the minimum number of cells is obtained, and the cell operating voltages of the second group are larger than this value. The decrease of the cell operating voltage in the first group leads to an increase in the number of cells and excess air. Hence, the size of the SOFC stack, air heater, air blower, boiler, and burner and consequently, the total initial investment cost of all systems increase. The decrease of the cell operating voltage in this group also leads to an increase in TER from the TER required for domestic hot water demands for residential applications and a decrease in the net AC electrical efficiency; however the CHP efficiency remains almost constant. Therefore, the optimum cell operating voltage is not in the first group and should be found from the second group of cell operating voltages for systems I to III by a comprehensive economic analysis.
4. Conclusions
Three configurations of biogas-fuelled SOFC micro-CHP systems with different fuel processing methods were studied for residential application. Anode gas recirculation, steam reforming, and partial oxidation were the fuel processing methods employed in systems I to III, respectively. The electrolyte-supported planar cells with Ni-GDC anode, dense YSZ electrolyte, and YSZ-LSM cathode, operated at 850 °C, were used for computer simulation of these systems. The results of this study are summarized as follows:
• Biogas is a suitable fuel for these systems because the amount of reforming agent reduces with increasing the CO2 content of a fuel.
• The net AC electrical efficiency of system I is maximal among the studied systems, and is followed by systems II and III.
• The CHP efficiency of system II is minimal among the studied systems.
• The TER of systems I and II at Uf=70 and 80% and system III at Uf=90% are suitable to
produce the domestic hot water demands for single-family detached dwellings (number of cells=27).
• The air heater has the largest share in exergy destruction of the biogas in the three systems. There is a considerable potential to generate more electricity if the systems are combined with other power generation systems.
• The increase of the cell operating voltage leads to a linear increase in the net AC electrical efficiency of all the studied systems.
• The number of cells in the SOFC stack changes parabolically with the cell operating voltage.
• The TER of all the studied systems increases progressively with decreasing the cell operating voltage.
• The CHP efficiency of all the studied systems is almost constant at cell operating voltages less than 0.65V and decreases in systems II and III once the operating voltage exceeds 0.65 V.
• The decrease of the cell operating voltage leads to an increase in the excess air and accordingly, the size and initial investment cost of the air heater, air blower, boiler, and burner increase for all the studied systems.
• The minimum number of cells in SOFC stack is obtained at 0.55, 0.58, and 0.62 V in system I; 0.62, 0.61 and 0.57 V in system II; and 0.61, 0.6 and 0.58V in system III; for a Uf of 80, 70 and 60%, respectively.
• The optimum cell operating voltage is higher than the operating voltage at which the minimum number of cells is obtained, and it should be selected by a detailed economic analysis.
Acknowledgments
The authors gratefully acknowledge financial support provided by NSERC of Canada, EcoEnergy Technology Initiative Program, and AAFC-NRC Bioproducts Program.
References
[1] United Nations Development Programme (UNDP) Report, Energy After Rio: Prospects and Challenges, 1997.
[2] S. Trogisch, J. Hoffmann, L. Daza Bertrand, Operation of molten carbonate fuel cells with different biogas sources: A challenging approach for field trials, J. of Power Sources 145 (2005) 632–638.
[3] J. Van herle Y. Membrez, O. Bucheli, Biogas as a fuel source for SOFC co-generators, J. of Power Sources 127 (2004) 300–312.
[4] R. Bove, P. Lunghi, Experimental comparison of MCFC performance using three different biogas types and methane, J. of Power Sources 145 (2005) 588–593.
[5] M. Jenne, T. Dörk, A. Schuler, Proceedings of the Fifth European Solid Oxide Fuel Cell Forum, Lucerne, Switzerland, European Forum Secretariat, CH 5442-Oberrohrdorf, Switzerland, 460– 466, 2002.
[6] Y. Yi, A.D. Rao, J.Brouwer, G.S. Samuelsen, Fuel flexibility study of an integrated 25kW SOFC reformer system, J. of Power Sources 144 (2005) 67–76.
[7] S. Assabumrungrat, N. Laosiripojana, V. Pavarajarn, W. Sangtongkitcharoen, A. Tangjitmatee, P. Praserthdam, Thermodynamic Analysis of Carbon Formation in Solid Oxide Fuel Cells with a Direct Internal Reformer Fueled by Methanol, J. Power Sources 139 (2005) 55-60.
[8] W. Sangtongkitcharoen, S. Assabumrungrat, V. Pavarajarn, N. Laosiripojana, P. Praserthdam, Comparison of Carbon Formation Boundary for Different Types of Solid Oxide Fuel Cells with Methane Feed, J. Power Sources 142 (2005) 75-80.
[9] E. Achenbach, E. Riensche, Methane/steam reforming kinetics for solid oxide fuel cells, J. of Power Sources 52 (1994) 283–288.
[10] P. Piroonlerkgula, N. Laosiripojanab, A.A. Adesinac, S. Assabumrungrat, Performance of biogas-fed solid oxide fuel cell systems integrated with membrane module for CO2 removal, Chemical
Engineering and Processing 48 (2009) 672–682.
[11] S. Farhad, F. Hamdullahpur, Developing fuel map to predict the effect of fuel composition on the maximum efficiency of solid oxide fuel cells, J. of Power Sources, 2009, doi:10.1016/j.jpowsour.2009.03.054.
[12] Braun, R. J., Kleina, S. A., and Reindla, D. T., 2006, Evaluation of System Configurations for Solid Oxide Fuel Cell-based Micro-combined Heat and Power Generators in Residential Applications, J. of Power Sources 158(2) 1290-1305.
[13] R.J. Braun, S.A. Klein, D.T. Reindl, Considerations in the design and application of solid oxide fuel cell energy systems in residential markets, ASHRAE Trans. 110 (2004), Part I.
[14] I. Wheeldon, C. Caners, K. Karan, and B. Peppley, Utilization of Biogas Generated from Ontario Wastewater Treatment Plants in Solid Oxide Fuel Cell Systems: A Process Modeling Study, Int. J. of Green Energy 4 (2007) 221-231.
[15] S. Farhad, F. Hamdullahpur, Developing fuel map to predict the effect of fuel composition on the maximum voltage of solid oxide fuel cells, J. of Power Sources, 2009, doi:10.1016/j.jpowsour.2009.02.073.
[16] R. Yan, D.T. Liang, L. Tsen, and J.H. Tay, Kinetics and Mechanism of H2S Adsorption by Alkaline
Activated Carbon, Environ. Sci. Technol 36 (2002) 4460-4466.
[17] H.C. Strack company, www.hcstarck-ceramics.com/, accessed in April 2009.
[18] S. Farhad, M. Saffar-Avval, M. Younessi-Sinaki, Efficient design of feedwater heaters network in steam power plants using pinch technology and exergy analysis, International Journal of Energy Research 32 (1) 2007 1-11.
[19] S. Farhad, M. Younessi-Sinaki, M.R. Golriz, F. Hamdullahpur, Exergy analysis and performance evaluation of CNG to LNG converting process, International Journal of Exergy 5(2) 2008 164-176.
[20] T. Nietsch, J. Clark, Market oriented design studies for SOFC based systems, ETSU report F/0.1/00129/REP, 1999.