Publisher’s version / Version de l'éditeur:
Vous avez des questions? Nous pouvons vous aider. Pour communiquer directement avec un auteur, consultez la première page de la revue dans laquelle son article a été publié afin de trouver ses coordonnées. Si vous n’arrivez Questions? Contact the NRC Publications Archive team at
PublicationsArchive-ArchivesPublications@nrc-cnrc.gc.ca. If you wish to email the authors directly, please see the first page of the publication for their contact information.
https://publications-cnrc.canada.ca/fra/droits
L’accès à ce site Web et l’utilisation de son contenu sont assujettis aux conditions présentées dans le site LISEZ CES CONDITIONS ATTENTIVEMENT AVANT D’UTILISER CE SITE WEB.
Client Report (National Research Council of Canada. Construction), 2014-12
READ THESE TERMS AND CONDITIONS CAREFULLY BEFORE USING THIS WEBSITE.
https://nrc-publications.canada.ca/eng/copyright
NRC Publications Archive Record / Notice des Archives des publications du CNRC :
https://nrc-publications.canada.ca/eng/view/object/?id=bbc47a31-963d-4b21-8401-936de1ba03f4 https://publications-cnrc.canada.ca/fra/voir/objet/?id=bbc47a31-963d-4b21-8401-936de1ba03f4
NRC Publications Archive
Archives des publications du CNRC
For the publisher’s version, please access the DOI link below./ Pour consulter la version de l’éditeur, utilisez le lien DOI ci-dessous.
https://doi.org/10.4224/21274556
Access and use of this website and the material on it are subject to the Terms and Conditions set forth at
Fire safety summary: Fire research conducted for the project on
mid-rise wood construction: report to Research Consortium for Wood and
Wood-Hybrid Mid-Rise Buildings
NATIONAL RESEARCH COUNCIL CANADA
REPORT TO RESEARCH CONSORTIUM
FOR WOOD AND WOOD-HYBRID
MID-RISE BUILDINGS
Fire Safety Summary – Fire Research
Conducted for the Project on Mid-Rise
Wood Construction
CLIENT REPORT: A1-004377.1
REPORT TO RESEARCH CONSORTIUM FOR WOOD AND
WOOD-HYBRID MID-RISE BUILDINGS
Fire Safety Summary – Fire Research Conducted for the Project
on Mid-Rise Wood Construction
J.Z. Su and G.D. Lougheed
Report No.
A1- 004377.1
Report date: December 31, 2014
Contract No. B-7000 (A1-100035) and A1-004377
Prepared for Canadian Wood Council
FPInnovations
Régie du bâtiment du Québec
HER MAJESTY THE QUEEN IN RIGHT OF ONTARIO as represented by
the Minister of Municipal Affairs and Housing
113 pages
This report may not be reproduced in whole or in part without the written consent of both the client and the National Research Council of Canada.
Table of Contents
1 BACKGROUND AND CONTEXT...1
1.1 Trends on Construction of Tall Wood Buildings outside Canada ...1
1.2 Trends on Construction of Tall Wood Buildings within Canada ...1
1.2.1 Changes to Provincial Building Codes for Mid-rise Wood Construction...1
1.2.2 Context and Limitation of 2010 NBC ...2
1.2.3 Development of Proposed Changes to 2010 NBC ...3
2 R&D NEEDS AND INITIATION OF THE PROJECT...3
3 OBJECTIVES OF THE PROJECT ...4
4 SCOPE OF THE PROJECT...4
5 CONTENT OF THIS REPORT...5
6 PERFORMANCE EFFECTIVENESS AND IMPACT OF SPRINKLER SYSTEM...5
6.1 Sprinkler System Performance Effectiveness...5
6.1.1 Sprinkler Effectiveness ...5
6.1.2 Reasons for Failure to Operate...9
6.1.3 Reasons for Sprinkler Ineffectiveness...11
6.2 Sprinkler Impact on Extent of Flame Damage and Loss of Life ...13
6.3 Summary of Sprinkler Effectiveness and Impact ...17
7 FIRE RESISTANCE TESTS OF WALL ASSEMBLIES FOR USE IN LOWER STOREYS..18
7.1 Wall Assemblies for Fire Resistance Tests ...18
7.2 Results and Summary of Fire Resistance Tests...21
8 WOOD-BASED EXTERIOR WALLS FOR LIMITING FIRE SPREAD...22
8.1 Test Facility and Exterior Wall Assemblies...23
8.1.1 Lightweight Wood-Frame (LWF) Assemblies and Insulation ...23
8.1.2 Cross-Laminated Timber (CLT) Assemblies and Insulation...24
8.1.3 Sheathing and Cladding...24
8.1.4 Rain Screen Test Assembly...25
8.2 Procedure for Exterior Wall Fire Tests ...25
8.3 Results of Exterior Wall Tests ...26
8.4 Implications of Exterior Wall Tests ...27
9 ENCAPSULATION – ALTERNATIVE TO NONCOMBUSTIBLE CONSTRUCTION ...30
9.1 Requirements for Noncombustible Construction ...30
9.2.1 Criteria for Evaluating Performance of Encapsulation Materials...31
9.2.2 Determination of Encapsulation Time...32
9.2.3 Dependence of Encapsulation Time on Fire Exposure Conditions ...32
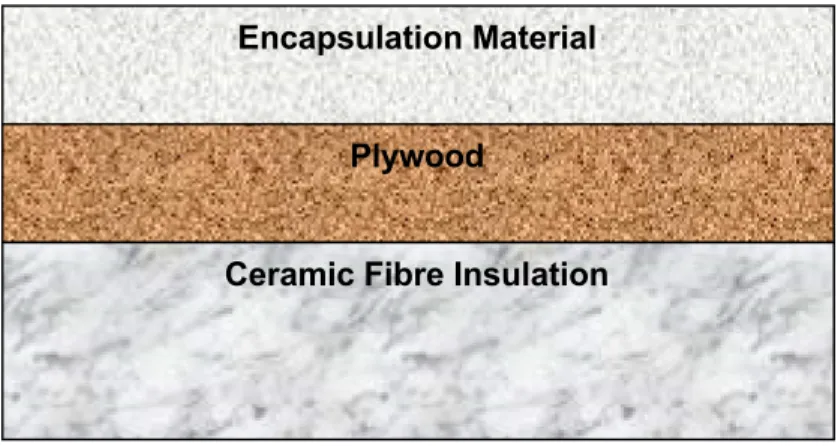
9.3 Cone Calorimeter Tests of Encapsulation Materials...32
9.4 Intermediate-Scale Furnace Tests of Encapsulation Materials...36
9.4.1 Test Method and Assembly...36
9.4.2 Fire Exposures with Standard and Non-standard Time-Temperature Curves...36
9.4.3 Results and Discussion for the Intermediate-scale Tests ...37
9.5 Assembly Encapsulation in Full-Scale Furnace Tests with Standard Fire Exposure....47
9.5.1 Encapsulation Performance of Assemblies Tested under This Project...47
9.5.2 Comparison with Intermediate-Scale and Other Full-Scale Tests with Standard Fire Exposure ...55
9.6 Large-Scale Apartment Encapsulation Tests ...59
9.6.1 Large-Scale Apartment Fire Test Facility ...59
9.6.2 Key Results from Large-Scale Apartment Fire Tests...72
9.6.3 Comparison with Intermediate-Scale Tests with Non-standard Fire Exposure ...104
9.6.4 Summary of Large-Scale Apartment Fire Tests ...105
10 FURTHER INVESTIGATIONS NEEDED...108
11 CONCLUSIONS ...109
12 ACKNOWLEDGMENTS ...110
List of Tables
Table 1. Automatic extinguishing equipment reliability and effectiveness when fire coded as non-confined and large enough to activate equipment and equipment was present in area
of fire, by property use 2007-2011 U.S. structure fires, all sprinklers...8
Table 2. Automatic extinguishing equipment reliability and effectiveness when fire coded as non-confined and large enough to activate equipment and equipment was present in area of fire by sprinkler system 2007-2011 U.S. structure fires, all structures. ...9
Table 3. Reasons for failure to operate when fire was coded as not confined and large enough to activate equipment and equipment was present in area of fire, by property use based on estimated number of 2007-2011 structure fires per year. ...10
Table 4. Reasons for ineffectiveness when fire was coded as not confined and large enough to activate equipment and equipment was present in area of fire, by property use based on estimated number of 2007-2011 structure fires per year. ...12
Table 5. Extent of Flame Damage for Sprinklers Present vs. Automatic Extinguishing Equipment Absent 2007-2011 Structure Fires. ...14
Table 6. Estimated Reduction in Civilian Deaths per Thousand Fires Associated With Wet Pipe Sprinklers, by Property Use 2007-2011 Structure Fires...15
Table 7. Estimated Reduction in Civilian Deaths per Thousand Fires Associated With Sprinklers, by Property Use 2006-2011 Structure Fires. ...15
Table 8. Fire Resistance Tests of Wall Assemblies with Staggered Studs ...20
Table 9. Generic exterior wall assemblies and fire experiment results using CAN/ULC-S134 test method...29
Table 10. Times for exceeding temperature rise criteria and average interface temperature at plywood ignition ...34
Table 11. Times for exceeding temperature rise criteria and average interface temperature at plywood ignition ...34
Table 12. Times for exceeding temperature rise criteria and average interface temperature at plywood ignition ...35
Table 13. Times for exceeding temperature rise criteria and average interface temperature at plywood ignition ...35
Table 14. Summary of results for tests on encapsulation materials with intermediate-scale furnace...38
Table 15. Comparison of encapsulation times based on Criteria 3 for standard and non-standard time temperature exposures...47
Table 16. Time to average temperatures of 300C and fall-off of gypsum board face layer...49
Table 17. Time to average temperature > 300C in wall cavity...52
Table 18. Temperatures on unexposed side of test assembly at failure. ...54
Table 19. Times for temperature rises to exceed criteria*...54
Table 21. Construction details of CLT apartment (Apt CLT) ...67
Table 22. Construction details of LSF apartment (Apt LSF)...68
Table 23. Construction details of LWF apartment #2 (Apt LWF2)...69
Table 24. Peak Heat Flux and Heat Release Rate ...81
Table 25. Time (min) to Reach Specified Value of Temperature or Temperature Rise ...87
Table 26. Encapsulation times from large-scale apartment tests and intermediate-scale furnace tests (non-standard fire). ...104
List of Figures
Figure 1. Reason when sprinklers fail to operate 2007-2011...10
Figure 2. Reason when sprinklers are ineffective 2007-2011 ...12
Figure 3. Extent of fire spread for sprinkler protected buildings by property classification. ...16
Figure 4. Extent of fire spread for buildings without sprinkler protection, by property classification. ...16
Figure 5. Average deflections...22
Figure 6. Tests of Exterior Wall Assemblies. ...28
Figure 7. Test sample cross-section for cone tests with encapsulation materials. ...33
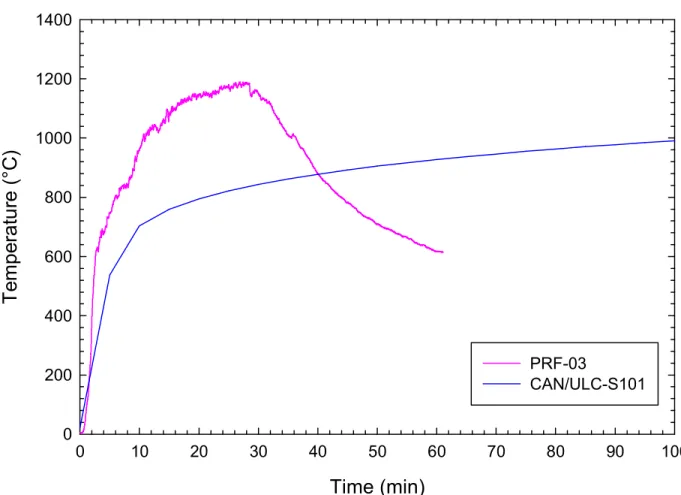
Figure 8. Standard and non-standard time-temperature curves used in the intermediate-scale furnace tests. ...37
Figure 9. Temperature rise value profiles at the interface between the encapsulation material and the plywood substrate in intermediate-scale furnace tests...39
Figure 10. With standard fire exposure, average temperature rise between face layer gypsum board and plywood or gypsum board base layer...40
Figure 11. With standard fire exposure, average temperature rise beneath face layer cement board and gypsum-concrete encapsulation materials...41
Figure 12. With standard fire exposure, average temperature rise beneath base layer of two layers encapsulation material...42
Figure 13. Average furnace temperatures with standard and non-standard time-temperature curves. ...42
Figure 14. With non-standard fire exposure, average temperature rise at interface below gypsum board face and base layers, Tests 10 and 11. ...43
Figure 15. Encapsulation times in intermediate-scale tests with standard fire exposure...45
Figure 16. Exemplar thermocouple locations at two heights...48
Figure 17. Average temperature profiles at interface between gypsum board face and base layers. ...49
Figure 18. Average temperatures at interface between gypsum board base layer (exposed side) and stud framing. ...50
Figure 19. Average temperatures at interface between back side of gypsum board base layer (exposed side) and cavity. ...50
Figure 20. Average temperatures on the sides of the studs on the exposed side of the test assemblies...51
Figure 21. Average temperatures on the exposed face of the studs (facing the fire) on the unexposed side of the test assembly. ...52
Figure 22. Average temperatures on the unexposed face of the studs (facing away from the fire) on the exposed side of the test assembly...53
Figure 23. Average temperatures measured on the base layer on the unexposed side of the test assembly...53
Figure 24. Encapsulation time 1 layer 12.7 mm thick Type X gypsum board using Criteria 3. ...56
Figure 25. Encapsulation time 1 layer 15.9 mm thick Type X gypsum board using Criteria 3. ...57
Figure 26. Encapsulation time 2 layers 12.7 mm thick Type X gypsum board using Criteria 3. .57 Figure 27. Large-scale apartment encapsulation test setup. ...60
Figure 28. One of the large-scale apartment test setups. ...61
Figure 29. Large-scale apartment test structures under construction. ...70
Figure 30. Contribution of bedroom furniture and contents to fire development and comparison with standard time-temperature curve. ...72
Figure 31. Flashover in both the bedroom and living room areas during large-scale apartment fire tests. ...74
Figure 32. Average temperatures in bedroom. ...75
Figure 33. Average temperatures in living room, kitchen and entryway...76
Figure 34. Ventilation conditions through the exterior openings during the large-scale apartment fire tests. ...79
Figure 35. Heat release rate...82
Figure 36. Heat flux from opening to façade...83
Figure 37. Heat flux from bedroom opening. ...84
Figure 38. Heat flux from living room opening. ...85
Figure 39. Temperatures at various interfaces in the bedroom WA2 wall assemblies. ...90
Figure 40. Temperatures at various interfaces in the bedroom floor assemblies. ...93
Figure 41. Temperatures in ceiling cavities versus temperatures in fire compartment at the 2.4 m height during Test Apt LSF...99
Figure 42. Temperatures in ceiling cavities versus temperatures in fire compartment at the 2.4 m height during Test Apt LWF1...100
Figure 43. Temperatures in ceiling cavities versus temperatures in fire compartment at the 2.4 m height during Test Apt LWF2...101
Figure 44. Temperatures at the interface between gypsum board and CLT in the ceiling assemblies versus ...102
Figure 45. Temperatures at various interfaces at the centre in the bedroom ceiling assemblies. ...103
Fire Safety Summary – Fire Research Conducted for the
Project on Mid-rise Wood Construction
J.Z. Su and G.D. Lougheed
1 BACKGROUND AND CONTEXT
1.1 Trends on Construction of Tall Wood Buildings outside Canada
Wood, a traditional construction material, has gained renewed interest from building sector stakeholders. Different affected parties around the world are looking for the means to
accommodate an increasing population to live and work, while contributing to sustainability and sustainable development through healthy and economical building construction with reduced energy consumption and environmental impacts throughout the life cycles of the built
environment. Wood is a naturally renewable building material that sequesters carbon dioxide, which helps to reduce the carbon footprint of the built environment. Designers and developers around the world are expanding the use of wood-based structures in higher and larger buildings. Demands for mid-rise wood buildings are increasing with urban building densification and in-fill projects, which increase the demand for use of wood materials, as they have been shown to reduce adverse impacts on the environment, compared to other construction materials.
Most European countries now allow the construction of timber buildings for five or more storeys even without sprinklers; by 2020 all remaining European Union member countries are expected to permit mid-rise or higher wood buildings [1]. In the western US, five-storey wood buildings have been built over one- or two-storey concrete construction with ground retail floor and/or underground parking spaces [2]. The restriction on the number of storeys that can be built with timber structures was removed in the New Zealand Building Codes in 1992 and mid-rise wood buildings have been built within New Zealand since then [3]. In recent years, a large number of mid-rise and tall wood buildings have been constructed around the world [4].
1.2 Trends on Construction of Tall Wood Buildings within Canada
1.2.1 Changes to Provincial Building Codes for Mid-rise Wood Construction
In Canada, building codes are under the jurisdiction of the provinces and territories. All buildings must satisfy, at a minimum, building code requirements enforced by local jurisdictions. Most jurisdictions only permit construction of wood buildings up to four storeys in building height (above grade), as does the model National Building Code of Canada 2010.
In 2009, British Columbia amended its building code to allow mid-rise residential buildings of wood construction up to six storeys. Since then, many mid-rise wood buildings have been constructed across the province.
Quebec Building Regulations were first amended in the fall of 2013 to establish rules under the ‘alternative solution’ path to allow up to six storey residential wood buildings. Later, in
September 2014, Quebec published detailed proposed changes for public consultation to the Quebec Construction Code that would adopt prescriptive ‘acceptable solutions’ to permit 5- and 6-storey wood construction for both residential and business occupancies. Approval of the changes is expected in 2015.
Similarly, in March 2014, amendments to Ontario Regulation 332/12 (Building Code) were proposed to permit the construction of residential buildings and office buildings of wood
construction for up to six storeys, with mixed use occupancies including restaurants, stores, and medical offices permitted on the first and second storeys. These changes have subsequently
been confirmed and will come into effect January 1st, 2015.
1.2.2 Context and Limitation of 2010 NBC
The National Building Code (NBC) of Canada is a model construction code that is adopted in its entirety, or adapted for regional variances, by the individual Provinces and Territories in Canada who have jurisdiction over building regulations. The NBC provides minimum requirements for safety, health, accessibility, fire and structural protection in the design and construction of new buildings. It also applies to the substantial renovation and the demolition or relocation of existing buildings.
The Canadian Commission on Building and Fire Codes (CCBFC) and its standing committees are responsible for the development and maintenance of the NBC using a broad-based consensus process. A new version of the Code is published approximately every five years. The current 2010 NBC is an objective-based code [5]. Compliance with the Code is achieved by directly applying the acceptable solutions in Division B or by using alternative solutions
according to Division A. The acceptable solutions are prescriptive requirements. The alternative solutions are performance based compliance approaches related to the functional statements and code objectives associated with the minimum level of performance deemed afforded by the acceptable solutions.
Depending on the occupancy classification, most buildings of four storeys or less in height are permitted to be of combustible and/or non-combustible construction under the prescriptive acceptable solutions in Division B. For buildings greater than four storeys in height, the prescriptive provisions require that the main structural elements in the building be of noncombustible construction.
For designers and builders wishing to use structural building materials that are combustible in higher buildings, they can use the alternative solutions approach allowed under Division A. However, they must clearly demonstrate to the Authority Having Jurisdiction (AHJ) that compliance to the Code is achieved, i.e., the alternative solutions meet the minimum level of performance required by Division B in the areas defined by the objectives and functional statements attributed to the applicable acceptable solutions. The burden of proof is placed on the designers and builders. This can be an onerous process. From one jurisdiction to another, there is no harmonization in the approach used to demonstrate the compliance.
1.2.3 Development of Proposed Changes to 2010 NBC
The Province of British Columbia and the Canadian Wood Council made independent
submissions in October 2010 and March 2011, respectively, to the CCBFC to request changes to the 2010 NBC Division B to allow the use of wood structural elements in mid-rise buildings. The 2010 NBC required the use of noncombustible structural systems for such buildings. A Joint Task Group (JTG) on Mid-rise Combustible Construction was established in June 2011 by the CCBFC that involved input from five CCBFC Standing Committees (Fire Protection, Use and Egress, Structural Design, Earthquake Design, Environmental Separation). In the first phase of their work, the JTG mandate was to review the code change requests, existing requirements and relevant information and to develop code change proposals for the 2015 NBC, if
appropriate. The JTG’s mandate for its second phase of work includes the development of performance based requirements for future editions of the code.
2 R&D NEEDS AND INITIATION OF THE PROJECT
Comprehensive research on the use of wood structural elements in mid-rise buildings is
required in order to develop additional sound science and technological data for use in the code development process and for the design and construction of such buildings, while meeting the health and safety objectives for the building occupants.
The Canadian Wood Council requested that the National Research Council (NRC) undertake a research project to develop data that could be used to support the evaluation of the code change requests for incorporating requirements into the 2015 NBC to permit the use of wood structural products in mid-rise buildings, and to also facilitate the implementation of future demonstration projects.
Working in collaboration with the Canadian Wood Council and FPInnovations and in partnership with Natural Resources Canada and the governments of Ontario, Quebec and British Columbia, the National Research Council conducted a comprehensive research project, Research
Consortium for Wood and Wood-Hybrid Mid-rise Buildings. This consortium project aimed to
develop technical information that could be used to support acceptable solutions that meet the NBC’s objectives for fire safety, acoustics, and building envelope performance, in order to facilitate the use of wood-based structural materials in mid-rise buildings.
A Consultation Group of key industry stakeholders and regulatory bodies was established by NRC to provide advice for the research project and to help disseminate the information developed by the project as widely as possible. Members of the Consultation Group
represented building scientists, architects, engineers, regulators, fire services, users, product suppliers and various industries. The Consultation Group held five meetings during the project. Frequent research updates were provided to the CCBFC and the Provincial Territorial Policy Advisory Committee on Codes (PTPACC) through the Canadian Codes Centre and the JTG for their informed decision making.
The research project was coordinated with other research initiatives in Canada, including NEWBuildS (Network for Engineered Wood-based Building Systems, a multi-disciplinary NSERC strategic research network) and the Canadian tall wood building initiative. The latter involved the development of technical guide for the design and construction of tall wood
buildings [6] and also involved demonstration projects for the construction of tall wood buildings in Canada.
3 OBJECTIVES OF THE PROJECT
The objectives of the Wood and Wood-Hybrid Midrise Buildings research project were to develop performance data and technical solutions in the areas of fire safety, acoustics and building envelope pertinent to the use of wood-based structural materials in mid-rise buildings, i.e. to develop an alternative solution to meet the 2010 NBC requirements for non-combustible construction for 5-6 storey (and taller) buildings.
This consortium project aimed to inform the technical discussions by the different CCBFC Standing Committees during the code development process for the 2015 NBC and facilitate the design and construction of mid-rise wood buildings. The research also aimed to provide initial technical data to help address long term needs for establishing performance based
criteria/solutions to provide a "level" playing field for the use of various materials as structural loadbearing elements in mid-rise buildings as well as other buildings. It also aimed to provide technical data to be used to develop design standards and guides.
4 SCOPE OF THE PROJECT
In a scoping study [7], NRC had identified a range of issues and/or gaps pertaining to the use of wood as structural loadbearing elements in buildings higher and larger than the current limits set by the 2010 NBC. This project was intended to address the immediate needs for technical solutions for mid-rise wood buildings that do not compromise the minimum levels of safety and performance required by the 2010 NBC in the areas of fire safety and fire protection, acoustics, and building envelope performance.
Research was conducted in the following interdependent critical thrusts:
1) Investigation of the ‘encapsulation’ approach to limit fire severity and fire effects by protecting combustible wood-based structural assemblies with encapsulation materials; 2) Development of solutions to limit exterior fire spread by protecting combustible wood
exterior wall systems with noncombustible or low-combustible materials and/or fire retardant panels;
3) Development of fire-resistance rated wood-based structural wall assemblies for applications on lower storeys of mid-rise wood buildings, which also meet acoustic performance required by the NBC (The requirements in NBC 2010 are deemed to deal adequately with the objectives and performance for up to 4 storeys. Therefore, the focus of the fire resistant part of the research was on the wall performance of the lower storeys that would support additional loads in mid-rise wood buildings);
4) Development of acoustic solutions that meet current and potential new NBC provisions for airborne sound insulation and also address the impact sound insulation of building systems; and
5) Assessment of the building envelope performance of the wood-based exterior wall systems that are also shown to meet the fire requirements for limiting exterior fire spread.
It is recognized that there are other issues and risks potentially associated with the mid-rise wood buildings that are beyond the scope of this study and therefore were not addressed in this project. These include risks associated with the actual construction process (workmanship, quality control, supervision and inspection), fire-fighting activities and related issues.
5 CONTENT OF THIS REPORT
This consortium research project produced a large amount of technical information and data in the areas of fire safety, acoustics and building envelope performance for use in mid-rise (and taller) wood buildings. The results of the acoustics and building envelope performance are summarized in separate reports [8, 9].
This report consolidates the results of fire research activities (thrusts 1-3) conducted under the project. These include investigation of the encapsulation approach to protect the combustible structural elements, development of wood-based generic exterior wall assemblies to limit exterior fire spread, and development of generic fire resistant light-weight wood-frame wall assemblies for applications in lower storeys of mid-rise wood buildings.
Among others, the minimum fire protection requirements included in the current NBC mid-rise code change proposals include the mandatory use of automatic sprinkler systems throughout the building. The designs of the fire experiments conducted under this research project do not take into account the impact of water that may be discharged from sprinklers during a fire. Sprinklers are highly effective in controlling or suppressing fires where fires are large enough to activate the sprinklers. Therefore, the NRC research documented in this report is only related to the cases where sprinklers are assumed to have failed to operate and/or control the fire in these mid-rise structures.
6 PERFORMANCE EFFECTIVENESS AND IMPACT OF SPRINKLER SYSTEM
6.1 Sprinkler System Performance Effectiveness
In the research to develop information to support an alternative solution for mid-rise wood construction, all the fire tests involving the full-scale apartment tests were conducted without sprinklers. The primary objective of the investigations was to determine the effectiveness of the encapsulation materials in protecting the combustible structural materials to delay the effects of the fire on the combustible structural elements and, as a result, delay the contribution of the combustible structural elements to the fire severity. (i.e., the research investigated the effectiveness of the encapsulation system in a mid-rise fire scenario in which the sprinkler system did not operate or was ineffective in controlling the fire.)
For mid-rise (5- and 6-stories) and taller buildings, the NBC requires that the buildings be fully sprinklered in accordance with NFPA 13 [10]. In this section, the effectiveness of sprinkler systems is analyzed to establish how likely the encapsulation system would be challenged by a fire in actual practice.
6.1.1 Sprinkler Effectiveness
Bukowski et al. [11] discuss different elements of reliability of fire protection systems. They defined a term called “operational reliability”, which is a measure of the probability that a fire protection system will operate as intended when needed. The operational reliability is a measure of component or system operability and it does not take into account the possibility
that the system design does not match the fire hazard(s) in the building. Therefore, there is a need to provide additional information on the likelihood that the fire development is within the system’s design boundaries. Such a measure of reliability is defined by Bukowski et al. [11] as the “performance reliability”, i.e. a measure of the adequacy of the system design.
In fire safety design, it is the combination of operational reliability and performance reliability that is of most interest. It is not possible to only study how often a sprinkler system operates as designed, as information on the system performance in an actual fire is crucial to decide if the system has been successful, or not.
For automatic sprinklers, Hall [12] has combined measures of operational reliability (percent where equipment operated) with measures of performance reliability (percent effective of those that operated) to an overall measure of effectiveness (percent where equipment operated effectively).
Fire statistics have been used in a number of studies to determine the operational reliability of sprinklers since the seminal study by Marryatt in 1988 [13]. The most recent studies are by Hall [12], based on U.S. statistics and Frank et al. based on New Zealand fire statistics [14].
A literature survey by Malm and Pettersson [15] determined that there was a wide range in sprinkler reliability (38 to 99.5%) in the available studies. A number of factors need to be taken into consideration when analyzing statistical data to determine sprinkler reliability. This includes whether the fire was confined or unconfined, whether it was large enough to activate the
sprinklers and whether the sprinkler system was in the fire area. For example, in Table 1 extracted from Reference [12], there was an estimated total of 48,460 structure fires/year in buildings with sprinklers present in the U.S. during the period of 2007 – 2011. Of these fires, 6,440 (13.2%) were unconfined but too small to activate the sprinklers and 34,000 (70%) were coded as confined fires, which were treated as fires too small to activate operating equipment. Other factors used to exclude fires from the analysis included buildings under construction and lack of sprinklers in the fire area. Based on the analysis of the statistical data, the number of qualifying fires/year was 3,020 (6.2%).
The term “effective” is subjective and open to ambiguity in the analysis of fire statistics to determine the performance effectiveness of sprinklers [15]. Hall, in his studies, has suggested that the sprinkler effectiveness should be measured relative to the design objective of the system, which is typically to confine the fire to the room of fire origin or in the case of large rooms to the sprinkler ‘design area’ [12]. The guideline on the probabilistic risk assessment for fire safety design of buildings published by the British Standards Institution [16] recommends using four activated sprinklers as the cutoff for effective sprinkler operation. Marryatt [13], in his study, used 20% destruction of the protected property as the criteria for effective sprinkler operation.
Table 1 extracted from Reference [12] shows the reliability of sprinklers (ability to respond and provide water), their efficacy (effectiveness when operated) and total effectiveness (product of reliability and efficacy) for various property uses based on U.S. fire statistics. The results indicate that sprinkler reliability varied widely depending on the occupancy, with the lowest (79%) for storage applications and the highest (94%) for residential applications. There was less variation in sprinkler efficacy with the lowest (93%) for public assembly applications and the highest (98%) for health care properties.
The two highest values for total sprinkler effectiveness were 91% for residential and 87% for store or office applications. These two categories are the areas of primary interest for mid- and tall-wood building construction.
The data provided in Table 1 is for all sprinklers. Reference [12] also provided results for wet and dry pipe sprinkler systems. A wet pipe sprinkler system has sprinklers attached to a piping system containing water so that water discharges immediately from sprinkler heads opened by heat from a fire, while a dry pipe sprinkler system has sprinklers attached to a piping system containing air or nitrogen under pressure so that sprinkler activation releases the air or nitrogen, allowing water pressure to open a valve and water to flow into the piping system and out the opened sprinklers. Table 2, which is based on data extracted from Reference [12], shows the reliability of sprinklers (ability to respond and provide water), their efficacy (effectiveness when operated) and total effectiveness (product of reliability and efficacy) for wet and dry pipe systems based on U.S. fire statistics for all structures. The dry pipe systems represent approximately 10% of the sprinkler systems. This type of system had a lower reliability (81%) than the wet pipe system (92%). The efficacy of the two types of systems was comparable and overall the dry pipe system had a lower total effectiveness (76%) than the wet pipe system (89%).
Frank et al. [14] analyzed New Zealand fire statistics for 2001 – 2010 and, based on this analysis, the reliability of sprinklers was 95%, the efficacy was 90% and the total effectiveness was 86%, with a standard deviation of uncertainty of 4.6%. The sprinkler reliability based on the New Zealand fire statistics is higher than that determined by Hall [12] and the sprinkler efficacy was lower in the New Zealand study. Overall, the total sprinkler effectiveness determined in the two studies was comparable with 86% and 87% based New Zealand and U.S. fire statistics, respectively.
Table 1. Automatic extinguishing equipment reliability and effectiveness when fire coded as non-confined and large enough to activate equipment and equipment was present in area of fire, by property use 2007-2011 U.S. structure fires, all sprinklers [12]. Property Use Number of fires per year where sprinklers were present Non-confined fires too small to activate equipment Fires coded as confined fires Number of qualifying fires per year Percent where equipment operated (A) Percent effective of those that operated (B) Percent where equipment operated effectively (A x B)
All public assembly 3,410 560 2,210 640 91% 93% 84%
Eating or drinking establishment 1,680 300 990 390 91% 91% 83% Educational property 2,020 440 1,400 180 87% 97% 84% Health care property* 3,360 670 2,350 340 86% 98% 84% All residential 29,430 2,500 23,010 3,920 94% 97% 91% Home (including apartment) 23,650 1,630 18,890 3,120 95% 97% 91% Hotel or motel 1,870 370 1,210 300 90% 97% 88% Store or office 4,230 1,090 2,040 1,100 90% 97% 87% Grocery or convenience store 880 250 430 190 90% 95% 85% Department store 470 180 170 120 87% 98% 85% Office 1,100 240 680 180 89% 97% 87% Manufacturing facility 2,530 660 760 1,110 90% 94% 84% All storage 770 150 280 340 79% 97% 76% Warehouse excluding cold storage 400 80 110 200 84% 97% 82% All structures** 48,460 6,440 34,000 3,020 91% 96% 87%
* Nursing home, hospital, clinic, doctor’s office, or other medical facility. ** Includes some properties not listed separately above.
Table 2. Automatic extinguishing equipment reliability and effectiveness when fire coded as non-confined and large enough to activate equipment and equipment was present in area of fire by sprinkler system 2007-2011 U.S. structure fires, all structures [12]. Sprinkler System Number of fires per year where sprinklers were present Non-confined fires too small to activate equipment Fires coded as confined fires Number of qualifying fires per year Percent where equipment operated (A) Percent effective of those that operated (B) Percent where equipment operated effectively (A x B)
Wet pipe sprinklers 42,520 5,680 29,690 2,150 92% 96% 89%
Dry pipe sprinklers 4,530 620 3,250 660 81% 94% 76%
All sprinklers 48,460 6,440 34,000 3,020 91% 96% 87%
6.1.2 Reasons for Failure to Operate
Reference [12] provides results for the primary reasons that the sprinkler system failed to operate. Table 3, extracted from Reference [12], provides the percentages for each reason for failure for all sprinklers by property use in 2007-2011. The results are also illustrated in Figure 1 based on the 9% of the fires in which the sprinklers failed to operate in all structures.
Nearly two-thirds (64%) of sprinkler failures occurred because the system was shut off. The other reasons for failure to operate were manual intervention defeated the equipment (17%), component was damaged (7%), lack of maintenance (6%) and equipment inappropriate for the type of fire (5%).
Only 7% of the failures were because of a failing of the equipment rather than a failing of the people who designed, selected, maintained, and operated the equipment. If these human failings could be eliminated, the overall sprinkler failure rate would drop from the estimated 9% of reported fires to 0.6% [12]. That is close to the sprinkler failure rate reported in the mid-1980s by Marryatt [13] for Australia and New Zealand, where high standards of maintenance were reportedly commonplace. The difference in maintenance standards may also account for the higher reliability in the recent New Zealand study [14].
Table 3. Reasons for failure to operate when fire was coded as not confined and large enough to activate equipment and equipment was present in area of fire, by property use based on estimated number of 2007-2011 structure fires per year [12]. Property Use System shut-off Manual intervention defeated system System component
damaged maintenanceLack of
Inappropriate system for type of fire Total fires per year
All public assembly 51% 13% 7% 13% 15% 61
Eating or drinking establishment 43% 11% 10% 21% 15% 34 All residential 59% 21% 8% 7% 4% 233 Home (including apartment) 64% 16% 9% 6% 5% 168 Store or office 62% 16% 11% 5% 6% 112 Manufacturing facility 65% 17% 7% 5% 5% 111 All structures** 64% 17% 7% 6% 5% 711
** Includes some properties not listed separately above.
(%)
0 10 20 30 40 50 60 70
System shut off before fire Manual intervention defeated system Damaged component Lack of maintenance Inappropriate system for fire
Figure 1. Reason when sprinklers fail to operate 2007-2011 (all sprinklers and all structures).
6.1.3 Reasons for Sprinkler Ineffectiveness
Reference [12] provides results for the primary reasons that the sprinkler system was ineffective when activated by a fire. Table 4, extracted from Reference [12], provides the percentages for each reason automatic sprinklers were ineffective by property use in 2007-2011. The results are also illustrated in Figure 2 based on the 4% of the fires in which the sprinklers operated in all structures but were ineffective.
Sprinkler ineffectiveness in non-confined fires was primarily because the water did not reach the fire (44%) or because not enough water was released (30%). Other reasons included damage to a system component (8%), manual intervention (7%), lack of maintenance (7%) and
inappropriate equipment for the type of fire (5%).
Insufficient (not enough) water can be released if there are problems with the system’s water supply. This reason for ineffectiveness also overlaps with other reasons:
1. Inappropriate equipment. For example, the occupancy hazard has changed requiring a higher water flow density than is provided by the now inappropriate equipment,
2. Manual intervention. The system is turned off before sufficient water has reached the fire,
3. Flash fire, fire with multiple origins and explosions.
There are a number of different ways in which water may not reach the fire. 1. Shielded fires,
2. Deep-seated fires in bulk storage,
3. Fire spread above exposed sprinklers, through unsprinklered concealed spaces, or via exterior surfaces.
4. Droplet sizes that are too small to penetrate the buoyant fire plume and reach the seat of the fire.
The discussion in Reference [12] on sprinkler effectiveness when operated was based on whether or not the system met the design objective (whether or not the fire was confined to the room of fire origin or to the design area, in the case of large rooms/un-compartmented spaces).
Table 4. Reasons for ineffectiveness when fire was coded as not confined and large enough to activate equipment and equipment was present in area of fire, by property use based on estimated number of 2007-2011 structure fires per year [12]. Property Use Water did not reach fire Not enough water released System component damaged Manual intervention defeated system Lack of maintenance Inappropriate system for type of fire Fires per year
All public assembly 69% 21% 0% 0% 5% 5% 41
Eating or drinking establishment 69% 25% 0% 0% 6% 0% 33 All residential 39% 40% 7% 3% 5% 7% 119 Home (including apartment) 40% 35% 8% 3% 6% 9% 102 Store or office 39% 32% 8% 13% 4% 4% 34 Manufacturing facility 39% 26% 9% 9% 13% 6% 62 All structures** 44% 30% 8% 7% 7% 5% 300
** Includes some properties not listed separately above.
(%)
0 10 20 30 40 50
Water did not reach fire Not enough water released Damaged component Manual intervention defeated system Lack of maintenance Inappropriate system for fire
Figure 2. Reason when sprinklers are ineffective 2007-2011 (all sprinklers and all structures).
6.2 Sprinkler Impact on Extent of Flame Damage and Loss of Life
The discussion in Reference [
12
] on sprinkler effectiveness when operated was based onwhether or not the system met the design objective (i.e., whether or not the fire was confined to
the room of fire origin or to the design area in the case of large rooms
/un-compartmented
spaces
). Therefore, the benefits of sprinklers will tend to come in the following scenarios [12
]: A fire that would otherwise have spread beyond the room of fire origin will be confined to the room of origin, resulting in a smaller fire-damaged area and less property damage. A fire that would otherwise have grown larger than the design fire area in a room larger
than that area will be confined to the design fire area, resulting in a smaller fire-damaged area and less property damage.
A fire will be confined to an area smaller than the room or the design fire area, even though that degree of success goes beyond the performance assured by the design, resulting in a smaller fire-damaged area and less property damage.
Table 5 provides direct measurement of sprinkler effect involving the first bulleted scenario above. For all structures combined, 51% have flame damage confined to room of origin when there is no automatic extinguishing equipment present. This rises to 86% of fires with flame damage confined to room of origin when any type of sprinkler is present.
The extent of fire spread for residential buildings was investigated in Reference [17] using the Province of British Columbia’s fire statistics for the period between October 2006 an October 2011. The extent of fire spread in residential properties with the fire controlled by the sprinkler system is shown in Figure 3. Figure 4 shows the extent of fire spread in residential properties without sprinkler protection.
The extent of fire spread based on the Province of British Columbia fire statistics show a similar trend to Reference [12] with 96.7% of the fires controlled by sprinklers confined to the room of fire origin compared to 62.6% in buildings without sprinkler protection for all residential
properties. The difference in the fire spread was less for apartment buildings with 95.2% of fires confined within the room of fire origin for buildings with sprinkler protection and 84.7% in
buildings without sprinklers.
Fires controlled by sprinklers were as likely to extend as far as the floor of origin in apartment buildings as fires in apartment buildings without sprinklers. However, in the apartment buildings without sprinkler protection, there was an increased likelihood of the fire spreading to the building and beyond the building.
Overall, the results indicate that, with sprinkler protection, it is less likely that a fire will spread beyond the room of fire origin with a resulting reduction in property damage. Also, with
sprinklered buildings, it is less likely that fire service personnel will be faced with a large fire situation.
A second approach to determine the impact of sprinklers is the reduction in life loss per fire. Table 6 extracted from Reference [12] shows fire death rate reductions for various property use groups. Table 7 shows fire death rate reductions for residential properties based on
For properties other than homes, deaths tend to be extremely rare, with or without sprinklers. The associated rates of deaths per thousand fires will therefore be very sensitive to individual fires with large death tolls, fatal fires with unusual circumstances, the variability associated with analysis of confined fires, and fires with fatalities or other characteristics misreported.
For 2007-2011 home fires, Reference [12] indicates the death rate per 1,000 fires was 82% lower with wet pipe sprinklers than with no automatic extinguishing equipment. Based on the Province of British Columbia fire statistics in Reference [17], the death rate per 1,000 fires was 92% lower in all residential properties with sprinkler protection.
Table 5. Extent of Flame Damage for Sprinklers Present vs. Automatic Extinguishing Equipment Absent 2007-2011 Structure Fires [12].
Percentage of fires confined to room of origin
excluding structures under construction, fires coded as confined fires, and sprinklers not in fire area Property Use With no automaticextinguishing
equipment (%)(%) With sprinklers of any type (%) Difference (in percentage points)
All public assembly 58 82 24
Variable-use amusement or recreation place 65 88 23
Religious property 54 83 30
Library or Museum 67 87 20
Eating or drinking establishment 58 79 21
Educational property 77 92 15
Health care property* 79 94 15
All residential 54 89 35
Home (including apartment) 54 88 34
Hotel or motel 74 93 19
Dormitory or barracks 76 94 18
Store or office 56 84 27
Grocery or convenience store 59 86 27
Department store 56 85 29
Office 60 88 27
Manufacturing facility 55 85 24
All storage 24 68 44
Warehouse excluding cold storage 39 71 32
All structures** 51 86 35
* Nursing home, hospital, clinic, doctor’s office, or other medical facility. ** Includes some properties not listed separately above.
Table 6. Estimated Reduction in Civilian Deaths per Thousand Fires Associated With Wet Pipe Sprinklers, by Property Use 2007-2011 Structure Fires [12].
Property Use
Without automatic extinguishing
equipment
With wet pipe sprinklers of any
type Percent reduction(%)
All public assembly 0.6 0.0 100
All residential 7.4 1.1 85
Home (including apartment) 7.4 1.3 82
Boarding or rooming house 9.6 1.5 84
Hotel or motel 7.3 0.0 100
Residential board and care home 5.7 0.7 88
Dormitory or barracks 1.1 0.0 100
Store or office 1.5 0.6 62
Manufacturing facility 2.3 0.6 88
Warehouse excluding cold storage 3.5 1.4 61
All structures 6.3 0.8 86
Table 7. Estimated Reduction in Civilian Deaths per Thousand Fires Associated With Sprinklers, by Property Use 2006-2011 Structure Fires [17].
Property Use
Without automatic extinguishing
equipment With sprinkler protection Percent reduction(%)
All residential 15.9 1.2 92
Apartment 23.1 2.1 91
Figure 3. Extent of fire spread for sprinkler protected buildings (where the method of fire control was by the sprinkler system) by property classification [17].
Figure 4. Extent of fire spread for buildings without sprinkler protection, by property classification [17].
6.3 Summary of Sprinkler Effectiveness and Impact
In the research to develop an alternative solution for mid-rise wood construction, the primary objective of the investigations was to determine the effectiveness of the encapsulation materials in protecting the combustible structural materials to delay the effects of the fire on the
combustible structural elements and, as a result, delay the contribution of the combustible structural elements to the fire severity. However, for mid-rise (5- and 6-stories) and taller
buildings, the NBC requires that the buildings be fully sprinklered in accordance with NFPA 13. In this section, the effectiveness of sprinkler systems was analyzed to establish how frequently the encapsulation system would be challenged by a fire in actual practice.
There are two primary parameters impacting the performance effectiveness of a sprinkler system in the event of a fire:
1. Sprinkler reliability. Sprinkler reliability indicates whether or not the sprinkler responds and delivers water to the fire when required. In most cases (91% in Reference [12]), the failure of the sprinkler system was due to human factors. If these factors were reduced through better maintenance and operating practices, the reliability of sprinklers could be significantly improved [12].
2. Sprinkler efficacy. Sprinkler efficacy is a measure of whether or not the sprinkler system was effective when operated. There is considerable subjectivity in assessing the efficacy of a sprinkler system including the parameter used to assess whether or not the system was “effective”. Hall [12] based his analysis on whether not the system met its design objective by confining the fire to the room fire origin or, in the case of large rooms/un-compartmented spaces, to the design area.
The product of the two parameters (sprinkler reliability and efficacy) gives the overall performance effectiveness of the sprinkler system.
The analysis in Reference [12] based on US experience for 2007-2011 and in Reference [14] based on New Zealand fire statistics for 2001 – 2010 indicate that the performance
effectiveness of sprinklers is 87% and 86%, respectively, for fires in all occupancies. It should be noted that the percentages are based on only those fires for which the sprinkler system should have operated.
The performance effectiveness of sprinklers is dependent on property use with the highest values 91% and 87% for residential and for store or office applications, respectively. These two categories are the areas of primary interest for mid- and tall-wood building construction.
The primary benefits of sprinkler systems are a reduction in the extent of fire spread resulting in reduced losses and a reduction in the loss life. The impact of sprinklers on the extent of fire spread and life loss were investigated in References [12] and [17]. Overall, the results indicate that, with sprinkler protection, it is less likely that a fire will spread beyond the room of fire origin with a resulting reduction in property damage. Also, with sprinklered buildings, it is less likely that fire service personnel will be faced with a large fire situation. Both studies also indicate a significant reduction in life loss per 1,000 fires with a 82% reduction based on the US fire experience and a 92% reduction in residential occupancies based on the Province of British Columbia fire statistics.
7 FIRE RESISTANCE TESTS OF WALL ASSEMBLIES FOR USE IN LOWER STOREYS
One of the major differences between structural lightweight wood-frame (LWF) assemblies used in mid-rise wood buildings and low-rise wood buildings (≤ 4 stories) are the loadbearing wall assemblies for the lower storeys. For mid-rise wood buildings, loadbearing wall assemblies utilized on the lower storeys have to be designed to resist higher gravity loads due to higher gravityloads from the additional upper storeys, and higher lateral loads in case of seismic events or wind loads. These wall assemblies need to meet standard fire resistance and acoustic
requirements, and therefore, information regarding their standard fire resistance and Sound Transmission Class (STC) ratings are required. The NBC currently requires the wall assemblies that separate a dwelling unit from other spaces in a building to meet a STC rating of 50 or higher for direct airborne sound insulation. Extensive acoustic experiments were conducted to determine STC ratings for 49 LWF wall assemblies with various stud sizes and configurations (staggered-stud; single-, double- or triple-stud; different stud spacing; built-up end columns; etc.) and with or without a shear membrane [8]. A number of the assemblies that met an STC rating of 50 or higher were selected for standard fire resistance testing. The fire resistance tests of the lightweight wood frame wall assemblies for use in mid-rise applications are fully
documented in a series of reports [18, 19]. A brief summary is provided below.
7.1 Wall Assemblies for Fire Resistance Tests
Standard full-scale furnace tests were conducted to determine the fire endurance period for 6 encapsulated lightweight wood frame wall assemblies. The tests were conducted in
conformance with CAN/ULC-S101 [20].
Table 8 shows the six wall assemblies with staggered-stud configurations developed and tested. The basic wood-stud framing included single or built-up (tripled) staggered studs on a single common bottom plate, with a double top plate and single end studs. For Wall Assemblies #1, 5 and 6, a shear membrane layer of 11.1 mm thick OSB wood structural panel was attached to the unexposed side of the framing (the side of the assembly facing away from the furnace). For Wall Assemblies 2 and 3, horizontal resilient metal channels were installed on the fire-exposed side of the framing (the side of the wall assembly facing into the furnace). Glass fibre insulation was installed in the wall cavities in all tests; for Wall Assemblies #5 and 6, the insulation on each cavity side was installed with its back side (side facing the centre staggered studs) partially scored so that it wrapped around the centre staggered stud. This was done to ensure that the gypsum board was not put under excessive stress. The wall assemblies were protected with a double layer of 12.7 mm thick Type X gypsum board on both sides applied with or without the shear membrane layer and with or without resilient metal channels.
The total superimposed load was applied along the width of the assembly, satisfying the full specified load conditions as per CAN/ULC-S101 [20].
Wall Assembly #4 was the same as Wall Assembly #1 but without the shear membrane layer. Wall Assembly #6 was the same as Wall Assembly #5 in the basic framing but horizontal blocking was added at the mid-height of Wall Assembly #6 to limit the deformation of the studs in the plane of the wall assembly.
In addition to the measurements required by the CAN/ULC-S101 test standard to determine the fire endurance period (FEP) for each test assembly, temperatures at the interface between the gypsum board used to protect the structural elements, on the studs and in the wall cavity were
also measured. This provides data to determine the protection (encapsulation) time for the structural elements provided by two layers of 12.7 mm thick Type X (fire-resistant) gypsum board under standard fire exposure. These results are discussed and summarized in Section 9.5 of this report.
Table 8. Fire Resistance Tests of Wall Assemblies with Staggered Studs and 2 Layers of 12.7 mm Thick Type X Gypsum Board on Both Sides of Framing
Wall Stud size Stud
spacing (mm o.c.) Size of top plate,* bottom plate, end studs Glass fibre thickness (mm) OSB shear membrane layer (11.1 mm thick) Resilient metal channels (600 mm o.c) Applied load (kN) Fire endurance period (FEP) (min) # 1 38 mm x 89 mm 400 38 mm x 140 mm 90 unexposed side† - 170 92 # 2 38 mm x 89 mmTri 400 38 mm x 140 mm 90 - exposed side‡only 456 90 # 3 38 mm x 89 mm 100 38 mm x 140 mm 90 - exposed side‡only 624 75 # 4 38 mm x 89 mm 400 38 mm x 140 mm 90 - - 170 87 # 5 38 mm x 140 mm 400 38 mm x 190 mm 140 unexposed side† - 506 81 # 6§ 38 mm x 140 mm 400 38 mm x 190 mm 140 unexposed side† - 506 98
* A double top plate was used.
Tri– built-up tripled studs
†“unexposed side” refers to the side of the assembly facing away from the furnace. ‡“exposed side” refers to the side of the wall assembly facing into the furnace.
§Assembly #6 with horizontal blocking (38 mm x 89 mm) at mid-height to limit deformation of the studs in the plane
7.2 Results and Summary of Fire Resistance Tests
Table 8 shows the results of the full-scale standard furnace tests for the six light-weight wood-frame wall assemblies with staggered studs protected by two layers of 12.7 mm thick Type X (fire-resistant) gypsum board. The fire endurance period of each of the assemblies provided in the table is assigned based on the time at which the test assembly failed to sustain the applied load. All of the assemblies failed structurally prior to either the temperatures on the unexposed side of the assembly exceeding the temperature criteria due to transmission of heat through the test assembly or any passage of flame or hot gases to the unexposed side, as defined in CAN/ULC-S101. The wall assemblies provided fire endurance periods of 75 min or higher. Three wall assemblies (#1, #2 and #6) had fire endurance periods of 90 min or longer.
Wall Assembly #2, with tripled built-up studs, and Wall Assembly #3 with 100 mm stud spacing investigated two different methods of increasing the loadbearing capacity of a wall assembly. The close stud spacing assembly (#3) had a higher loadbearing capacity but a lower fire endurance period.
Wall Assembly #4 was essentially the same as Wall Assembly #1 but without the shear membrane layer. Results from the tests of these two assemblies show that the OSB shear membrane layer contributed extra 4-5 min to the fire endurance period.
The structural failure of Wall Assembly #5 occurred at 81 min. After the test, it was observed that many of the studs, particularly those on the exposed side of the assembly, buckled within the plane of the wall rather than perpendicular to the wall plane. For Wall Assembly #6, the assembly was modified by adding horizontal blocking at the mid-height. With the blocking, the deformation of the studs within the plane of the wall assembly (the weak-axis buckling) was limited and structural failure occurred at 98 min with the studs deforming perpendicular to the plane of the wall resulting in a 17 min increase in the fire endurance period. The results suggest that limiting the lateral deflection of the studs in the plane of the wall (in-plane buckling) could be an important factor in improving the fire performance of staggered stud wall assemblies with high imposed loads.
The deflection of the test assemblies were measured using nine deflection gauges attached to each test assembly. The average deflection of the test assemblies is shown in Figure 5. Initially, there was a small positive deflection (into the furnace) of the test assemblies. After
approximately 55 min, the wall assemblies began to deflect away from the furnace. This time corresponds to the time at which the temperatures at the interface (space) between the studs and the back side of the base layer of gypsum board on the exposed (fire) side of the test assembly exceeded 300°C and the studs began to char. This is discussed further in Section 9.5. The average deflection was small (< -10 mm) until the last 3 – 8 min of the test except for Assembly #4, for which the wall deflection exceeded -10 mm at 14 min before structural failure. Assembly #4 was the same as Assembly #1 except an OSB shear membrane was attached to the studs on the unexposed side of Assembly #1. The results indicate that the OSB shear membrane on the unexposed side of the assembly decreased the initial rate at which the wall assembly deflects. Subsequently, there was a rapid deflection at the end of the tests. This observation is consistent with the average deflections for Assemblies #5 and #6, which also included an OSB shear membrane on the unexposed side of the assembly.
Time (min)
0 10 20 30 40 50 60 70 80 90 100D
e
fle
ct
io
n
(
m
m
)
-120 -110 -100 -90 -80 -70 -60 -50 -40 -30 -20 -10 0 10 Test 1 Test 2 Test 3 Test 4 Test 5 Test 6Figure 5. Average deflections.
8 WOOD-BASED EXTERIOR WALLS FOR LIMITING FIRE SPREAD
In Article 3.1.5.5, the NBC [5] allows the use of combustible components for non-loadbearing exterior walls to be used in a building required to be of noncombustible construction provided:
a) the building is
i. not more than 3 storeys in height, or
ii. sprinklered throughout,
b) the interior surfaces of the wall assembly are protected by a thermal barrier conforming to Sentence 3.1.5.12.(3), and
c) the wall assembly satisfies the criteria of Sentence 3.1.5.5.(3) and 3.1.5.5.(4) when subjected to testing in conformance with CAN/ULC-S134 Fire Test of Exterior Wall
Assemblies [21].
Lightweight wood-frame assemblies were developed in the 1990’s during the development of the CAN/ULC-S134 test method that met the criteria in the NBC for nonloadbearing exterior walls [22]. However, proprietary alternative solutions based on these tests would be limited to the materials used in the original tests, such as the glass-fibre and phenolic foam insulation. One of the tasks in this current project was to develop further information and data for use in developing generic exterior wall systems for use in mid-rise wood buildings. A series of
CAN/ULC-S134 standard fire tests were conducted for exterior wall systems constructed with lightweight wood-frame (LWF) and cross-laminated timber (CLT) structural assemblies.
Test results show that a wider range of generic exterior wall systems constructed with LWF and CLT can be built to meet the requirements of limiting fire spread on the exterior surface, based on the criteria stipulated in Sentences 3.1.5.5.(3) and 3.1.5.5.(4) in Division B of the 2010 NBC. The details of the tests are described in several reports [23, 24, 25, 26, 27].
8.1 Test Facility and Exterior Wall Assemblies
The tests were conducted in accordance with CAN/ULC-S134 [21] in the NRC large scale fire laboratory. Figure 6 shows the exterior wall fire test facility.
The generic exterior wall systems that were investigated included:
1) A LWF wall with spray-applied medium density polyurethane foam insulation filling the stud cavities protected by 12.7 mm thick regular gypsum sheathing;
2) A LWF wall with spray-applied medium density polyurethane foam insulation filling the stud cavities protected by 15.9 mm thick interior fire-retardant-treated (FRT) plywood sheathing;
3) A simulated CLT wall with an outboard nonloadbearing LWF wall 38 mm x 140 mm studs and rigid polystyrene foam insulation filling the stud cavities protected by 12.7 mm thick regular gypsum sheathing; and,
4) A simulated CLT wall with an outboard nonloadbearing LWF wall 38 mm x 140 mm studs and rigid polystyrene foam insulation filling the stud cavities protected by 15.9 mm thick interior FRT plywood sheathing.
5) A rain screen test assembly included OSB sheathing (15.9 mm thick) with a 12.7 mm gap between the sheathing and a single layer of generic fibre-cement board, which was used to simulate the exterior cladding (6 mm thick) and was attached with vertical plywood strips used as strapping.
Cone calorimeter tests [28] were conducted to help select the sheathing and foamed plastic insulation materials for use in the construction of the full-scale exterior wall assemblies [29]. The materials that gave the highest heat output were selected for use in the exterior test assemblies. Each wall assembly was three-storey high (5.0 m width and 9.9 m height) with simulated floors between storeys. The base storey wall section included an opening (2.5 m wide and 1.45 m high) to the burn room of the test facility. The wall assembly extended 7.0 m above the opening. 8.1.1 Lightweight Wood-Frame (LWF) Assemblies and Insulation
The two LWF wall assemblies simulated platform construction. Wall sections for each storey were constructed using 38 mm x 140 mm x 2286 mm long wood studs spaced at 400 mm on center (o.c.) with a double top plate and single bottom plate. The height of the wall sections for each storey was 2.4 m. Floor sections framed within the test specimen were simulated using a 38 mm x 286 mm rim board with short pieces of 286 mm wood I-joists spaced 400 mm o.c. and 15.9 mm thick plywood subfloor.
A spray-applied medium-density polyurethane foam (SPF) was applied on site to fill the 140 mm depth of the stud wall cavities. The medium density SPF insulation was selected based on cone calorimeter tests that showed that it had a higher potential heat output than a light density SPF
[29].
Although medium density SPF insulation was used in the test assembly, it was assumed that, if the assembly using the medium density SPF insulation met the requirements in 3.1.5.5. of the 2010 NBC for exterior wall systems, exterior wall assemblies insulated using light density SPF insulation or non-combustible mineral fibre insulation would also meet the requirements. 8.1.2 Cross-Laminated Timber (CLT) Assemblies and Insulation
The two CLT wall assemblies were simulated using 38 mm x 235 mm lumber laid flat and attached horizontally to the test facility. CLT wall systems can be much thicker than the simulated system. However, a thickness of 38 mm was considered adequate for this testing because if, during the test, there was sufficient burning of the lumber to char through the 38 mm thickness, it is very likely that the wall system would not meet the requirements in 3.1.5.5. of the 2010 NBC anyway, and therefore any additional thickness of wood would be redundant.
A water resistant barrier (WRB) was attached to the exterior surface of the simulated CLT wall. This material was paper impregnated with asphalt and selected for use in the full-scale exterior wall assembly tests based on the results of cone calorimeter tests, which indicated that it ignited earlier and had a higher peak heat release rate and total heat output than a thermoplastic polyolefin (TPO) WRB.
Insulated wall sections were attached to the simulated CLT wall. The wall sections were constructed using 38 mm x 140 mm x 2400 mm long wood studs spaced at 600 mm on center (o.c.). The wall sections included a single base plate and a single top plate constructed using 38 mm x 140 mm x 2400 mm lumber.
Rigid polystyrene foam insulation was used to fill the stud cavities in the lightweight wood frame attached to the simulated CLT wall. The foam insulation was extruded polystyrene (XPS) with a thickness of 140 mm. The XPS foam insulation used in the test assemblies was selected based on cone calorimeter tests that showed that XPS rigid foam insulation had higher heat output
than expanded polystyrene (EPS) rigid foam insulation
[29].
Of the three different XPS rigidfoam insulation products tested, the product with the highest heat output was used in the CLT assemblies.
Although an XPS foam insulation was used in the test assembly, it was assumed that, if the assembly using an XPS foam insulation met the requirements in 3.1.5.5. of the 2010 NBC for exterior wall systems, exterior wall assemblies insulated using EPS rigid foam insulation panels or non-combustible mineral fibre insulation would also meet the requirements.
8.1.3 Sheathing and Cladding
Regular gypsum sheathing (12.7 mm x 1.2 m x 2.4 m panels) was used as the exterior surface of two wall assemblies (one LWF and the other CLT). The gypsum sheathing complied with
![Table 6. Estimated Reduction in Civilian Deaths per Thousand Fires Associated With Wet Pipe Sprinklers, by Property Use 2007-2011 Structure Fires [12].](https://thumb-eu.123doks.com/thumbv2/123doknet/14096627.465162/24.918.89.832.211.603/estimated-reduction-civilian-thousand-associated-sprinklers-property-structure.webp)
![Figure 4. Extent of fire spread for buildings without sprinkler protection, by property classification [17].](https://thumb-eu.123doks.com/thumbv2/123doknet/14096627.465162/25.918.128.807.614.885/figure-extent-spread-buildings-sprinkler-protection-property-classification.webp)