Publisher’s version / Version de l'éditeur:
Journal of Building Performance Simulation, 4, 3, pp. 205-226, 2011-01-31
READ THESE TERMS AND CONDITIONS CAREFULLY BEFORE USING THIS WEBSITE.
https://nrc-publications.canada.ca/eng/copyright
Vous avez des questions? Nous pouvons vous aider. Pour communiquer directement avec un auteur, consultez la
première page de la revue dans laquelle son article a été publié afin de trouver ses coordonnées. Si vous n’arrivez pas à les repérer, communiquez avec nous à [email protected].
Questions? Contact the NRC Publications Archive team at
[email protected]. If you wish to email the authors directly, please see the first page of the publication for their contact information.
NRC Publications Archive
Archives des publications du CNRC
This publication could be one of several versions: author’s original, accepted manuscript or the publisher’s version. / La version de cette publication peut être l’une des suivantes : la version prépublication de l’auteur, la version acceptée du manuscrit ou la version de l’éditeur.
For the publisher’s version, please access the DOI link below./ Pour consulter la version de l’éditeur, utilisez le lien DOI ci-dessous.
https://doi.org/10.1080/19401493.2010.524710
Access and use of this website and the material on it are subject to the Terms and Conditions set forth at
The Central Sunlighting System: development and validation of an optical prediction model
Laouadi, A.
https://publications-cnrc.canada.ca/fra/droits
L’accès à ce site Web et l’utilisation de son contenu sont assujettis aux conditions présentées dans le site
LISEZ CES CONDITIONS ATTENTIVEMENT AVANT D’UTILISER CE SITE WEB.
NRC Publications Record / Notice d'Archives des publications de CNRC: https://nrc-publications.canada.ca/eng/view/object/?id=d054dda7-3de2-4c7e-a8ca-d2356f22af1c https://publications-cnrc.canada.ca/fra/voir/objet/?id=d054dda7-3de2-4c7e-a8ca-d2356f22af1c
T he Ce nt ra l Sunlight ing Syst e m : deve lopm e nt
a nd va lidat ion of a n opt ic a l pre dic t ion m ode l
N R C C - 5 3 6 1 7
L a o u a d i , A .
2 0 1 1 - 0 1 - 3 1
A version of this document is published in / Une version de ce document se trouve dans:
Journal of Building Performance Simulation, 4, (3), pp. 205-226, January 31, 2011 http://dx.doi.org/10.1080/19401493.2010.524710
http://www.nrc-cnrc.gc.ca/irc
The material in this document is covered by the provisions of the Copyright Act, by Canadian laws, policies, regulations and international agreements. Such provisions serve to identify the information source and, in specific instances, to prohibit reproduction of materials without written permission. For more information visit http://laws.justice.gc.ca/en/showtdm/cs/C-42
Les renseignements dans ce document sont protégés par la Loi sur le droit d'auteur, par les lois, les politiques et les règlements du Canada et des accords internationaux. Ces dispositions permettent d'identifier la source de l'information et, dans certains cas, d'interdire la copie de documents sans permission écrite. Pour obtenir de plus amples renseignements : http://lois.justice.gc.ca/fr/showtdm/cs/C-42
THE CENTRAL SUNLIGHTING SYSTEM:DEVELOPMENT AND VALIDATION OF AN OPTICAL
PREDICTION MODEL A. Laouadi
Institute for Research in Construction - National Research Council of Canada, 1200 Montreal Road, Ottawa K1A 0R6, Canada
ABSTRACT
This paper presents the development of a sufficiently accurate and reliable optical model to predict the lighting and thermal performance of the Central Sunlighting System (CSS). The model is based on the ray tracing technique to compute the amount of sunlight flux transmission through the light guide to interior spaces of buildings, and absorption of solar radiation within the components of the CSS, which may become solar heat gains indoors. The model is validated using a detailed ray tracing technique and field measurements carried out on a previous prototype. The validation results show that the model predictions are in good agreement with the ray tracing and measurement results. The model can be integrated in existing
fenestration design tools, or in whole-building energy simulation software, with significantly lower calculation time compared to the full integration of suitable lighting simulation software.
INTRODUCTION
Daylighting is an important design aspect of sustainable buildings to reduce lighting energy use. In office buildings, artificial lighting makes up about 22% of the total electricity use (NRCan, 2010). Windows and skylights have been used in almost all types of buildings to reduce lighting energy use at the perimeter and under roof spaces. There are, however, very limited daylighting systems to illuminate the core spaces of buildings. The Central Sunlighting System (formally called the Solar
Canopy System) is the first successful and cost-effective daylighting system to collect and distribute sunbeam light to core building interiors. The Central Sunlighting
System (CSS) has gone through extensive design optimisation and testing, and is currently nearing the commercialisation stage. Developing a reliable model to predict its energy performance is, therefore, crucial to assist building designers and
engineers to specify or custom-design energy efficient systems for building integration, and speed up the market uptake of this technology.
Core daylighting systems employ various technologies to collect, concentrate, transport, and distribute daylight (sky and sunbeam light) from the building’s exterior envelope to target areas in interior spaces of buildings. They are categorized into two types: vertical and horizontal systems. Vertical systems collect daylight at the roof level using static or tracking optical components (such as parabolic mirrors or heliostats) and transport the daylight in vertical hollow light guides passing through building floors. Several installations were constructed over the world (Aizenberg, 2010; Kim and Kim, 2010; Rosemann and Kaase, 2005), but the costs of these systems are prohibitively high, which limited their market penetration. Horizontal systems, on the other hand, are mounted on the vertical walls of building floors, and employ horizontal hollow light guides. Several studies and demonstrations of this type of systems were carried out, and showed that sufficient illuminance may be achieved indoors (Callow and Shao, 2003, Greenup and Edmonds, 2004, Schlegel et al., 2004, Tsangrassoulis et al., 2005; Kwok and Chung, 2008; Hien and
Chirarattananon, 2009). Capital costs of horizontal systems are also relatively high compared to their energy savings (Rosemann et al., 2007). The only successful and cost-effective system with promising energy savings was the CSS (Rosemann et al., 2008a). This new system was designed to integrate daylighting with electrical lighting in one system to save energy. It is claimed that the potential energy savings of the
system can pay for the additional installation capital costs over an acceptable period of time (Rosemann et al., 2007).
Researchers at the University of British Columbia (UBC), Canada, employed various methods to design and optimize the performance of the CSS. Commercial software, employing a detailed ray tracing technique, was used to design the optical
components of the system for the efficient collection and concentration of sunbeam light on typical days of each month of the year (Rosemann et al. 2008a). A prototype was then built and tested in a portable mock-up facility at UBC. The facility was designed to mimic a typical open plan office space, with one row of cubicles served by a perimeter window on the south-facing wall and the CSS. The demonstration prototype was mounted above the window. Illuminance measurements were taken at several points on the work plane under sunny and cloudy sky conditions on various days of the year. The performance of the system was evaluated with the absence or presence of the window daylight contribution. When the daylight contribution from the CSS was absent, the measurement results showed that the average illuminance at the work plane fell below the recommended illuminance for office spaces (500 lx) at a distance roughly 3 m from the window. When the window was obstructed so that the CSS became the sole source of daylighting, the results showed that the average illuminance on the work plane was greater than 700 lx on typical sunny days
(Whitehead et al., 2007).
The previous field measurement was used to help optimise the operation and the performance of the system, and lead to a fabrication of a second prototype. At present, the new prototype is being demonstrated in the field at the British Columbia Institute of Technology (BCIT) in Barnaby, BC (Whitehead, 2009). Five CSS were built and installed at the south wall of an existing open plan office building. The lighting energy use and indoor illuminance were monitored during the measurement period. The preliminary results showed that the CSS was capable of reducing the lighting energy use by more than 25%.
Researchers at UBC have used the previous field studies to develop simple design tools to help practitioners design efficient CSS for a particular application (Whitehead, 2009). These simple design tools are, however, limited to the specific system sizes measured in the study, and for British Columbia’s climate.
The aim of this paper is to develop a sufficiently accurate and reliable optical model to compute the lighting and thermal performance of the CSS to assist lighting designers and engineers to integrate energy-efficient systems into commercial buildings.
OBJECTIVES
The specific objectives of this paper are:
• To develop an optical model to predict the daylighting and thermal performance of the CSS;
• To devise new performance metrics for the CSS;
• To validate the developed model using detailed computer simulation and field measurement.
DESCRIPTION OF THE CSS
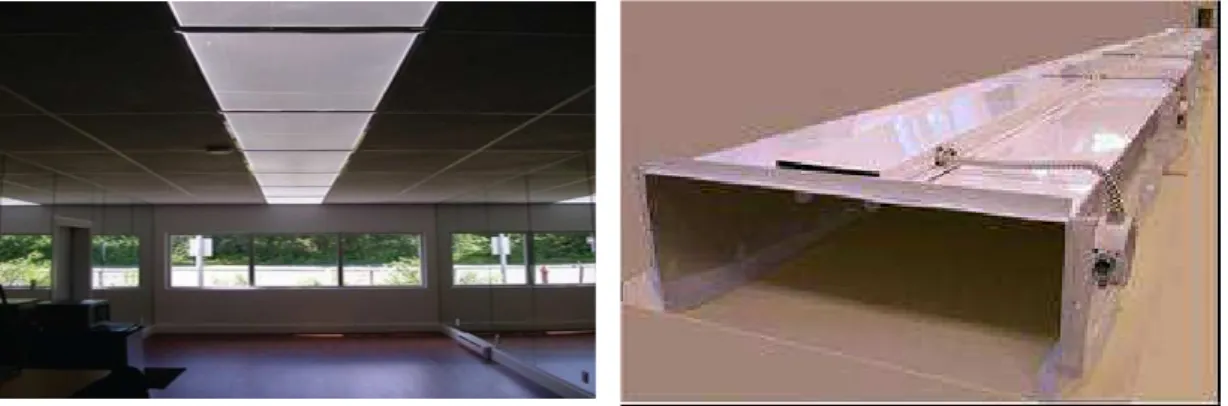
The CSS consists of three principal components: (1) an exterior canopy box, which houses the necessary optical components to collect, re-direct and concentrate
incident sunlight; (2) a light guide system to transport the collected sunlight deep into building interiors and distribute it to individual space areas requiring illumination; and (3) an electrical lighting system to complement sunlight for indoor illumination. Figures 1 and 2 show the canopy box and the light guide.
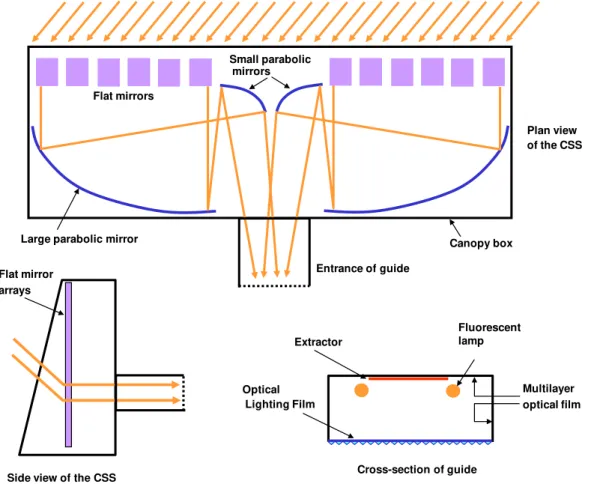
The canopy box is a sealed unit with a transparent front cover and opaque walls. It is composed of three sections: a left, right and middle section. The right and left
sections house an array of flat mirrors that track the sun’s path and a large redirecting parabolic mirror. The two mirror arrays are controlled using a time clock-based
controller, which actuates an electric motor that drives the mirror arrays to track the sun movement in the sky. The vertical spacing between the mirrors is set such that the self-shading effect of mirrors is minimized for most mirror positions. The sunlight beam incident on the mirror arrays is redirected horizontally to the large parabolic mirrors. The latter redirect and concentrate the collected sunlight onto two small parabolic mirrors located in the middle section of the canopy. The small parabolic mirrors redirect the concentrated sunlight onto the entrance port of the light guide through a cone whose center is aligned with the guide’s center and its half angle is optimized to transport light deep into the guide far end. For optimum operation, the cone half angle should not exceed the acceptance angle of the light guide, which is
direction of previous CSS prototypes was estimated to be 20° (Mossman, 2009). Figure 3 shows a schematic description of the CSS and its components.
The light guide system is a hollow rectangular tube, whose front surface is fitted with a double anti-reflective glass window, and its end surface is fitted with an opaque mirror. The top, side and end inner surfaces of the guide are fitted with a highly reflective (visible reflectance > 98%) multi-layer optical film. The bottom surface is fitted with a prismatic polycarbonate thin film commercially known as Optical Lighting Film (OLF). The OLF (3M, 2000a) reflects light by total internal reflection if the incident rays are within its acceptance angle, which is a function of the index of refraction of the polycarbonate material. Any rays incident onto the OLF out of the acceptance cone will be partially transmitted through the film to the indoor space. The top inner surface of the guide includes a light extraction layer with variable width to control the amount of the transmitted lighting flux along the guide length. The extractor is made up of a thin diffuse film with a visible reflectance of 94% (3M, 2000b) to scatter incident light so that it can be transmitted through OLF.
The electrical system component includes tubular fluorescent electric lamps (usually T5), mounted at the top inner surface of the guide along its length. The lamps are driven by dimmable electronic ballasts and can be independently and automatically controlled based on the outdoor availability of sunlight. The lamps are controlled to complement sunlight to maintain a given illuminance level on the work plan.
MODEL DEVELOPMENT
The daylighting and thermal performance of the CSS, such as, the lumen output (for indoor illumination), luminance (for glare control) and solar heat gains (for passive cooling/heating control), are important requirements to design and specify the CSS in buildings. These performances depend not only on the geometry and optical
characteristics of the components making up the CSS, but also on the building orientation, and outdoor sunlight availability. This section presents the details of an optical model to compute the daylighting and thermal performance metrics of the CSS, such as, the overall light transmittance, lumen output along the guide length, luminance, absorptances of each component of the CSS, and indoor solar heat gains. Given the complex geometry of the CSS, the following assumptions were used:
ASSUMPTIONS
• The reflection surfaces of the flat and parabolic mirrors, and the dielectric multi-layer and lighting optical films are specular. As a result, inter-reflections of rays inside the guide follow the specular reflection direction. This
assumption is regarded as an approximation, particularly to the narrow scattering behaviour of the lighting optical film.
• Concentrated rays reaching the guide’s entrance are assumed emanating from a conical point source. The cone’s apex coincides with the guide center, and its distance from the guide’s entrance is calculated based on the cone vertical (along the z-axis) half angle. The latter is a given input. The cone horizontal (along the y-axis) half angle is, however, calculated based on the assumption that the concentrated rays fully illuminate the guide’s entrance surface. • The large parabolic mirrors are fully optically-aligned with the small parabolic
mirrors, and the latter are fully optically-aligned with the guide’s entrance. Radiation flux losses due to the optical misalignment of the CSS’s
components, which might occur in real installations, are, therefore, not accounted for.
• The extractor film and the electric lamps act as an ideal light diffuser. The following calculations are performed for sunbeam light (visible spectrum for illumination), but the developed relationships are also valid for the complete solar spectrum (visible and infrared spectrum for solar heat gains). Therefore, the radiation flux units (lumens or Watts) can be mutually exchanged.
TRANSMISSION OF SUNBEAM LIGHT THROUGH THE CSS
Consider a CSS as depicted in Figure 3. The flux of sunbeam light incident on the canopy front cover surface is expressed as follows:
c n c i c A E Q , = ⋅ cosθ (1) Where:
Ac : surface area of the canopy front cover used to collect sunbeam light for indoor illumination (m2);
En : normal illuminance of sunbeam light (lx);
θc : incidence angle of sunbeam light on the canopy front cover (radians). Since the canopy front cover is not fully used to collect sunbeam light for indoor illumination, the collection surface area (Ac) is set equal to the total surface area of the flat mirror arrays projected on a vertical plane:
m m
c m W S
A = ⋅ ⋅ (2)
Where:
m : total number of the flat mirrors;
Sm : spacing between the centres of the flat mirrors (m); Wm : width (along the y-axis) of a flat mirror (m).
The incidence angle in equation (1) is expressed as follows (Duffie and Beckman, 1991):
(
s c)
z c θ φ φ θ =sin ⋅cos − cos (3) where:φc : azimuth angle of the CSS from the south direction (radians); φs : sun azimuth angle from the south direction (radians);
θz : sun zenith angle from the vertical (radians).
The incident sunbeam light flux on the canopy front cover (Qc,i) will be directly transmitted through the cover to reach the flat mirror arrays. Since the mirrors constantly track the sun’s movement in the sky to redirect the incident rays along a given direction, some incident rays may happen to be lost between the mirror arrays, and, therefore, would not reach the guide’s entrance. Furthermore, a fraction of the transmitted flux will not be redirected to the guide’s entrance due to the presence of non-reflecting surfaces in the mirror arrays such as joint holes in the upper and lower mirror rows to articulate and tilt the mirrors. The flux incident on the mirror surfaces is, then, expressed as follows:
i c c c i m FL AF Q Q , = ⋅ ⋅τ (θ )⋅ , (4) where:
AF : surface area factor that accounts for any mirror surface portion (e.g., joint holes) not used to collect and redirect incident sunbeam light;
Qm,i : flux of sunbeam light incident on the flat mirror arrays (lumens); τc(θ ) : transmittance of the canopy front cover at an incidence angle c θ . c
The surface area factor (AF) for the current CSS with 7 rows x 12 columns of mirrors is roughly equal to 0.96. This value is based on the fact that the fraction of the joint and articulation holes in the upper and lower mirror rows is 13% per mirror.
Details on the calculation of the flux loss factor (FL) are given in Appendix A. Upon multiple reflections by the flat and the large and small parabolic mirrors, the sunbeam light flux reaching the guide’s entrance is given by:
( )
m lm sm mi m i g FLS Q Q , = ⋅ρ θ ⋅ρ ⋅ρ ⋅ , (5) where:FLS : flux loss factor due to self shading of mirrors, resulting in incident rays not properly redirected to reach the guide’s entrance;
Qg,i : sunbeam light flux reaching the guide’s entrance (lumens); θm : incidence angle of sunbeam light on the mirror arrays (radians); ρm(θm) : reflectance of the flat mirrors at the incidence angle (θm);
ρlm : average reflectance of the large parabolic mirrors; ρsm : average reflectance of the small parabolic mirrors.
The flux loss factor due to the self shading of mirrors (FLS) is defined as the ratio of the useful flux redirected by the mirror arrays to reach the guide’s entrance to the flux incident on the mirror arrays. Details on the calculation of the FLS are given in
Appendix A.
Using relationships of the spherical trigonometry between the incidence and
reflection directions of rays, the incidence angle (θm) for mirrors mounted on a vertical plane may be expressed as follows:
(
2θm)
=sinθzcos(
φs −φr)
cos (6)
where φr is the azimuth angle of the reflected rays direction.
The position of the mirror arrays varies with the sun position in the sky. Knowing that the mirrors are controlled in such a way that the reflected rays are horizontal and parallel to the guide’s axis, the azimuth angle of the reflected rays is given by:
) ( sign φ ⋅ π − φ = φ
Where sign() in equation (7) indicates the plus or minus sign of the value between the parentheses.
Substituting equation (7) into equation (6), one obtains the following relationship:
(
)
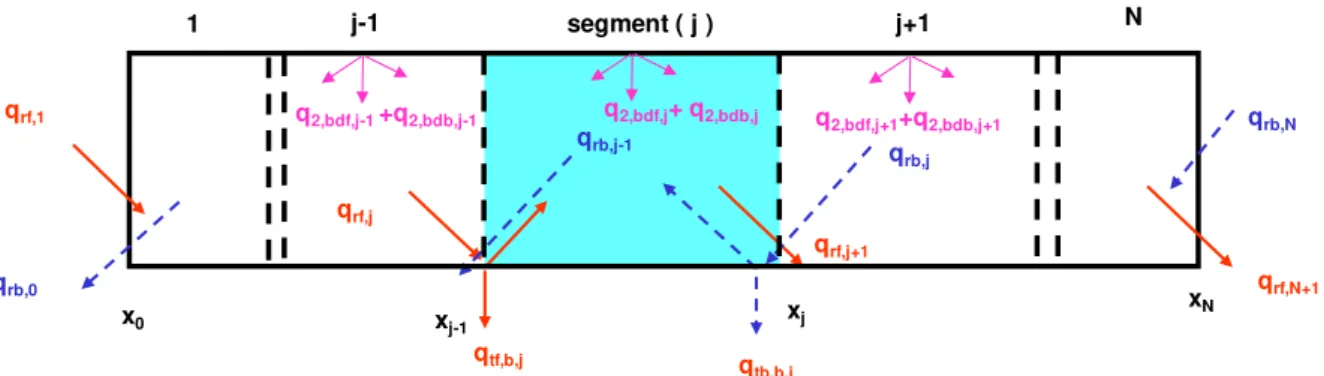
2 cos sin 1 cos z s c m φ − φ θ − = θ (8)The incident rays on the guide’s entrance will undergo multiple forward and backward reflections along the guide’s length. Given the angular-selective property of the ceiling diffuser (OLF) and the diffuse property of the extractor (and electric lamps), the transmitted flux to the indoor space through the ceiling diffuser and the absorbed fluxes by the guide’s inner surfaces will vary along the guide’s length. To account for such effects, the guide is divided into a number of sections (modules). Each section is composed of three surfaces: bottom (#1), top (#2) and side (#3) surfaces. The section surfaces receive both the inter-reflected sunbeam light and the diffuse light from the guide’s inner surfaces and lighting lamps. Figure 4 shows a schematic description of the sections making up the guide (denoted by the index i).
The light output (transmitted flux indoors) at a given guide section (i) of length (∆x) positioned at a center distance (x) from the guide’s entrance is composed of two ( beam and diffuse) components, and is expressed as follows:
( )
x QTS( )
x QTSx
QTS( )= b + d (9)
where:
QTS : sunbeam flux transmitted through a guide section situated at a distance x from the guide’s entrance (lumens);
QTSb : beam component of the sunbeam transmitted flux due to the inter-reflected beam rays (lumens);
QTSd : diffuse component of the sunbeam transmitted flux due to the inter-reflected diffuse rays (lumens).
The total lighting output of the CSS to the indoor space is thus the summation of the transmitted fluxes through all the guide sections:
( )
∑
= = k i i x QTS QT 1 (10)The absorbed solar radiation (visible and infra spectrum) within the CSS components is important for the evaluation of the thermal performance (such as the solar heat gains and surface temperatures) of the CSS. The absorbed radiation fluxes within each layer of the CSS are expressed as follows:
i c c c c Q QA = α (θ )⋅ , (11)
( )
[
m m]
mi m Q QA = 1−ρ θ ⋅ , (12)( )
m[
lm]
mi m lm FLS Q QA = ⋅ρ θ ⋅ 1−ρ ⋅ , (13)( )
m lm[
sm]
mi m sm FLS Q QA = ⋅ρ θ ⋅ρ ⋅ 1−ρ ⋅ , (14) gb g g g gf g QA Q Q Q Q QA = + 1+ 2+ 3+ (15) where:QAc : radiation flux absorbed by the front surface of the canopy cover (Watts); QAm : radiation flux absorbed by the flat mirror arrays (Watts);
QAlm : radiation flux absorbed by the large parabolic mirrors (Watts); QAsm : radiation flux absorbed by the small parabolic mirrors (Watts);
QAg : radiation flux absorbed by the guide, including its front and back ends (Watts);
QAgf : radiation flux absorbed by the front surface of the guide (Watts); QAgb : radiation flux absorbed by the back surface of the guide (Watts); QAg1 : radiation flux absorbed by the bottom surface of the guide (Watts); QAg2 : radiation flux absorbed by the top surface of the guide (Watts); QAg3 : radiation flux absorbed by the side surfaces of the guide (Watts).
Similar to equation (9), the radiation fluxes absorbed at the guide’s inner surfaces (equation 15) are decomposed into two components corresponding to the beam and diffuse inter-reflected rays:
d surf b surf surf QA QA QA = , + , (16) where:
QAsurf,b : radiation flux absorbed at a guide’s inner surface (surf) due to beam inter-reflected rays (Watts);
QAsurf,d : radiation flux absorbed at a guide’s inner surface (surf) due to diffuse inter-reflected rays (Watts);
To evaluate the transmitted and absorbed radiation fluxes, the inter-reflections of sunbeam radiation have to be traced within the guide. The following section presents a detailed methodology to compute these quantities.
TRANSMISSION OF SUNBEAM LIGHT THROUGH THE GUIDE
A ray-tracing based method is used to evaluate the inter-reflections within the guide geometry. The guide surfaces are assumed specular, except for the top surface containing the extractor, which is a mixture of reflectance types: beam-beam component (ρ2,bb) that follows the specular direction and beam-diffuse component (ρ2,bd) that follows an ideal diffuser. These reflectance components as well as the surface average absorptance are a function of the surface area proportion of the extractor. For a given guide section of index (i), the reflectance components are expressed as follows:
(
i)
bdi e i i bb =ρ ⋅ −EAR ρ =ρ ⋅EAR ρ2, , 2 1 ; 2, , (17)(
) (
i) (
e)
i i = −ρ ⋅ −EAR + −ρ ⋅EAR α2, 1 2 1 1 (18) where:EARi : ratio of the surface area of the extractor to the area of the top guide surface at the ith guide section;
α2,i : average absorptance of the top surface of the ith guide section; ρe : diffuse reflectance of the extractor surface;
ρ2 : specular reflectance of the top guide surface without the extractor;
ρ2,bb,i : beam-beam reflectance component of the top surface of the ith guide section; ρ2,bd,i : beam-diffuse reflectance component of the top surface of the ith guide
section.
Transmission and absorption of beam rays
Consider a beam of rays emanating from a point source, and incident at directional angles (θ, ϕ) on a unit surface area of the guide’s entrance at a point with coordinates P(x=0,y, z) as shown in Figure 4. The incident rays will undergo multiple reflections
from the inner surfaces of the guide until they reach the back end mirror of the guide where they will be reflected back to reach the guide’s entrance. And so on for
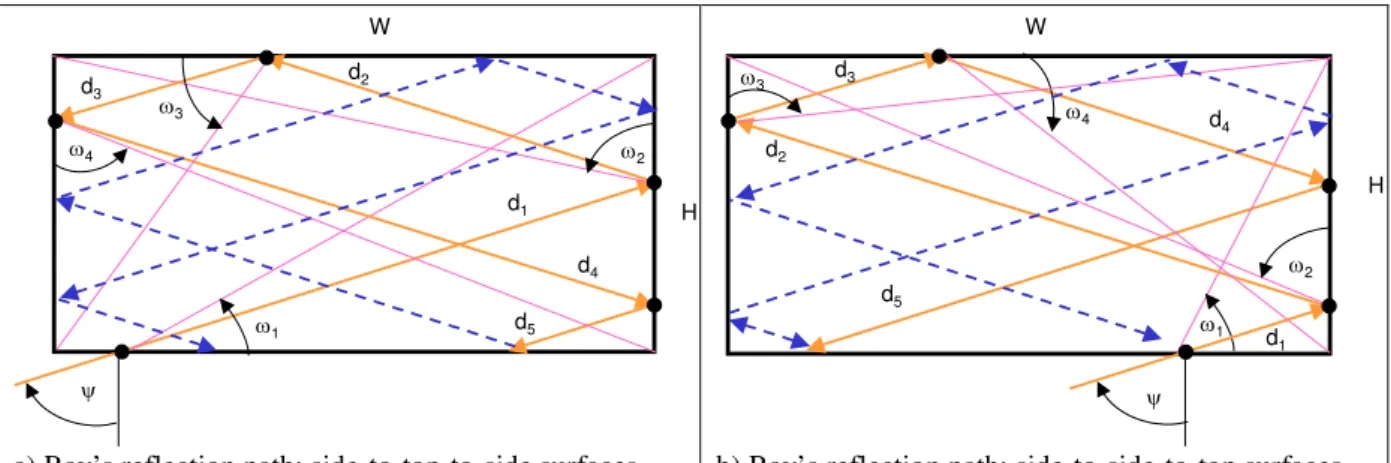
subsequent reflections. Given the fact that the guide’s entrance is highly transparent, most of the energy of the backward reflected rays will enter the canopy box space and absorbed by its surfaces, and those rays reflected back to the guide space will carry less energy. To illustrate the application of the method, let us consider that the incident rays first hit the bottom surface (#1) of the guide, and then undergo repetitive inter-reflections from the other inner surfaces. The guide is, therefore, divided into a number of segments (N) with a length smaller than or equal to the period of the repetitive inter-reflections. These segments may be larger or smaller than the guide sections as described in Figure 4. The transmitted flux of beam rays out of the guide at a given guide section of position (x) is, therefore, the summation of the transmitted fluxes through the bottom surface of the segments contained in the guide section. The period of the repetitive reflections is defined as the length (along the guide’s axis) that the reflected rays take to come back to the starting surface (i.e., surface #1 for the case of Figure 4). Rays entering a given guide segment at the bottom
surface may undergo multiple inter-reflections from the guide side and top surfaces before they bounce back to the bottom surface. Figure 5 shows a schematic description of the guide segments of the repetitive inter-reflections.
The segment length (period) of the repetitive reflections is given by the following relation: χ ⋅ = seg cot seg d L (19) With: ϕ ⋅ θ = χ cos cos cos (20) where:
dseg : total distance traveled by the reflected rays within a segment projected onto the guide’s opening plane (m);
Lseg : segment length (along the x-axis) of the repetitive reflections (m);
θ : angle from the horizontal of incident rays on the guide’s entrance, see Figure 4, (radians);
ϕ : azimuth angle of incident rays with respect to the guide’s axis, see Figure 4, (radians);
χ : angle between the guide’s axis and the incident ray direction (radians). The number of the guide segments for rays entering the guide’s entrance at a point P(x=0,y,z) are given by the following relationship:
(
)
[
]
≤ − + > = L L L L L N seg 0 0 0 L if , / Integer 2 L if , 1 (21) Where: L : guide length (m);L0 : distance (along the x-axis) from the guide’s entrance to the point where a given ray first strikes the guide bottom surface (m).
The number (2) in equation (21) indicates that two segments are added to the front and back of the first and last repetitive segments, respectively.
By referring to Figure 4, the distance L0 may be obtained as follows: ϕ ⋅ θ ⋅ = cot cos 0 z L (22)
The total beam component flux (QTSb(x)) transmitted through the bottom surface of a given guide section of position (x) is made up of the forward and backward
transmitted beam flux components of sunlight emanating from the conical point source:
(
)
(
)
{
}
∫ ∫
+ ⋅ ⋅ = H W , , , , , , ) (x q x y z q x y z dy dz QTSb tfb tbb (23) where:qtf,b : flux density transmitted through the bottom surface of a guide section of position (x) due to the forward reflection of the beam component of sunlight incident on a unit surface area at point P(x=0,y,z) of the guide’s entrance (lumens/m2);
qtb,b : flux density transmitted through the bottom surface of a guide section of position (x) due to the backward reflection of the beam component of sunlight incident on a unit surface area at point P(x=0,y,z) of the guide’s entrance (lumens/m2).
To evaluate the beam transmitted flux densities (qtf,b, qtb,b) of guide sections in equation (23), let us consider an isolated guide segment (with index j) as shown in Figure 5. The flux density transmitted through the bottom surface of a given guide section (denoted by index i, Figure 4) is the summation of all flux densities
transmitted through the guide segments contained in the guide section (i):
(
j j)
i i j j b tf i b tf q x x x x q , , =∑
, , ; with −1≤ −1, < (24)(
j j)
i i j j b tb i b tb q x x x x q , , =∑
, , ; with −1< −1, ≤ (25) where:qtf,b,j : radiation flux density transmitted through the bottom surface of the jth guide segment due to the forward reflections of the beam sunlight incident on a unit surface area at a point P(x=0,y,z) of the guide entrance (equation 115), (lumens/m2);
qtb,b,j : radiation flux density transmitted through the bottom surface of the jth guide segment due to the backward reflections of the beam sunlight incident on a unit surface area at a point P(x=0,y,z) of the guide entrance (equation 116), (lumens/m2), .
Note that equations (24) and (25) are derived for the guide segments (j) fully
contained in the guide section (i). For other cases where a particular guide segment (j) is not fully contained in a guide section (i), a proper weighting factor should be used to evaluate the flux densities of the guide sections.
Similarly, the beam radiation fluxes absorbed at the inner surfaces of a given guide section with position (x) are made up of two components corresponding to the forward and backward reflected beam radiation:
(
)
(
)
{
}
∫ ∫
+ ⋅ ⋅= H W , , , ,
, (x) q x,y,z q x,y,z dy dz
QAsurfb surfafb surfabb (26)
where:
QAsurf,b : beam radiation flux absorbed at a surface of index (surf) of a given guide section (watts);
qsurf,af,b : radiation flux density absorbed at a surface of index (surf) of a given guide section due to the forward reflected beam rays emanating from the point source and incident on a unit surface area at point P(x=0,y,z) of the guide’s entrance (Watts/m2);
qsurf,ab,b : radiation flux density absorbed at a surface of index (surf) of a given guide section due to the backward reflected beam rays emanating from the point source and incident on a unit surface area at point P(x=0,y,z) of the guide’s entrance (Watts/m2);
Similar to equations (24) and (25), the surface radiation flux densities absorbed in a given guide section are obtained as follows:
(
j j)
i i j j b af surf i b af surf q x x x x q , , , =∑
, , , ; with −1≤ −1, < (27)(
j j)
i i j j b ab surf i b ab surf q x x x x q , , , =∑
, , , ; with −1< −1, ≤ (28)Where the index (surf) denotes the guide segment surfaces: front, back, bottom, top, and sides.
To calculate the transmitted and absorbed flux densities of the guide sections in equations (24), (25), (27), and (28), reflections of incident beam rays within a given guide segment have to be known. These reflections depend on the angles of the incident beam rays, and whether or not the rays hit the guide top or side surfaces after bouncing from the bottom surface. Appendix B presents the details of the calculation algorithm.
Transmission and absorption of diffuse rays
Diffuse rays are essential for the guide to function as a luminaire. They originate from the diffusion of the reflected beam sunlight when it strikes the extractor surface and the lighting lamps. The latter may also generate diffuse artificial light when they are switched on to complement sunlight for indoor illumination. As the flux of the reflected diffuse rays varies with the guide length according to the extractor surface area distribution, each guide section may, therefore, have a different lighting output. Ideally, the surface distribution of the extractor is chosen so that the light output from each guide section is uniform. Due to the complex interaction between the diffuse rays and guide geometry, the diffuse light emanating (exiting) from the internal
surfaces of the guide is assumed uniformly diffuse. This is regarded as an
approximation to the specular guide surfaces, which scatter incident diffuse rays in specified directions. This assumption is safe to use when a given guide surface receives rays from all directions. To evaluate the light output flux of the guide, each guide section is assumed to be made up of five surfaces: front, back, bottom (#1), top (#2) and side (#3) surfaces. Figure 6 shows the distribution of the diffuse radiation fluxes at the inner surfaces of a given guide section (i).
The diffuse flux transmitted through a given guide section (denoted by i) and the corresponding absorbed flux at the bottom surface are given as follows:
k to 1 i ; , , 1 , 1 ,i =τ d ⋅ di = d Q QTS (29) k to 1 i ; , , 1 , 1 , , 1di =α d ⋅Q di = QA (30) where:
QTSd,i : diffuse radiation flux transmitted through the bottom surface of a guide section (i) (lumens);
QA1,d,i : diffuse radiation flux absorbed by the bottom surface of a guide section (i) (Watts);
Q1,d,i : diffuse radiation flux incident from all directions on the bottom surface of a guide section (i) (Watts or lumens);
α1,d : diffuse absorptance of the guide’s bottom surface; τ1,d : diffuse transmittance of the guide’s bottom surface.
The incident diffuse flux (Q1,d,i) on the bottom surface of a guide section (i) is a
function of the radiation flux emanating from the front, back, top and side surfaces. A proper radiation flux balance results in the following relationships (see Figure 6):
1 : , , 1 : , , 1 : 3 , , 3 1 : 2 , , 2 , , 1di Q di F Q di F Qgfdi Fgf Qgbdi Fgb Q = ⋅ + ⋅ + ⋅ + ⋅ (31)
[
1, 1, , 1:2 3, , 3:2 , , :2 , , :2]
, , 2 0 , , , 2 , , 2di Q di di d Q di F Q di F Qgfdi Fgf Qgbdi Fgb Q = +ρ ⋅ ρ ⋅ ⋅ + ⋅ + ⋅ + ⋅ (32)(
1−ρ3,d ⋅F3:3)
⋅Q3,d,i =ρ3,d ⋅[
ρ1,d ⋅Q1,d,i⋅F1:3 +Q2,d,i⋅F2:3 +Qgf,d,i⋅Fgf:3 +Qgb,d,i⋅Fgb:3]
(33)(
)
> ⋅ + ⋅ + ⋅ + ⋅ ⋅ ρ = ⋅ + ⋅ + ⋅ + ⋅ ⋅ ρ ⋅ ρ = − − − − , fori 1 1 i for , 1 , , : 3 1 , , 3 : 2 1 , , 2 : 1 1 , , 1 , 1 , , : 3 , , 3 : 2 , , 2 : 1 , , 1 , 1 , , , fb i d gf gb i d gb i d gb i d d bf i d gb gf i d gf i d gf i d d d gf i d gf F Q F Q F Q F Q F Q F Q F Q F Q Q (34)(
)
< ⋅ + ⋅ + ⋅ + ⋅ ⋅ ρ = ⋅ + ⋅ + ⋅ + ⋅ ⋅ ρ ⋅ ρ = + + + + F Q F Q F Q F k Q F Q F Q F Q F Q Q bf i d gb gf i d gf i d gf i d d fb i d gf gb i d gb i d gb i d d d gb i d gb i for , k i for , 1 , , : 3 1 , , 3 : 2 1 , , 2 : 1 1 , , 1 , 1 , , : 3 , , 3 : 2 , , 2 : 1 , , 1 , 1 , , , (35) where:Fs1:s2 : form factor of surface of index (s1) to surface of index (s2) of a given guide section (i);
Q2,d,i : diffuse radiation flux emanating from the top surface of guide section (i) (lumens);
Q3,d,i : diffuse radiation flux emanating from the side surfaces of guide section (i) (lumens);
Qgf,d,i : diffuse radiation flux emanating from the front surface of guide section (i) (lumens);
Qgb,d,i : diffuse radiation flux emanating from the back surface of guide section (i) (lumens);
Q2,d,i,0 : initial diffuse radiation flux emanating from surface #2 of a guide section (i) (lumens);
ρ1,d,i : diffuse reflectance of the bottom surface of guide section (i);
ρ2,d,i : average diffuse reflectance of the top surface (including the extractor) of guide section (i);
ρ3,d,i : diffuse reflectance of the side surfaces of guide section (i); ρfg,d : diffuse reflectance of the front guide surface;
ρfg,d : diffuse reflectance of the back guide surface.
To solve for the surface fluxes of all guide sections, equations (31) to (35) are first solved for every guide section (i), using any suitable method such as the matrix inversion technique. An iterative procedure is then applied to link the fluxes of the guide sections. Iterations are repeated until convergence is reached. Convergence is declared when the maximum flux difference between two consecutive iterations is less than a given tolerance.
The diffuse radiation flux absorbed by the top surface of a guide section (i) is given by:
[
, , :2 1, 1, , 1:2 3, , 3:2 , , :2]
, , 2 , , 2di di Qgfdi Fgf d Q di F Q di F Qgbdi Fgb QA =α ⋅ ⋅ +ρ ⋅ ⋅ + ⋅ + ⋅ (36)where α2,d,i is the average diffuse absorptance of the top surface of a guide section (i), given by equation (18).
Similarly, the diffuse radiation flux absorbed by the side surfaces (combined) of a guide section (i) is expressed as follows:
[
3, , 3:3 , , :3 1, 1, , 1:3 2, , 2:3 , , :3]
, , 3 , , 3di di Q di F Qgfdi Fgf d Q di F Q di F Qgbdi Fgb QA =α ⋅ ⋅ + ⋅ +ρ ⋅ ⋅ + ⋅ + ⋅ (37)and, the diffuse radiation fluxes absorbed by the front and back surfaces of the guide are:
[
d d gf d gf d gf gbd bf]
d gf d gf Q F Q F Q F Q F QA , =α , ⋅ ρ1, ⋅ 1, ,1⋅ 1: + 2, ,1⋅ 2: + 3, ,1⋅ 3: + , ,1⋅ (38)[
d dN gb dN gb dN gb gfdN fb]
d gb d gb Q F Q F Q F Q F QA , =α , ⋅ ρ1, ⋅ 1, , ⋅ 1: + 2, , ⋅ 2: + 3, , ⋅ 3: + , , ⋅ (39)The initial diffuse radiation flux exiting from surface # 2 (Q2,d,i,0) is made up of the radiation fluxes originating from sunbeam light scattered by the extractor and the diffuse artificial light of the built-in lamps. Assuming the lighting lamps are free hanging in the space near the top surface so that its lumen output is split into two equal portions: one portion will be reflected by the top surface of the guide and the other portion will be directed towards the side and bottom surfaces. Assuming that the lamps are approximated as a linear finite source, the initial radiation flux
emanating from surface #2 of a given guide section (i) may be obtained as follows:
[
bdfi bdbi]
(
di)
lampi i d q q dy dz Q Q 2, , , H W , , 2 , , 2 0 , , , 2 =∫ ∫
+ ⋅ ⋅ +0.5⋅ ρ +1 ⋅ (40) Where:Qlamp,i : light output of lamps of guide section (i) (Watts or lumens);
q2,bdf,i : beam-diffuse component of the forward reflected flux density at surface #2 of guide section (i) due to beam rays emanating from the point source and
incident on a unit surface area at point P(x=0,y,z) of the guide’s entrance (lumens/m2);
q2,bdb,i : beam-diffuse component of the backward reflected flux density at surface #2 of guide section (i) due to beam rays emanating from the point source and incident on a unit surface area at point P(x=0,y,z) of the guide’s entrance (lumens/m2).
The beam-diffuse flux components of surface #2 of all guide sections (q2,bdf,i, q2,bdb,i) are obtained from those of the guide segments using equations (24) and (25). Details on the calculation of the beam-diffuse flux components of all guide segments are found in Appendix B.
PERFORMANCE METRICS OF THE CSS
The CSS is mainly used for indoor illumination using sunbeam light. Its optical characteristics (e.g., transmittance) and lighting performance (lumen output, luminance) are, therefore, important for lighting designers. Furthermore, the CSS may collect solar heat and carry it indoors. The solar heat gains are desirable in winter months for heating, but not desirable in summer months as they will add to the cooling load. The thermal performance indicators of the CSS should, therefore, be available to lighting designers. The following performance metrics are considered for the CSS.
Light Transmittance (LT). This is defined as the ratio of the sunlight illuminance flux
transmitted through the guide to the illuminance flux incident on the collection surface of the canopy exterior cover. The spatial distribution of the light transmittance along the guide length (LTS) is also important for designers to efficiently distribute sunlight to various indoor spaces requiring illumination. Based on the forgoing optical
analysis, the overall light transmittance (LT) and its distribution along the guide’s length (LTS) are obtained as follows, respectively:
i c Q QT LT , = (41) i c Q x QTS x LTS , ) ( ) ( = (42)
Note that the fluxes QT and QTS in equations (41) or (42) account for sunbeam lighting only, excluding the artificial lighting (Qlamp = 0).
Luminance Index (LI). This is defined as the ratio of the average luminance exiting
from the guide’s ceiling diffuser to the sky zenith luminance under a particular sky condition (Laouadi and Parekh, 2007). The spatial distribution of luminance along the guide length is also important for glare control in individual spaces served by the light guide. The LI distribution along the guide length is expressed as follows:
z L x L x LI( )= ( ) (43) where:
L(x) : average luminance exiting from a guide section of position (x) (cd/m2); Lz : sky zenith luminance under a given sky condition (cd/m2).
The average luminance exiting from the guide section (x) may be expressed as follows:
( )
( )
x A x QTS x L g , 1 ) ( ⋅ π = (44)where A1,g(x) is the area of the bottom surface of the guide section of position (x). Substituting equation (42) into equation (44), and by accounting for equation (1), one obtains the following relation:
( )
( ) cos cos ) ( , 1 x LTS L E x A A x LI z bh z c g c ⋅ ⋅ θ θ ⋅ ⋅ π = (45)Where Ebh is the sunbeam illuminance received on an outdoor horizontal surface (Ebh = En cos θz). The ratio Ebh/Lz varies with daytime and season. In summer months at noon times when the sun is close to the zenith (e.g., on June 21st), Ebh/Lz takes on the values 6.155 for the CIE standard clear sky conditions, and 1.27 for the IES partly cloudy sky condition (IESNA, 2000). For glare control purpose where the borderline luminance between visual comfort and discomfort is 500 cd/m2 (CIE, 2002), LI should not, therefore, be higher than 0.03 or 0.02 for clear, or partly cloudy sky conditions, respectively.
Solar Heat Gain Coefficient (SHGC). This is defined as the ratio of the total solar
heat transmitted indoors to the solar radiation flux incident on the collection surface of the canopy exterior cover. The total transmitted solar radiation heat is made up of the directly transmitted radiation flux and a portion of the surface absorbed radiation fluxes, which become heat gains to the indoor space. Since the light guide is placed in the plenum space of buildings, the solar radiation fluxes absorbed by its surfaces will be entirely converted to heat gains to the indoor space. However, the absorbed solar radiation fluxes within the exterior canopy box will be unlikely to reach the
g
SA ST
SHGC = + (46)
where:
ST : solar transmittance of the CSS over the complete solar spectrum; SAg : solar absorptance of the guide over the complete solar spectrum.
Equation (41) is used to evaluate ST by replacing the normal sunbeam illuminance (En) by the normal solar radiation. The solar absorptance of the guide is obtained as follows: i c g g Q QA SA , = (47)
where QAg and Qc,i are obtained using equations (15) and (1), respectively, by replacing sunlight illuminance by solar radiation.
MODEL VALIDATION
Detailed ray tracing technique and field measurement were used to validate the previously developed model. Details on the comparison study follow.
DETAILED RAY-TRACING
The development team of the CSS at the University of British Columbia (BC),
Canada, employed a detailed ray-tracing technique to design an efficient system, in particular the collection and concentration components (Rosemann et al., 2008a; Mossman, 2009). The commercial computer program, TracePro (LRC, 2002) was used for this purpose. TracePro uses the forward ray tracing technique for optical analysis in complex geometries. In this study, TracePro was used to compute the illuminance flux reaching the guide’s entrance. Propagation of sunlight rays in the guide was not included in the study. The simulated prototype of the CSS, after optimization of its optical components, had the following characteristics: number of mirrors = 84, width of mirrors = 17 cm, height (depth) of mirrors = 19 cm and spacing of mirrors = 16.8 cm. The luminous reflectance of the mirror arrays and the parabolic concentrators was 98%. Upon using those inputs, TracePro calculated the
illuminance flux reaching the guide’s entrance (equation 5) for various sun altitude and azimuth angles on the 21st day of each month of the year. Collimated beam rays with a normal unit flux emanating from a distant source (sun) were assumed.
reflections by the mirrors until they get to the guide’s entrance. The software
accounted for the self shading of mirrors, and flux loss of rays travelling between the flat mirrors. The results were presented as a ratio of the flux reaching the guide’s entrance at particular sun altitude and azimuth angles to the flux reaching the guide’s entrance on the 21st of May at noon standard time in Vancouver, BC (latitude = 49.18° , longitude = 123.17°). The TracePro predictions were verified by measurement on selected days (Mossman, 2009).
The previously developed model was implemented in an in-house version of SkyVision (NRC, 2010). Using the same inputs of the studied CSS, SkyVision
calculated the illuminance flux reaching the guide’s entrance and the illuminance flux exiting from the guide ceiling diffuser. The SkyVision predictions were compared to those of TracePro.
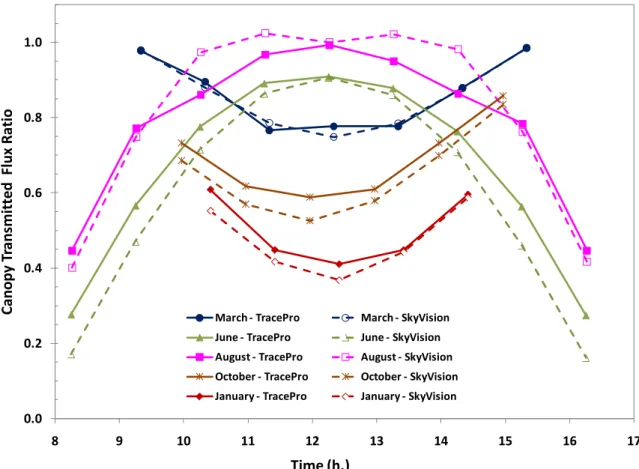
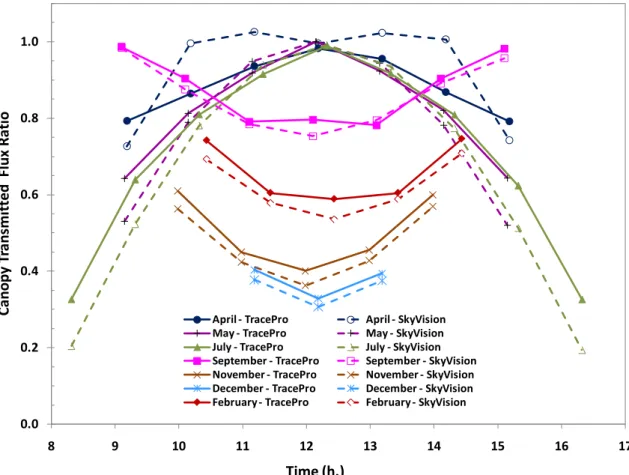
Figures 7 and 8 show a comparison between the predictions of both TracePro and SkyVision on the 21st day of each month of the year. The figures clearly show that SkyVision predictions are in good agreement with the detailed ray-tracing results with a maximum error of 18%. For months from January to March and from September to December (low sun altitude angles), the transmitted flux ratio follows an inverse-bell shape trend, while for months from May to July (high sun altitude angles) the
transmitted flux ratio resembles a bell shape. For the months of April and August (intermediate sun altitude angles), however, SkyVision’s trend is quite different from TracePro, in that the flux ratio follows an M-shaped trend. The SkyVision’s trend appears somewhat transitional from low to high sun altitude angles, instead of bending over immediately as predicted by TracePro.
FIELD MEASUREMENT
Researchers at the University of British Columbia constructed a portable test facility with a demonstration prototype of the CSS mounted above the windows of the south wall (Rosemann et al., 2008a,b; Rosemann et al., 2007). The interior space of the facility had the following dimensions: length (depth) = 10 m, width = 3 m,
height = 2.8 m. To simulate a large open-plan office space, mirrors were installed on the long side walls. The south wall contained a double-glazed window with a
luminous transmittance of 30% (Rosemann et al, 2007). The luminous reflectances of the interior surfaces were roughly determined to be: 80% for the walls and ceiling, and 20% for the floor.
The demonstration CSS had a transparent box, made of a 6 mm clear Plexiglas, and 84 mirrors (with dimensions as stated before). A Fresnel lens was added to the system and placed after the flat mirror arrays to concentrate light onto the large parabolic mirrors. For this particular system, the entrance surface of the guide was not covered by any glass.
The concentrated sunlight was distributed to the indoor space using a dual-function light guide with a rectangular cross-section (width = 20 cm, and height = 60 cm). A series of eight guide sections were constructed, resulting in a total length of 10 m. The dimensions of the tapered extraction panel were roughly determined by a previously designed software algorithm. The first two sections had no extractor, but the T5 electric lamps acted like an extractor with a surface area ratio of 0.005. The extractor surface area ratio of the third to the last sections had a non-linear
distribution pattern as follows, including the electric lamps (Rosemann et al., 2007): 0.047, 0.089, 0.172, 0.338, 0.505, and 0.672.
A measurement grid of 0.5 m by 0.5 m was setup at work plane level (0.8 m above the floor) and multiple daylight sensors were installed. The illuminance
measurements were taken under different sky conditions with or without the
contribution of the windows. The outdoor solar radiation was not, however, recorded during the experiment. The measurement took place in Vancouver, British Columbia, Canada.
SIMULATION METHODOLOY
The new in-house version of SkyVision was used to simulate the above test facility. SkyVision employs a simple radiosity method to predict the illuminance distribution on the interior room surfaces. The room vertical walls are split into a number of
circumferentially uniform stacked zones, and the room floor surface is split into a number of grid points. The ceiling surface is modelled as one surface. The guide of the CSS is modelled as a linear rectangular light source with eight sections. Each guide section has a uniform diffuse light output. SkyVision calculates the light output from each guide section under given sky conditions based on the assumption that the cone vertical half angle of concentrated rays incident on the guide’s entrance is set equal to 19° (this is close to the value of 20° as communicated by Mossman, 2009). The light output distribution along the guide is sensitive to this angle. Lower angles result in higher output flux at the back of the guide whereas higher angles results in
higher output flux at the front of the guide near the windows. The value of 19° was found to yield consistent results with the measurement as will be shown below. To simulate the geometry of the measurement facility, an open-plan office (with length = 10 m, width = 9 m and height = 2 m) consisting of three rows of workstations (each row is served by a CSS) was considered. The workstation rows were spaced by 3 m apart. The luminous reflectances of the office interior surfaces were fixed at: 10% (black color) for the long side walls, 80% for the back wall and ceiling, 50% for the front wall (average between the window and wall reflectance), and 15% for the floor surface (work plane). The simulation results for the indoor space (10 m x 3 m x 2 m) covered by the central CSS were retained for comparison with the
measurement.
Upon the use of the previous inputs, SkyVision calculated the illuminance distribution on the work plane surface on the selected days of the measurement. Since the outdoor solar radiation was not recorded during the measurement periods, SkyVision used two sky condition models to mimic the sunny sky conditions of the experiment: CIE standard clear sky conditions (CIE, 2001), and weather-based sunny sky
conditions (Perez et al., 1993) deduced from the Vancouver weather file for energy calculation.
Figure 9 shows a comparison between the predicted and measured illuminance distribution under the central CSS on June 16 at 13:15. The predictions followed the same trend as the measurement, resulting in a good agreement with a maximum error of 15% (excluding the points very close to the window). Near the window, the predicted maximum illuminance is slightly offset towards the window compared to the measurement. This difference might be due to the incident rays not fully covering the guide’s entrance (assumption #2) resulting in the rays intersecting with the guide’s inner surfaces at farther distance from the window. Both measurement and
predictions indicated that some incident rays leaked through the ceiling diffuser (LOF) at the entrance of the guide, resulting in higher room illuminances. Previous analysis attributed this light leakage to the direct sunbeam light transmitting through the
guide’s entrance without being redirected by the mirrors (Rosemann et al., 2008b). The simulation discovered, however, that this direct transmitted flux is very small compared to the flux redirected by the mirrors (due to the fact that the guide opening area is about 5% of the total mirror area). Therefore, this light leakage is more likely
due to some redirected rays, which are out of the acceptance angle of the ceiling diffuser. For an optimum function, this light leakage should be avoided in the presence of windows, which cover the wall perimeter space. One option to avoid such undesirable effect would be to reduce the guide’s width, or to place the small parabolic mirrors at an optimum distance from the guide’s entrance.
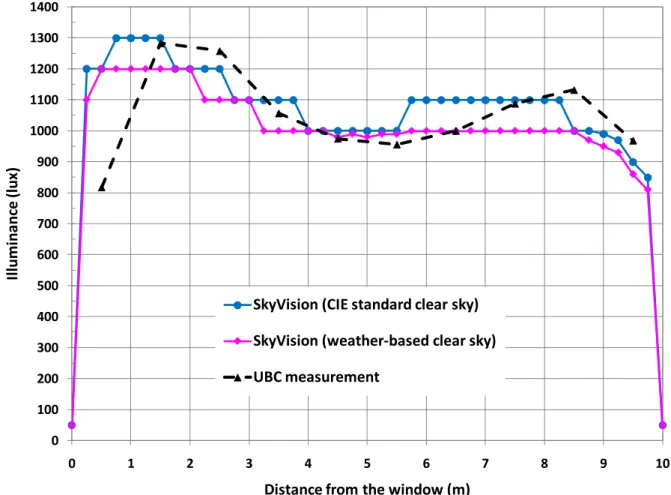
Figure 10 shows a comparison between the hourly predicted and measured
illuminance at a distance of 9 m from the window under the central CSS on June 25 (sunny day). Both the predictions and measurement followed the same trend. The predictions on the CIE standard clear sky conditions were about 20% higher than the measurement. June 25 was actually a bit hazy in the morning and clear in the
afternoon (Rosemann et al., 2008a). A day (from the weather file) which resulted in similar sky conditions and was close to the test day was June 22. The predictions on June 22 using the weather file data matched very well with the measurement, with a maximum error of 13%.
Figures 11 and 12 show a visual comparison of iso-contour illuminance maps (at the work plane) between the predictions and measurement of the central CSS for June 16 at 13:15 (CIE standard clear sky) and October 3 at 13:00 (weather-based clear sky), respectively. The predicted illuminance iso-contours have a similar distribution as the measured iso-contours, but differ with them in absolute values. The
predictions tend to be higher or lower than the measurement due to the fact that the simulated sky conditions are different from the actual sky conditions.
CONCLUSION
This paper presented the development of a sufficiently accurate and reliable optical model to predict the daylighting and thermal performance of the CSS. The CSS uses arrays of mirrors to collect and redirect sunbeam light from the façade and transport it deep into core spaces of buildings through a light guide in the plenum from which it is diffused into the indoor spaces below. Fluorescent lamps in the light guide provide any extra light necessary to maintain target illuminances. The CSS has gone through extensive design optimisation and testing, and is currently nearing the
commercialisation stage. The developed model will aid not only the development team to fine-tune and optimize its performance, but also building designers and engineers to specify and custom-design CSS to improve the energy efficiency of commercial buildings. The model was based on the ray tracing technique to compute
the amount of sunlight illuminance transmission through the light guide to interior spaces of buildings, and absorption of solar radiation within the components of the CSS, which may become solar heat gains indoors. The model was validated using a detailed ray tracing technique and field measurement carried out by the developers on a previous prototype. The detailed ray tracing technique used a commercial software tool to compute the amount of sunlight flux reaching the guide’s entrance after multiple inter-reflections by the optical components in the canopy box. The field measurement took place in a test-bed facility of a typical open plan office space, equipped with a prototype of the CSS. The validation results showed that the model predictions were in good agreement with the ray tracing and measurement results. The model can be integrated in to existing fenestration design tools, or in to whole-building energy simulation software, with significantly lower calculation time
compared to the full integration of suitable commercial lighting simulation software.
ACKNOWLDGEMENT
This work was funded by the Institute for Research in Construction of the National Research Council Canada (NRC-IRC), and the Panel on Energy Research and Development (PERD) administered by Natural Resources Canada. The author is very thankful for their contribution. The author would also like to thank Dr. Lorne Whitehead and Dr. Michele Mossman from the University of British Columbia (Canada) for providing the ray tracing and measurement results and detailed information on the construction and function of the CSS.
REFERENCES
3M. 2000a. 2301 Optical Lighting Film. Technical Specification. Minnesota: 3M.
3M. 2000b. Light Enhancement Film 3635-100. Product Bulletin. Minnesota: 3M.
Aizenberg, J. B. 2010. Outcome of research, developments, production and application of extended hollow light guides (1964-2009). Proceedings of the CIE 2010“Lighting Quality and Energy Efficiency”; Vienna, Austria. 332-335.
Callow, J. M., Shao, L., 2003. Air-clad optical rod daylighting system. Lighting Reseach and Technology; 35: 31-38.
CIE. 2002. CIE Collection on Glare. Austria: International commission on illumination.
CIE. 2001. Spatial distribution of daylight – CIE standard general sky. CIE DS 011.1/E-2001. Austria: CIE x035.
Duffie J.A., and Beckman W.A. 1991. Solar Engineering of Thermal Processes. 2nd Edition. New York: John Wiley & Sons Inc.
Greenup, P. J., Edmonds. I. A. 2004. Test room measurements and computer
simulations of the micro-light guiding shade daylight redirecting device. Solar Energy; 76: 99-109.
Hien, V.D., and Chirarattananon S. 2009. An experimntal study of a façade mounted light pipe. Lighting Research and Technology; 41: 123-142.IESNA. 2000. Lighting Handbook. Reference and Application Volume. New york: Illuminating Engineering Society of North America.
Kim, J.T., and Kim G. 2010. Overview and new developments in optical daylighting systems for building a healthy environment. Building and Environment; 45: 256-269.
Kwok, C.M., and Chung T.M. 2008. Computer simulation study of a horizontal light pipe integrated with laser cut panels in a dense urban environment. Lighting
Research and Technology; 40: 287-305.
Laouadi, A. and Parekh, A. 2007. Complex fenestration systems: towards product ratings for indoor environment quality. Lighting Research and Technology; 39(2): 109-122.
LRC. 2002. TracePro. Software for Opto-Mechanical Modeling. Version 3. Massachusetts: Lambda Research Corporation.
NRC. 2010. SkyVision v1.2.1 National Research Council of Canada. Availaable for free download from : http://irc.nrc-cnrc.gc.ca/ie/light/skyvision/ [Accessed January 2010].
NRCan, 2010. National Energy Use Database. Office of Energy Efficiency. URL:
http://oee.nrcan-rncan.gc.ca/corporate/statistics/neud/dpa/comprehensive_tables/.
Accessed in January 2010.
Perez R., Seals R., and Michalsky J. 1993. All-weather model for sky luminance distribution – preliminary configuration and validation. Solar Energy; 50(3): 235-245.
Rosemann A. and Kaase H. 2005. Lightpipe applications for daylighting systems. Solar Energy; 78(6): 772-780.
Rosemann A., Mossman M., Whitehead L. 2008a. Development of a cost effective solar illumination system to bring natural light into the building core. Solar Energy; 82: 302-310.
Rosemann A., Cox G., Friedel P., Mossman M., Whitehead L. 2008b. Cost effective controlled illumination using daylighting and electric lighting in a dual-function prism light guide. Lighting Research and Technology; 40: 77-88.
Rosemann A., Cox G., Upward A., Friedel P., Mossman M., Whitehead L. 2007. Efficient Dual-Function Solar/Electric Light Guide to Enable Cost-Effective Core Daylighting. LEUKOS; 3(4): 265-269.
Schlegel, G. O., Burkholder, F. W., Klein, S. A., Beckman W. A., Wood, B. D., Muhs, J. D. 2004. Analysis of a full spectrum hybrid lighting system. Solar Energy; 76: 359– 368.
Tsangrassoulis, A., Doulos, L., Santamouris, M., Fontoynont, M., Maamari, F., Wilson, M., Jacobs, A., Solomon, J., Zimmermann, A., Pohl, W., Mihalakakou, G. 2005. On the energy efficiency of a prototype hybrid daylighting system. Solar Energy; 79: 56–64.
Whitehead L. 2009. Solar Canopy Demonstration Project – BCIT Phase I. Internal Report. University of British Columbia, BC, Canada.
Whitehead, L., Upward A., Friedel P., Rosemann A., Mossman, M. 2007, A Cost-effective approach to core daylighting. Proceedings of the 2nd Canadian Solar Buildings Conference. Calgary: Solar Building Reseach Network, 1-5.