Publisher’s version / Version de l'éditeur:
Indoor Air, 11, December 4, pp. 246-256, 2001-12-01
READ THESE TERMS AND CONDITIONS CAREFULLY BEFORE USING THIS WEBSITE. https://nrc-publications.canada.ca/eng/copyright
Vous avez des questions? Nous pouvons vous aider. Pour communiquer directement avec un auteur, consultez la
première page de la revue dans laquelle son article a été publié afin de trouver ses coordonnées. Si vous n’arrivez pas à les repérer, communiquez avec nous à [email protected].
Questions? Contact the NRC Publications Archive team at
[email protected]. If you wish to email the authors directly, please see the first page of the publication for their contact information.
NRC Publications Archive
Archives des publications du CNRC
This publication could be one of several versions: author’s original, accepted manuscript or the publisher’s version. / La version de cette publication peut être l’une des suivantes : la version prépublication de l’auteur, la version acceptée du manuscrit ou la version de l’éditeur.
For the publisher’s version, please access the DOI link below./ Pour consulter la version de l’éditeur, utilisez le lien DOI ci-dessous.
https://doi.org/10.1034/j.1600-0668.2001.110406.x
Access and use of this website and the material on it are subject to the Terms and Conditions set forth at
Sorptive interactions between VOCs and indoor materials
Won, D. Y.; Corsi, R. L.; Rynes, M.
https://publications-cnrc.canada.ca/fra/droits
L’accès à ce site Web et l’utilisation de son contenu sont assujettis aux conditions présentées dans le site
LISEZ CES CONDITIONS ATTENTIVEMENT AVANT D’UTILISER CE SITE WEB.
NRC Publications Record / Notice d'Archives des publications de CNRC:
https://nrc-publications.canada.ca/eng/view/object/?id=e44964df-3ebf-4f9f-8a75-e72c46d47f5e https://publications-cnrc.canada.ca/fra/voir/objet/?id=e44964df-3ebf-4f9f-8a75-e72c46d47f5e
Sorptive interactions between VOCs and indoor materials
Won, D.; Corsi, R.L.; Rynes, M.
A version of this paper is published in / Une version de ce document se trouve dans:
Indoor Air, v. 11, no. 4, Dec. 2001, pp. 246-256
www.nrc.ca/irc/ircpubs
SORPTIVE INTERATIONS BETWEEN VOCS AND INDOOR MATERIALS
Doyun Won ∗, Richard L. Corsi and Mike Rynes The University of Texas at Austin
Texas Institute for the Indoor Environment Austin, TX 78758
Fax: 1-512-471-1720
Abstract
A study was completed with various materials (carpet, gypsum board, upholstery, vinyl and wood flooring, acoustic tiles, and fruit) that were exposed to eight gaseous VOCs (isopropanol, MTBE, cyclohexane, toluene, ethylbenzene, tetrachloroethene, 1,2-dichlorobenzene, and 1,2,4-trichlorobenzene) in electro-polished stainless-steel chambers. Dynamic responses in VOC concentrations were used to determine linear adsorption and desorption rate coefficients and equilibrium partition coefficients. A linear adsorption/desorption model was used to effectively describe the interactions between VOCs and indoor surface materials for short-term source events (10 h). Relationships between sorption parameters and chemical vapor pressure and octanol-air partition coefficient were observed. Carpet was identified as the most significant sorptive sink for non-polar VOCs. Virgin gypsum board was observed to be a significant sink for highly polar VOCs. Sorptive interactions between non-polar VOCs and indoor materials were not affected by variations in relative humidity. However, increases in relative humidity were observed to increase the degree of sorption of isopropanol to carpet.
Key words: sorptive sinks, volatile organic compounds, indoor air, vapor pressure, octanol-air partition coefficient
Practical Implications
Linear adsorption/desorption coefficients and equilibrium partition coefficients are provided for a large number of volatile organic compounds (VOCs) and indoor materials. These sorption parameters can be used by modelers to predict the impacts of sorptive materials on indoor air quality, and on occupant exposures to VOCs. The experimental results presented herein clearly
demonstrate the relative sorption capacities of various indoor materials, the importance of carpet as a sorptive sink for non-polar VOCs, and the importance of virgin gypsum board for polar VOCs. Such information may be valuable to architects and building designers who wish to minimize or maximize sorptive interactions as a means of influencing indoor air quality. Finally, results of this study indicate a significant potential for estimating fundamental sorption
parameters based on chemical properties such as vapor pressure or octanol-air partition
coefficient, a process that could streamline future screening assessments of sorptive interactions for chemicals in which experimental data are lacking in the published literature.
Introduction
Adsorptive materials may lead to reductions in peak concentrations of volatile organic
compounds (VOCs), and hence reductions in occupant exposure to VOCs during transient source events. However, sorptive materials may also act as re-emitting sources, thus increasing VOC retention times in indoor environments (Sparks et al., 1991). Sorptive materials may also serve as VOC "reservoirs", leading to dermal or oral exposures upon direct contact with the material. Several authors have used either static or dynamic (flow-through) chamber experiments to determine equilibrium partition coefficients or sorption rate coefficients for gaseous chemicals and indoor materials. Tichenor et al. (1991) studied five common materials (carpet, wallboard, ceiling tile, pillow, and glass) and two chemicals (tetrachloroethene and ethylbenzene).
Colombo et al. (1993) considered two sorption processes (fast and slow) for three materials (carpet, gypsum board, and blown vinyl) and eight chemicals (tetrachloroethene, α-pinene, 1,2,4-trimethylbenzene, 2-butoxyethanol, decane, 1,4-dichloroebenzene, 2-ethylhexanol, and n-dodecane). van der Wal et al. (1998) used an empirical model to determine equilibrium partition
coefficients between six materials (nylon and wool carpet, particle board, wallpaper, curtain, and stainless steel) and ten chemicals (toluene, m- & p-xylene, mesitylene, n-decane, n-undecane, 2-ethylhexanol, tetrachloroethene, limonene, ethylene glycol monobutylether, and 2,2,4-methyl-1,3 pentanediol diisobutyrate). Jørgensen and Bjørseth (1999) studied two carpets (nylon and wool) and two chemicals (toluene and α-pinene).
Despite past efforts to quantify the importance of sorptive sinks, and related parameter estimation for sorption models, there have been only limited attempts to study sorption parameters within the context of adsorbate properties. An et al. (1999) showed that the
equilibrium partition coefficient should be inversely proportional to chemical vapor pressure to the first power for mono-layer sorption defined by Langmuir theory and ideal gas conditions. They provided experimental data for five VOCs and four materials that were consistent with such an inverse relationship. Van der Wal et al. (1998) presented screening results for 10 chemicals and several indoor materials, and also observed an inverse relationship between the extent of adsorption and adsorbate vapor pressure. However, relationships between kinetic parameters (adsorption and desorption coefficients) and chemical properties have not been reported in the published literature. Such information might be valuable for ascertaining whether surface interactions or mass transfer phenomena limit sorption kinetics. For example, a strong correlation between sorption kinetic parameters and adsorbate properties would suggest that surface interactions dominate the rate of adsorption or desorption. Conversely, a weak
correlation between sorption kinetic parameters and chemical properties would suggest that mass transfer to the adsorbent surface, or diffusion within a porous material, are the processes that limit the sorption process. The latter phenomenon would, theoretically, provide a relationship
between molecular diffusion coefficients and sorptive interactions, e.g., as opposed to vapor pressure and sorptive interactions.
The results presented in this paper are intended to expand the existing data and knowledge bases associated with the sorptive interaction of VOCs and indoor materials, and serve as a follow-up to a recent paper focused entirely on sorptive interactions between VOCs and new carpet (Won et al., 2000). Adsorption and desorption parameters for a combination of fifteen common indoor surface materials and eight chemicals were determined and are presented herein
Background
The most widely used model for predicting sorptive interactions between gaseous chemicals and indoor materials is given by Equations 1 and 2, which define mass balances on the headspace of an inert and well-mixed chamber and a sorptive material placed within that chamber,
respectively. A M k A C k C Q C Q dt dC V g = g g,in − g g − a g + d n (1) dM dt k Ca g k Md n = − (2)
Here, Cg is the VOC concentration in chamber air (mg/m3), Cg,in is the VOC concentration in
inlet air (mg/m3), V is the chamber volume (m3), Qg is the air flow rate through the chamber
(m3/h), A is the sink area (m2), ka is the adsorption rate coefficient (m/h), kd is the desorption rate
coefficient (1/h if n = 1), M is the mass collected on the sink per unit area (mg/m2), and n is a
constant that accounts for non-linearities in the desorption process (-).
The area (A) is typically assumed to be the horizontally projected area of a material surface, i.e., as opposed to the true area that accounts for interior pores and irregularities
(roughness) of exposed surfaces. For all intents and purposes, increased surface areas due to surface irregularities and internal pores, as well as bulk mass transport and diffusive transport processes, are implicitly "lumped" into the adsorption and desorption coefficients. Furthermore, "n" is typically assumed to equal unity, consistent with an assumption that a linear equilibrium relationship exists between M and Cg at the low concentrations often observed in non-industrial
indoor environments. This assumption allows for the material/air equilibrium partition
coefficient (Keq) for a specific VOC to be defined by the ratio ka/kd. Thus, knowledge of any two
of these three parameters defines the complete set of three equilibrium and kinetic parameters. For example, if ka and kd are known, Keq can be determined and used to estimate the equilibrium
mass loading on materials for a given indoor concentration. Conversely, if Keq and either ka or
kd are known, the second kinetic parameter can be determined and used to model the dynamic
sorptive interaction between indoor materials and gaseous contaminants.
Tichenor et al. (1991) and Jørgensen and Bjørseth (1999) employed Equations 1 and 2 for the case of n = 1. Analytical solutions for Cg and M were used in conjunction with data from
small chamber experiments to back-calculate ka and kd. Values of Keq were estimated as the ratio
ka/kd. Tichenor et al. (1991) noted that Equations 1 and 2 are appropriate for relatively flat,
smooth surfaces, e.g., wallboard, but may be inappropriate for complex surfaces such as carpet systems and other porous materials. Diffusion-controlled and hybrid (sorption and diffusion) models have been proposed for the latter materials (Little and Hodgson, 1996; Dunn and Chen, 1993), and may be more appropriate than Equations 1 and 2 when relevant data are available. This is particularly true for longer periods of sorptive interaction and for long-term re-emission from the sorptive material.
Experiments were completed over relatively short time periods (18 hours) and precluded evaluations based on advanced models, e.g., diffusion or hybrid models. However, as with recent work by van der Wal et al. (1998) and Jørgensen and Bjørseth (1999), the experimental protocols described herein allowed for a rapid screening of the relative importance of sorption for several VOCs and materials. Furthermore, experimental results were used to back-calculate
ka and kd, and to subsequently estimate Keq, for a large number of chemical and material
combinations.
Methodology
The experimental system consisted of four 50-L electro-polished stainless steel chambers arranged in parallel (Figure 1). During each experiment, one of the four chambers was used as a blank (no material added). A syringe pump was used to deliver a mixture of target VOCs into a manifold, where the chemicals were volatilized into an air stream that was split evenly for delivery to each chamber. Exhaust from each chamber was directed to a valve that was
programmed to allow for sequential sampling from each chamber. Samples were directed to an on-line gas chromatography system (SRI 8610C) equipped with a flame ionization detector (GC/FID). All transfer lines in the system were made of either TeflonT M or stainless-steel.
Each experiment lasted 18 hours, and included a 10-hour adsorption stage (with chemical injection) and an 8-hour desorption stage (no chemical injection). Equations 1 and 2 and concentration (Cg) profiles for the adsorption stage were used along with a best-fit, regression
analysis using Marquardt's method to solve for ka and kd. The resulting sorption parameters were
Sorptive materials included three carpets, two carpet pads (cushions), three types of gypsum board (virgin, painted, wallpapered), vinyl and wood flooring (maple plank with polyurethane coating), ceiling (acoustic) tile, fiberglass shower stall, upholstery (100% cotton), and apples (unwashed). The cut edges and reverse side of each specimen were sealed with sodium silicate and allowed to dry prior to each experiment. The three carpet specimens were all tufted with polypropylene backing. Two of the carpet specimens (carpet 1 and carpet 3)
consisted of nylon cut-pile fibers, while the third (carpet 2) was comprised of 90% olefin/10% nylon loop-pile fibers. Carpet fibers were treated with either StainmasterT M (carpet 1) or
ScotchgardT M (carpets 2 and 3) at the manufacturer. Two carpet pads were used, each comprised
of bonded polyurethane. Differences in the sorptive capacities of each pad were small and are hereafter neglected.
Target VOCs were selected based on a broad range of vapor pressures and octanol-air partition coefficients, and not necessarily on their frequency of occurrence or magnitude of concentration in indoor environments. However, MTBE, toluene, and ethylbenzene are constituents of gasoline, and the latter two compounds, along with cyclohexane, are also found in many adhesives and consumer products. As such, these compounds are often observed in indoor environments. Tetrachloroethene is a common dry-cleaning agent and a constituent of some consumer products. As such, it is also observed in many residential dwellings. o-Dichlorobenzene is a reasonable surrogate for p-dichlorobenzene, a common moth repellant and air “freshener” that is found at elevated levels in buildings where such products are employed. 1,2,4-Trichlorobenzene was added as a chemical that borders on being a semi-volatile organic compound (SVOC). Isopropanol was selected to represent highly polar VOCs. Chemical vapor pressure ranged from 46 to 33,000 Pa and octanol-air partition coefficients, calculated as the ratio of octanol-water partition coefficient and Henry’s law constant, ranged from 97 to 19,000 m3air/m
3
octanol. Preliminary
experiments indicated that multi-component effects were statistically insignificant (Won et al., 2000). Thus, subsequent experiments included all eight VOCs.
Standard experimental conditions included inlet gas concentrations ranging from 6 to 15 mg/m3, 0% final relative humidity, a temperature of 24 - 25 oC , and an air exchange rate of 0.5
air changes per hour. Three different classes of inlet concentrations (6-15, 12-30, and 37–102 mg/m3) (2.5, 5, and 15 ppm) were studied for each VOC in the presence of carpet 1 with
padding. In all cases, the inlet concentrations had no observable effect on sorption parameters, suggesting that, although higher than observed in most indoor environments, concentrations in chambers were low enough to exhibit a linear relationship between concentration in air and mass on the adsorbent material. Air exchange rates of 0.5, 2.1 and 3.2/h were also used with carpet 1 and padding. There were no apparent effects of air exchange rate on ka, suggesting that mass
transfer from air to the material surface was not a limiting factor in the sorption process. Small reductions in kd were observed as the air exchange rate increased for 1,2-dichlorobenzene and
1,2,4-trichlorobenzene. However, the effects were generally small relative to those influenced by chemical and material properties and will not be considered further in this paper.
Relative humidity (RH) was always in the range of 50 to 70% at the beginning of each experiment. Inlet gas conditions were adjusted to allow for establishment of constant RH by the sixth hour of each experiment. Final values of 0%, 50% and 80% RH were tested for six
different materials.
Results
Normalized concentration profiles (gas concentration in chamber divided by inlet gas
concentration) for tetrachloroethene are presented in Figure 2. One set of curves corresponds to the reference (empty) chamber, and includes measured data and a dashed line that corresponds to a theoretical well-mixed reactor at the experimental air exchange rate of 0.5 per hour. The
second set of curves corresponds to a chamber containing carpet 1 with an underlying pad. Open circles depict measured data. The solid line corresponds to model predictions based on values of
ka and kd that were determined during the adsorption stage (first ten hours). Similar plots were
developed for every combination of VOC and material.
Data for the reference chamber compared favorably with an assumed well-mixed and inert chamber. This was true for all VOCs other than 1,2,4-trichlorobenzene, which generally
exhibited some level of sorption to the experimental and/or analytical systems. The extent of tetrachloroethene sorption to carpet 1 with padding is clear, as over 40% of the inlet mass sorbed to the material during the adsorption stage. Furthermore, values of ka and kd determined from the
adsorption stage led to good agreement between predicted and measured desorption profiles. Desorption stage data also illustrate that sorptive sinks can increase chemical retention times in an indoor environment. This is reflected by higher gas concentrations in the material chamber than in the reference chamber after hour 12.
The value of the coefficient of multiple determination (R2) from nonlinear regression
analyses was 1.0 for all chemicals in the reference chamber and very close to unity for all experiments in the material chamber. The value of R2 was as low as 0.97 for
1,2,4-trichlorobenzene.
Summary of Sorption Parameters
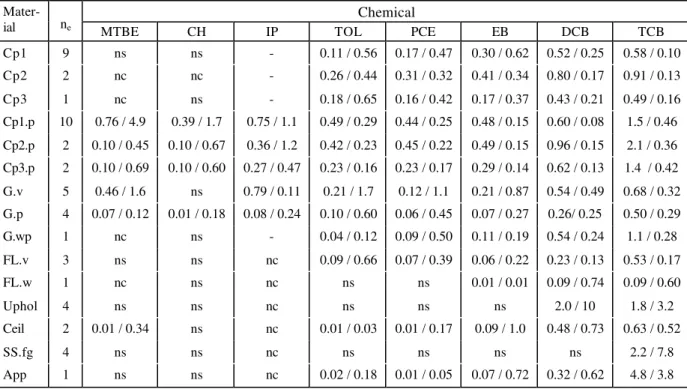
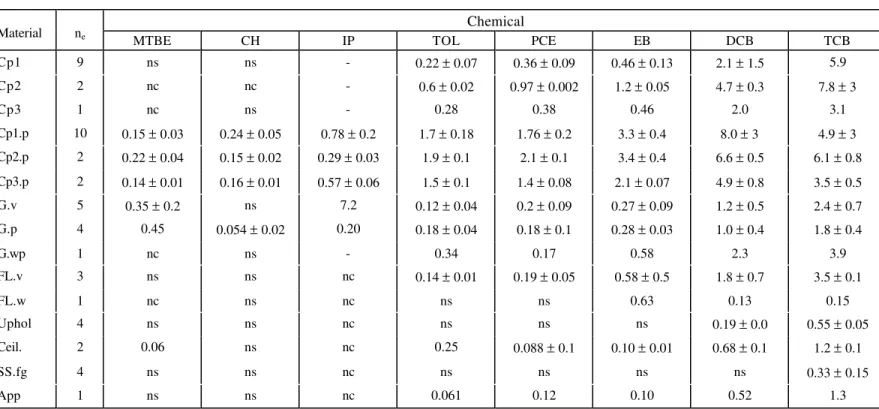
A summary of the average and standard deviation of sorption parameters is provided in Tables 2 (ka and kd) and 3 (Keq). For reasons of brevity, standard deviations are not provided for ka and kd.
In nearly all cases, variations associated with relative humidity, inlet gas concentration, and air exchange rate were used in the averaging process. The one exception was for isopropanol, for
which only 0% RH data were used in the averaging process. Variabilities can be expressed in terms of a coefficient of variation (CV = standard deviation divided by the arithmetic mean) for those VOC/material combinations with three or more data points. Over all experimental conditions, the mean values of CV were 0.42, 0.54, and 0.32 for ka, kd and Keq, respectively.
With virgin gypsum board excluded, the mean values of CV were 0.33, 0.45 and 0.31, respectively.
Due to differences in test chemicals and material properties, it is difficult to compare sorption parameters with those reported previously. Compared to the findings of Tichenor et al. (1991), the best agreement was for tetrachloroethene and carpet, with their ka within 25% (lower)
of the average values obtained in this study for two nylon carpets. Their value of kd for
tetrachloroethene and gypsum board was only 30% greater than the average value obtained in this study. Other parameters were generally within an order of magnitude of those obtained for this study. Tichenor et al. (1991) also reported a Keq of 0.97 m for tetrachloroethene and carpet.
The range of Keq for tetrachloroethene and carpet in this study was 0.36 m to 0.97 m. A value of
Keq = 0.08 m reported by van der Wal et al. (1998) for tetrachloroethene and virgin gypsum
board was in excellent agreement with the average value of 0.09 m observed in this study. Jørgensen and Bjørseth (1999) reported a value of ka = 0.422 m/h, kd = 0.674 /h, and Keq = 0.626
m for toluene and nylon carpet. Their values of ka and Keq were four and three times greater than
that of carpet 1 in this study, respectively. However, their value of kd = 0.674/h exhibited
excellent agreement with values of 0.56 /h and 0.65 /h for carpet 1 and carpet 3, respectively, in this study.
As shown in Tables 2 and 3, the extent of sorption is highly dependent on adsorbent (material) characteristics. Example concentration profiles for 1,2-dichlorobenzene are presented in Figure 3 for fifteen materials. Sorption capacities for non-polar VOCs were greatest for carpet and carpet/pad systems followed by gypsum board and vinyl flooring. However, virgin gypsum board exhibited the greatest extent of sorption for polar VOCs (isopropanol and MTBE). Figure 4 provides concentration profiles for isopropanol exposed to each of five materials. The
observations presented in this paper are consistent with those presented by Meininghaus et al. (1999), who reported that polar compounds, e.g., tert butyl acetate, sorbed and/or diffused to gypsum board to a greater than did non-polar compounds.
Interestingly, apples were observed to sorb both 1,2-dichlorobenzene and 1,2,4-trichlorobenzene, presumably to the waxy film attached to the apple skin. These results are novel and suggest that foodstuff which is left exposed to airborne VOCs (on counter tops or within cupboards) may become contaminated and later serve as sources for ingestion exposure to those compounds.
The importance of understanding sorption kinetics, as opposed to simply equilibrium sorption conditions, is illustrated by the findings presented in Tables 1 and 2 for virgin and painted gypsum board. With the exception of isopropanol, which exhibited significant sorptive interaction with virgin gypsum board, the equilibrium partition coefficients for each chemical were similar for both virgin and painted gypsum board (Table 1). One might interpret these results to suggest that both types of gypsum board will have a similar effect on indoor
concentrations of non-polar VOCs. However, virgin gypsum board generally exhibited higher adsorption and desorption coefficients when compared with painted gypsum board, and would thus be expected to reach an equilibrium condition more rapidly, have a greater impact on
reductions in airborne VOC concentrations for short-term source events, and provide for less chemical retention time on the material surface, and in indoor air, than would painted gypsum board.
An additional discussion of the role of carpet components as sinks for non-polar VOCs was presented elsewhere by the authors (Won et al., 2000). Selective results are presented herein for comparative purposes.
Effects of Chemical Properties of VOCs
For a given material, the level of sorption was observed to be extremely sensitive to chemical properties. Chemical property effects are illustrated in Figure 5, which depicts concentration profiles for eight chemicals in the presence of virgin gypsum board. The greatest amount of sorption was observed for isopropanol, presumably due to polar-polar interactions between isopropanol and gypsum board (calcium sulfate). MTBE, toluene, and tetrachloroethene exhibited only a small amount of sorption to virgin gypsum board as well as other materials.
In general, the extent of sorption to a specific material is inversely related to vapor pressure (Kephalopoulos et al., 1996; van der Wal et al., 1998; An et al., 1999). As such, correlations between vapor pressure and sorption parameters were examined in this study. Analysis of these relationships was facilitated by classifying VOCs into two groups and using the most appropriate group for each material. Significant experimental difficulty was encountered for
1,2,4-trichlorobenzene, which appeared to be sorbed to the experimental and/or analytical systems.
Thus, group A consisted of all VOCs minus 1,2,4-trichlorobenzene. Group B consisted of group A minus MTBE, cyclohexane, and isopropanol. These three chemicals exhibited little to no sorptive interaction with several test materials, and were thus omitted from group A. They were
included in group B for materials in which the extent of sorption was sufficient to back-calculate sorption parameters. Thus, groups A and B generally contain four and seven data points,
respectively.
Coefficients for the linear regression between - ln(vapor pressure) and ln(Keq) are
summarized in Figure 6. The median R2 value for all Keq analyses was 0.95. The slope of the
logarithmic relationship between Keq and vapor pressure fell within a relatively narrow range
(0.5 to 0.87 and, mostly, 0.63 to 0.87). However, values of the slope are slightly less than the value of unity derived theoretically based on fundamental thermodynamic principles and n = 1 by An et al. (1999). Figure 6 also suggests that it may be possible to group some materials. For example, carpets with padding (underlying bonded urethane cushion) appeared to exhibit a similar level of sorption. On the other hand, grouping appears less desirable for carpet itself, i.e., without an underlying cushion. The importance of bonded urethane carpet cushion as a sorptive material was discussed in detail by Won et al. (2000).
Figure 7 summarizes the results from the linear regression between - ln(vapor pressure) and ln(ka). The relationship between ka and vapor pressure was not as good as that between Keq and
vapor pressure. For several materials with low R2 for the –ln(vapor pressure)/ln(ka) relationship,
including carpet1/pad, carpet3, virgin gypsum board, painted gypsum board, and vinyl flooring, the linear regression between -ln(vapor pressure) and ln(kd) exhibited improved R2 values
(Figure 8).
A correlation was also observed between octanol-air partition coefficient (Koa) and sorption
parameters. Linear relationships between Koa (Lair/Loctanol) and Keq were obtained (Figure 9).
Values of R2 indicate a strong linear relationship between Koa and Keq. Linear regression was
exhibited a strong linear relationship between Koa and ka. The relationship between Koa and ka is
most reflective of the last step in the sorption process, i.e., reaction between chemical and material, as opposed to bulk mass transfer from air to a material or diffusion to/within the material. Interestingly, no relationship was obtained between Koa and kd, although kd can be
estimated based on Keq and ka. However, it should be emphasized that there is a large gap
between the last two data points in Figure 9, and it is recommended that additional experiments using chemicals with Koa in the range of 5,000 to 20,000 Lair/Loctanol be completed to confirm the
linear relationship between Koa and Keq.
The relationships described above indicate that it is possible to relate chemical properties to fundamental properties of the sorption process. This finding is significant in so much as it suggests the possibility of being able to reasonably model sorptive interactions for VOCs that have not been tested in laboratory chambers. However, because the relationships have not explicitly accounted for material properties, it may not be legitimate to extrapolate them to material specimens that differ significantly from those used in this study. This caveat is
particularly important for carpet due to the fact that the results described in this paper implicitly “lump” non-horizontal surface area effects into sorption parameters, and different brands of carpet can have significantly different fiber and backing areas. Nevertheless, the results suggest that carpet can serve as a major sink for VOCs, and that relationships between sorption
parameters and chemical properties are possible for specific brands of carpet, or more generally for carpet if actual surface areas are taken into account. A more detailed analysis of carpet results, including effects of carpet material differences and components was presented by Won et
Effects of Relative Humidity
With a couple of significant exceptions, relative humidity (RH) had no observable effect on sorption parameters. An example is given in Figure 11 for ethylbenzene and painted gypsum board. One exception occurred for virgin gypsum board, for which Keq generally decreased as
RH increased, particularly between RH profiles that approached 0% and 50%. For this change in RH, the decrease in Keq varied from 33% to 58% with an average of 45%. Figure 12 provides an
example for virgin gypsum board and 1,2-dichlorobenzene. It is possible that polar-polar attractions between water molecules and gypsum board reduced the sorption capacity of the gypsum board for VOCs. The maximum value of Keq was for isopropanol, a polar VOC (Keq =
7.2 m at 0% final RH; 3.6 m at 50% final RH; 3.2 m at 80% final RH). No sorption was observed for cyclohexane on virgin gypsum board for any RH, or for tetrachloroethene or ethylbenzene at 80% RH. Interestingly, there was no consistent trend between RH and either ka
or kd for any of the VOCs.
Other than for virgin gypsum board, isopropanol was the only VOC that was significantly influenced by RH. This was particularly true for carpet with padding (Figure 13), for which Keq
actually increased with increasing RH (0.68 m at 0% final RH; 1.1 m at 50% final RH; 1.4 m at 80% final RH). It is conceivable that this was due to the absorption of isopropanol into water that condensed in the pores of the urethane padding or to the carpet surface. The solubility of isopropanol is 26 times greater than that of the second most soluble target VOC (MTBE), and it has a much lower Henry's law constant than any of the other VOCs. The value of Keq for
isopropanol increased dramatically with increasing RH for painted gypsum board (0.20 m at 0% final RH to 1.4 m at 50% final RH). Sorption of isopropanol was only observed at RH = 80% for vinyl flooring and upholstery.
The findings associated with non-polar compounds agree with those reported by Colombo
et al. (1993). However, Colombo et al. (1993) concluded that the sorption of both n-decane
(non-polar) and 2-butoxyethanol (polar) on carpet was not influenced by relative humidity, the latter being in contrast to the findings of this study for isopropanol. It is not possible to ascertain why the degree of sorption of isopropanol increased with increasing relative humidity in this study, and why the same was not true for 2-butoxyethanol in the study by Colombo et al. (1993). However, in this study, the positive relationship between isopropanol sorption and relative humidity occurred for a carpet system that included an underlying carpet cushion. Colombo et
al. (1993) did not include an underlying cushion in their work. As stated above, any water
condensation in the pores of the urethane carpet cushion could enhance the removal of
isopropanol by absorption, as opposed to adsorption. This hypothesis requires additional study before it is properly addressed.
Acknowledgements
This study was funded by BP Oil and Exploration, Inc (BP). The authors thank Mr. Jim Rocco and Ms. Lesley Hay-Wilson of Sage Environmental, Inc., for their insightful comments,
enthusiasm, and patience.
References
An, Y., Zhang, J.S., Shaw, C.Y. (1999) “Measurements of VOC adsorption/desorption characteristics of typical interior building materials,” HVAC&R Research, 5, 297-316. Buckley, T. J., Prah, J. D., Ashley, D., Zweidinger, R. A., and Wallace, L. A. (1997) “Body burden measurements and models to assess inhalation exposure to methyl tertiary butyl ether (MTBE),” Journal of Waste Management Association, 47, 739-752.
Colombo A., De Bortoli, M., Knöppel, H., Pecchio, E., and Vissers, H. (1993)“Adsorption of selected volatile organic compounds on a carpet, a wall coating, and a gypsum board in a test chamber”, Indoor Air, 3, 276-282.
Dunn, J.E. and Chen, T. (1993)“Critical evaluation of the diffusion hypothesis in the theory of porous media volatile organic compound (VOC) sources and sinks”, Modeling of Indoor
Air Quality and Exposure, ASTM STP 1205, ed. N.L. Nagda, American Society for Testing
and Materials, Philadelphia, 64-80.
Jørgensen, R.B. and Bjørseth, O. (1999)”Sorption behavior of volatile organic compounds on material surfaces – The influence of combinations of compounds and materials compared to sorption of single compounds on single materials”, Environmental International, 25, 17-27.
Kephalopoulos, S., Knoeppel, H., and De Bortoli, M. (1996) “Testing of sorption and desorption of selected VOCs on/from indoor materials”, in Proceedings of the International
Conference Indoor Air Quality and Climate, Nagoya, Vol. 2, pp. 61-66.
Little, J.C. and Hodgson, A.T. (1996)“A strategy for characterizing homogeneous, diffusion-controlled, indoor sources and sinks”, Characterizing Sources of Indoor Air Pollution and
Related Sink Effects, ASTM STP 1287, ed. B.A. Tichenor, American Society for Testing
and Materials, Philadelphia, 294-304.
Lyman, W. J., Reehl, W. F. and Rosenblatt, D. H. (1982) Handbook of chemical property
estimation methods: Environmental behavior of organic compounds, McGraw-Hill.
Meininghaus, R., Salthammer, T. and Knöppel, H. (1999) “Interaction of volatile organic compounds with indoor materials – a small-scale screening method”, Atmospheric
Environment, 33, 2395-2401.
Nirmalakhandan, N. N. and Speece, R. E. (1988) “QSAR model for predicting Henry’s constant”, Environmental Science and Technology, 22, 1349-1357.
Schwarzenbach, R. P., Gschwend, P. M., and Imboden, D. M. (1993) Environmental Organic
Chemistry, John Wiley & Sons, NY.
Sparks, L.E., Tichenor, B.A., White, J.B. and Jackson, M.D. (1991)“Comparison of data from the IAQ test house with predictions of an IAQ computer model”, Indoor Air, 4, 577-592. Tichenor, B.A., Guo, Z., Dunn, J.E., Sparks, L.E. and Mason, M.A. (1991)“The interaction of
van der Wal, J.F., Hoogeveen, A.W. and van Leeuwen, L. (1998)“A quick screening method for sorption effects of volatile organic compounds on indoor materials”, Indoor Air, 8, 103-112.
Verschueren, K. (1996) Handbook of environmental data on organic chemicals, 3rd Ed., Van Nostrand Reinhold.
Won, D., Corsi, R.L., and Rynes, M. (2000) “New indoor carpet as a adsorptive reservoir for volatile organic compounds”, Environ. Sci. Technol., 34, 4193-4198.
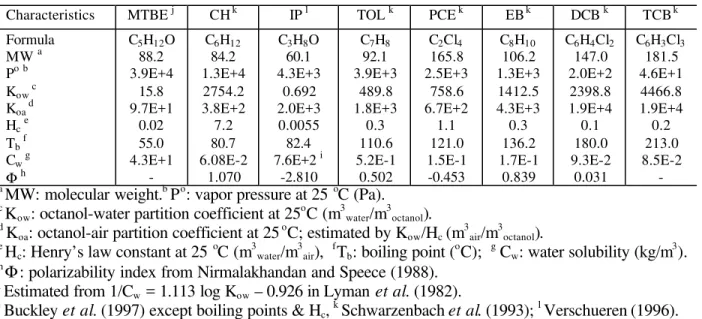
Table 1. Physico-chemical Properties of Surrogate Chemicals
Characteristics MTBE j CH k IP l TOL k PCE k EB k DCB k TCB k
Formula MW a Pob Kow c Koa d Hce Tb f Cw g Φh C5H12O 88.2 3.9E+4 15.8 9.7E+1 0.02 55.0 4.3E+1 -C6H12 84.2 1.3E+4 2754.2 3.8E+2 7.2 80.7 6.08E-2 1.070 C3H8O 60.1 4.3E+3 0.692 2.0E+3 0.0055 82.4 7.6E+2 i -2.810 C7H8 92.1 3.9E+3 489.8 1.8E+3 0.3 110.6 5.2E-1 0.502 C2Cl4 165.8 2.5E+3 758.6 6.7E+2 1.1 121.0 1.5E-1 -0.453 C8H10 106.2 1.3E+3 1412.5 4.3E+3 0.3 136.2 1.7E-1 0.839 C6H4Cl2 147.0 2.0E+2 2398.8 1.9E+4 0.1 180.0 9.3E-2 0.031 C6H3Cl3 181.5 4.6E+1 4466.8 1.9E+4 0.2 213.0 8.5E-2 -a
MW: molecular weight.b Po: vapor pressure at 25 oC (Pa).
c
Kow: octanol-water partition coefficient at 25 o
C (m3water/m 3
octanol). d
Koa: octanol-air partition coefficient at 25 o C; estimated by Kow/Hc (m 3 air/m 3 octanol). e
Hc: Henry’s law constant at 25 o C (m3water/m 3 air), f Tb: boiling point ( o C); g Cw: water solubility (kg/m 3 ). h Φ
: polarizability index from Nirmalakhandan and Speece (1988).
i
Estimated from 1/Cw = 1.113 log Kow – 0.926 in Lyman et al. (1982). j
Buckley et al. (1997) except boiling points & Hc, k
Table 2. Summary of Average Adsorption and Desorption Coefficients (ka / kd)
Chemical
Mater-ial ne MTBE CH IP TOL PCE EB DCB TCB
Cp1 9 ns ns - 0.11 / 0.56 0.17 / 0.47 0.30 / 0.62 0.52 / 0.25 0.58 / 0.10 Cp2 2 nc nc - 0.26 / 0.44 0.31 / 0.32 0.41 / 0.34 0.80 / 0.17 0.91 / 0.13 Cp3 1 nc ns - 0.18 / 0.65 0.16 / 0.42 0.17 / 0.37 0.43 / 0.21 0.49 / 0.16 Cp1.p 10 0.76 / 4.9 0.39 / 1.7 0.75 / 1.1 0.49 / 0.29 0.44 / 0.25 0.48 / 0.15 0.60 / 0.08 1.5 / 0.46 Cp2.p 2 0.10 / 0.45 0.10 / 0.67 0.36 / 1.2 0.42 / 0.23 0.45 / 0.22 0.49 / 0.15 0.96 / 0.15 2.1 / 0.36 Cp3.p 2 0.10 / 0.69 0.10 / 0.60 0.27 / 0.47 0.23 / 0.16 0.23 / 0.17 0.29 / 0.14 0.62 / 0.13 1.4 / 0.42 G.v 5 0.46 / 1.6 ns 0.79 / 0.11 0.21 / 1.7 0.12 / 1.1 0.21 / 0.87 0.54 / 0.49 0.68 / 0.32 G.p 4 0.07 / 0.12 0.01 / 0.18 0.08 / 0.24 0.10 / 0.60 0.06 / 0.45 0.07 / 0.27 0.26/ 0.25 0.50 / 0.29 G.wp 1 nc ns - 0.04 / 0.12 0.09 / 0.50 0.11 / 0.19 0.54 / 0.24 1.1 / 0.28 FL.v 3 ns ns nc 0.09 / 0.66 0.07 / 0.39 0.06 / 0.22 0.23 / 0.13 0.53 / 0.17 FL.w 1 nc ns nc ns ns 0.01 / 0.01 0.09 / 0.74 0.09 / 0.60 Uphol 4 ns ns nc ns ns ns 2.0 / 10 1.8 / 3.2 Ceil 2 0.01 / 0.34 ns nc 0.01 / 0.03 0.01 / 0.17 0.09 / 1.0 0.48 / 0.73 0.63 / 0.52 SS.fg 4 ns ns nc ns ns ns ns 2.2 / 7.8 App 1 ns ns nc 0.02 / 0.18 0.01 / 0.05 0.07 / 0.72 0.32 / 0.62 4.8 / 3.8
ka in m/h. kd in 1/h. Values are averages of "ne" experiments. "ns" = no sorption. " nc" = little sorption with
indeterminate sorption parameters (no convergence). "-" = failure of quality assurance protocols relative to variations in inlet concentrations. CpX = carpet X. CpX.p = carpet X with padding. G.v = virgin gypsum board. G.p = painted gypsum board. G.wp = wallpapered gypsum board. FL.v = vinyl flooring. FL.w = wood flooring. Uphol = upholstery. Ceil = ceiling (acoustic) tile. SS.fg = fiberglass shower stall. App = apples.
Table 3. Summary of Equilibrium Partition Coefficients (Keq) (Average ± Standard Deviation)
Chemical
Material ne MTBE CH IP TOL PCE EB DCB TCB
Cp1 9 ns ns - 0.22 ± 0.07 0.36 ± 0.09 0.46 ± 0.13 2.1 ± 1.5 5.9 Cp2 2 nc nc - 0.6 ± 0.02 0.97 ± 0.002 1.2 ± 0.05 4.7 ± 0.3 7.8 ± 3 Cp3 1 nc ns - 0.28 0.38 0.46 2.0 3.1 Cp1.p 10 0.15 ± 0.03 0.24 ± 0.05 0.78 ± 0.2 1.7 ± 0.18 1.76 ± 0.2 3.3 ± 0.4 8.0 ± 3 4.9 ± 3 Cp2.p 2 0.22 ± 0.04 0.15 ± 0.02 0.29 ± 0.03 1.9 ± 0.1 2.1 ± 0.1 3.4 ± 0.4 6.6 ± 0.5 6.1 ± 0.8 Cp3.p 2 0.14 ± 0.01 0.16 ± 0.01 0.57 ± 0.06 1.5 ± 0.1 1.4 ± 0.08 2.1 ± 0.07 4.9 ± 0.8 3.5 ± 0.5 G.v 5 0.35 ± 0.2 ns 7.2 0.12 ± 0.04 0.2 ± 0.09 0.27 ± 0.09 1.2 ± 0.5 2.4 ± 0.7 G.p 4 0.45 0.054 ± 0.02 0.20 0.18 ± 0.04 0.18 ± 0.1 0.28 ± 0.03 1.0 ± 0.4 1.8 ± 0.4 G.wp 1 nc ns - 0.34 0.17 0.58 2.3 3.9 FL.v 3 ns ns nc 0.14 ± 0.01 0.19 ± 0.05 0.58 ± 0.5 1.8 ± 0.7 3.5 ± 0.1 FL.w 1 nc ns nc ns ns 0.63 0.13 0.15 Uphol 4 ns ns nc ns ns ns 0.19 ± 0.0 0.55 ± 0.05 Ceil. 2 0.06 ns nc 0.25 0.088 ± 0.1 0.10 ± 0.01 0.68 ± 0.1 1.2 ± 0.1 SS.fg 4 ns ns nc ns ns ns ns 0.33 ± 0.15 App 1 ns ns nc 0.061 0.12 0.10 0.52 1.3
Keq in m. Values are averages of "ne" experiments. "ns" = no sorption. " nc" = little sorption with indeterminate sorption parameters (no
convergence). "-" = failure of quality assurance protocols relative to variations in inlet concentrations. CpX = carpet X. CpX.p = carpet X with padding. G.v = virgin gypsum board. G.p = painted gypsum board. G.wp = wallpapered gypsum board. FL.v = vinyl flooring. FL.w = wood flooring. Uphol = upholstery. Ceil = ceiling (acoustic) tile. SS.fg = fiberglass shower stall. App = apples.
Figure Captions:
Figure 1. Major Components of Experimental System
Figure 2. Example Concentration Profiles (tetrachloroethene)
Figure 3. Effects of Materials on Sorption (1,2-dichlorobenzene)
Figure 4. Effects of Materials on Sorption (isopropanol)
Figure 5. Effects of Chemical Properties on Sorption (virgin gypsum board)
Figure 6. Linear Relationship between - ln(vapor pressure) and ln(Keq) (Keq = m; vapor
pressure = Pa)
Figure 7. Linear Relationship between - ln(vapor pressure) and ln(Keq) (ka = m/h; vapor
pressure = Pa)
Figure 8. Linear Relationship between - ln(vapor pressure) and ln(kd) (kd = 1/h; vapor
pressure = Pa)
Figure 9. Linear Relationship between Octanol-air partition coefficient (Koa) and Keq (Keq
Figure 10. Linear Relationship between Octanol-air partition coefficient (Koa) and ka (ka =
m/h; Koa = m3air/m3octanol)
Figure 11. Effects of Relative Humidity on Sorption (ethylbenzene and painted gypsum board)
Figure 12. Effects of Relative Humidity on Sorption (1,2-dichlorobenzene and virgin gypsum board)
Inflow(air+chem) Air flow Outflow (air+chem) Chemical injection Tee or manifold manifold Position valve Flow controller
Metering valve Pressure relief valve Toggle valve
Air-actuated valve Syringe Pump Chamber 1 Chamber 2 Chamber 4 Chamber 3 GC/FID Computer Gas Purifier Humidifier Regulator air
0.0 0.2 0.4 0.6 0.8 1.0 0 4 8 12 16 20 Time (h) C/C in
Reference (measured) Reference (predicted)
0.0 0.2 0.4 0.6 0.8 1.0 0 2 4 6 8 10 Time (h) C/C in Cp1.p Cp2.p Cp3.p Cp1 Cp2 Cp3 FL.v FL.w G.v G.p G.wp Ceil. Uphol SS.fg App Reference
0.0 0.2 0.4 0.6 0.8 1.0 0 2 4 6 8 10 Time (h) C/C in Cp1.p Cp2.p Cp3.p G.v G.p Reference
0.0 0.2 0.4 0.6 0.8 1.0 0 2 4 6 8 10 Time (h) C/C in
MTBE CH IP TOL PCE
-3 -2 -1 0 1 2 3 -13 -12 -11 -10 -9 -8 -7 -6 -5 - ln (Vapor Pressure) ln (k eq )
1: carpet 1/padding 2: carpet 2/padding 3: carpet 3/padding 4: carpet 1 5: carpet 2 6: carpet 3
7: virgin gypsum board 8: painted gypsum board 9: wall-papered gypsum board 10: vinyl flooring 11: ceiling tile 12: apples
1: y = 0.82x + 6.75 ( R2 = 0.94) 2: y = 0.78x + 6.31 ( R2 = 0.76) 3: y = 0.75x + 5.91 ( R2 = 0.89) 4: y = 0.74x + 4.61 ( R2 = 0.99) 5: y = 0.67x + 5.05 ( R2 = 0.99) 6: y = 0.67x + 4.19 ( R2 = 0.98) 7: y = 0.63x + 4.18 ( R2 = 0.99) 8: y = 0.63x + 3.32 ( R2 = 0.98) 9: y = 0.76x + 4.81 ( R2 = 0.85) 10: y = 0.87x + 5.31 ( R2 = 0.96) 11: y = 0.50x + 1.93 ( R2 = 0.47) 12: y = 0.67x + 2.82 ( R2 = 0.92) 1 2 3 5 4, 6, 9 10 7 8 11 12
-6 -5 -4 -3 -2 -1 0 1 -13 -12 -11 -10 -9 -8 -7 -6 -5 - ln (Vapor Pressure) ln (k a )
1: carpet 1/padding 2: carpet 2/padding 3: carpet 3/padding 4: carpet 1 5: carpet 2 6: carpet 3
7: virgin gypsum board 8: painted gypsum board 9: wall-papered gypsum board 10: vinyl flooring 11: ceiling tile 12: apples
1: y =-0.02x - 0.77 ( R2 = 0.01) 2: y = 0.47x + 2.67 ( R2 = 0.87) 3: y = 0.37x + 1.49 ( R2 = 0.91) 4: y = 0.50x + 2.08 ( R2 = 0.91) 5: y = 0.38x + 1.77 ( R2 = 1.00) 6: y = 0.33x + 0.79 ( R2 = 0.85) 7: y = 0.42x + 1.52 ( R2 = 0.76) 8: y = 0.41x + 0.69 ( R2 = 0.71) 9: y = 0.81x + 3.69 ( R2 = 0.97) 10: y = 0.38x + 0.39 ( R2 = 0.68) 11: y = 1.52x + 7.58 ( R2 = 0.90) 12: y = 1.28x + 5.78 ( R2 = 0.86) 1 2 3 5 12 4 8 7 6 9 11 10
-6 -5 -4 -3 -2 -1 0 1 2 -11 -10 -9 -8 -7 -6 -5 - ln (Vapor Pressure) ln (k d )
1: carpet 1/padding 6: carpet 3 7: virgin gypsum board 8: painted gypsum board 10: vinyl flooring
1: y = -0.82x - 7.33 ( R2 = 0.88) 6: y = -0.34x - 3.40 ( R2 = 0.93) 7: y = -0.38x - 2.77 ( R2 = 0.95) 8: y = -0.27x - 2.96 ( R2 = 0.73) 10: y = -0.49x - 4.75 ( R2 = 0.87) 1 7 6 8 10
0 2 4 6 8 10 0 5000 10000 15000 20000 Koa Keq
1: carpet 1/padding 2: carpet 2/padding 3: carpet 3/padding 4: carpet 1 5: carpet 2 6: carpet 3
7: virgin gypsum board 8: painted gypsum board 9: wall-papered gypsum board 10: vinyl flooring 11: ceiling tile 12: apples
1: y = 4E-4x + 0.67 ( R2 = 0.94), 2: y = 3E-4x + 0.81 ( R2 = 0.84) 3: y = 2E-4x + 0.59 ( R2 = 0.90), 4: y = 1E-4x + 0.12 ( R2 = 0.98) 5: y = 2E-4x + 0.44 ( R2 = 0.98), 6: y = 1E-4x + 0.16 ( R2 = 0.98) 7: y = 6E-5x + 0.066 ( R2 = 0.98), 8: y = 5E-5x + 0.10 ( R2 = 0.99) 9: y = 1E-4x + 0.11 ( R2 = 1.00), 10: y = 9E-5x + 0.0092 ( R2 = 0.99) 11: y = 3E-5x + 0.083 ( R2 = 0.88), 12: y = 2E-5x + 0.039 ( R2 = 0.95) 9 4, 6 10 7, 8 11 12 1 2 3 5
0.0 0.3 0.6 0.9 1.2 0 5000 10000 15000 20000 Koa ka
1: carpet 1/padding 2: carpet 2/padding 3: carpet 3/padding 4: carpet 1 5: carpet 2 6: carpet 3
7: virgin gypsum board 8: painted gypsum board 9: wall-papered gypsum board 10: vinyl flooring 11: ceiling tile 12: apples
1: y = 2E-6x + 0.55 ( R2 = 0.011) 2: y = 4E-5x + 0.26 ( R2 = 0.80) 3: y = 2E-5x + 0.16 ( R2 = 0.91), 4: y = 2E-5x + 0.14 ( R2 = 0.90) 5: y = 3E-5x + 0.26 ( R2 = 0.98), 6: y = 2E-5x + 0.14 ( R2 = 0.97) 7: y = 2E-5x + 0.13 ( R2 = 0.98), 8: y = 1E-5x + 0.055 ( R2 = 0.95) 9: y = 3E-5x + 0.021 ( R2 = 0.98), 10: y = 9E-6x + 0.054 ( R2 = 0.93) 11: y = 3E-5x - 0.024 ( R2 = 1.00), 12: y = 2E-5x - 0.011 ( R2 = 1.00) 2 5 3 1 4, 7, 9 11 6 12 8 10
0.0 0.2 0.4 0.6 0.8 1.0 0 2 4 6 8 10 Time (h) C/C in 0% 50% 80% Reference
0.0 0.2 0.4 0.6 0.8 1.0 0 2 4 6 8 10 Time (h) C/C in 0% 50% 80% Reference
0.0 0.2 0.4 0.6 0.8 1.0 0 2 4 6 8 10 Time (h) C/C in 0% 50% 80% Reference