Analysis of Predictive Sorting and Process
Standardization at Amazon.com
by Rob Jackson
B.S., Manufacturing Engineering, Brigham Young University, 2006 Submitted to the MIT Department of Engineering Systems and to
the Sloan School of Management
in partial fulfillment of the requirements for the degrees of Master of Science in Engineering Systems
and
Master of Business Administration
In conjunction with the Leaders for Global Operations Program at the Massachusetts Institute of Technology
June, 2011
© 2011 Massachusetts Institute of Technology. All Rights Reserved.
ARCHIVES
MASSACHUS~fTS lNSTITUTE OF TECHNOLOGYJUN 152011
LIBRARIES
Signature of Authorwpanment ot Engineering Systems Sloan School of Management Certified by___
RQ Welsch, Thesis Supervisor Professor of Statistics and Management Science and Engineering Systems Certified by
n, V I -,
DanieM~hitney, ThesiSupervisor ng and Engineering Systems Accepted by
Accepted by
Nafiy Leveson, Chair, Engineering Systems Division Education Committee
Professor. Aeronautics and A strnantie' -rnd Fnoineering Systems Division
Debbie Berechman, Executive Director of MBA Program MIT Sloan School of Management
Analysis of Predictive Sorting and Process
Standardization at Amazon.com
by
Rob Jackson
Submitted to the MIT Department of Engineering Systems and to the Sloan School of Management on May 6, 2011 in Partial Fulfillment of the Requirements for the Degrees of Master of Science in
Engineering Systems and Master of Business Administration Abstract
In any process, complexity has the potential to decrease processing rates of the operation. Mass production has driven up operator efficiency by removing complexity to create a standardized and
simplified process. However, removing complexity from a process reduces the operator's ability to customize their products and remain flexible to variations in demand. Businesses need to decide the
appropriate level of process standardization that allows their operators to work as efficiently as possible while remaining flexible enough to satisfy customer demand.
The goal of this research is to analyze the standardization of the least efficient process in an outbound order fulfillment system at Amazon.com. Various tests were performed during a six-month internship
at Amazon's Lexington, KY facility to determine if this process could benefit from standardization. The testing showed that Amazon's processes must maintain a high level of flexibility to satisfy the variations in customer demand and the diverse mix of products that they ship. This research ends with a proposed process improvement that will improve the efficiency of the baseline scenario while providing flexibility to handle variation in order flow. During the internship, the per-order cycle time at the packing operation has been reduced by 9.7% and another improvement was tested which reduced cycle times by 10.9% when implemented. When the final improvement is implemented the total cycle time reduction will be 20.6%.
Thesis Supervisor: Roy Welsch
Title: Professor of Statistics and Management Science and Engineering Systems Thesis Supervisor: Daniel Whitney
Acknowledgements
I would like to express my gratitude to all who contributed to the success of both this internship and my time with MIT's Leaders for Global Operations Program. The last two years, and in particular my time with Amazon, was an invaluable learning experience that I will take with me throughout the remainder of my career.
I wish to acknowledge the staff and faculty of the LGO Program, for helping to foster a truly unique and special learning environment.
I was very pleased in my choices for thesis advisors, Professors Roy Welsch and Daniel Whitney. They both provided support and insight as I tried to apply my learning from the classroom in a real world environment. They always took time out of their very busy schedules to guide me when required, and both displayed a genuine interest and motivation towards helping me drive towards providing Amazon with the deliverables they expected. Both were invaluable assets to MIT, and the LGO Program is fortunate to have access to such knowledgeable and professional academics. The staff and management at Amazon's Lexington Fulfillment Center were an absolutely amazing group of people to work with. Chris Buzard dedicated a great deal of time and effort towards helping me drive change and improve the System X system. Akash Chauhan was invaluable in providing
prospective and support to accomplish my goals. My gratitude also goes out to Kevin Kirves for taking me under his wing and making sure things inside and outside of the factory were going well. I have to thank my classmates. They are incredible friends and the most amazing group of people I have ever had the pleasure of working with. These last 2 years have not been easy and I have faced significant challenges. Completing this program is largely a result of the examples and constant support that I've received from these incredible friends.
Table of Contents
Ab stract ... 3
Acknow ledgem ents... 5
Table of Contents ... 6
Table of Figures ... 7
List of Tables... 8
Chapter 1: Introduction and Overview ... 9
1.1 Com pany Overview ... 9
1.2 Current State... 10
1.3 Problem Statem ent ... 10
1.4 Thesis Overview ... 11
Chapter 2: Fulfillm ent Center Operations Overview ... 12
2.1 The Am azon Distribution System ... 12
2.2 Overview of Outbound Shipping Processes... 12
2.3 System X ... 13
2.4 Strategic Overview of System X ... 15
Chapter 3: Literature Review ... 16
Effects of Process Standardization... 16
Order Packing System s... 16
Chapter Summ ary... 17
Chapter 4: Analysis of Order Variations in System X ... 18
4.1 Baseline observations... 18
4.2 Inefficiencies in Pack Process... 19
4.3 Hypothesis of Pack Process Im provem ents ... 19
4.4 Definition of Success for Hypothesis Test... 20
Chapter 5: Design of Standardized Packing Station Test... 21
5.1 Concept Validation - Singles W all... 21
5.1.1 Single Item Order Data Analysis ... 21
5.1.2 Design of Single Pack Station... 23
5.1.3 Expected Outcom e of Single Item Pack Station... 24
5.1.4 Observed Outcom e of Single Item Pack Station... 25
5.2 Concept Expansion - M ulti-box Singles Item Pack Station ... 27
5.2.1 Design of M ulti-box Single Item Pack Station ... 27
5.2.2 Observed Outcome of M ulti-box Single Item Pack Station... 28
5.3 Design of Full Standardized Pack Station Test... 29
5.3.1 Peak Box Usage Analysis ... 31
5.3.2 Peak Box Usage Analysis ... 32
5.3.3 Fill Priority Improvements... 33
5.3.4 Color-coding Pack Station ... 33
Chapter Summary... 34
Chapter 6: Trial of Specialized Pack Station ... 35
6.1 Analysis of Results from Standardized Pack Station Trial... 35
6.1.1 Initial Reaction from Operators... 35
6.1.2 Initial Reaction from M anagers... 36
6.1.3 General Observations... 36
6.2 Order Variation during Standardized Test Station... 36
6.3 Sorter Divert Variation during Order Variation... 37
Chapter Summ ary... 38
Chapter 7: Recommendations for Future Designs ... 39
7.1.1 Creation of a New Chute Size Category ... 39
7.1.2 Specialization of All Pack Chutes... 40
7.1.3 Designated Chute Quantities... 41
7.1.4 FC Console Sort Tool by Box Size... 41
Chapter 8: Conclusion... 42
Bibliography... 43
Table of Figures Figure 1: Rate imbalance between processes in System X ... 11
Figure 2: Pack process decision tree... 18
Figure 3: Baseline cycle time study of the pack process... 19
Figure 4: Future state decision tree with decision points removed... 20
Figure 5: Average daily consumption of each box size in System X ... 22
Figure 7: Specialization of pack station shelf during first test... 24
Figure 8: Specialization of pack station shelf during second test ... 28
Figure 9: Hourly orders shipped on the designated and undesignated pack stations... 30
Figure 10: Correlation of the designated and undesignated pack stations... 30
Figure 11: Hourly box usage by box size during peak demand... 31
Figure 12: Abnormal demand behavior during peak demand... 32
Figure 13: Pack station design used on 8 pack stations during third test... 32
Figure 15: Pack station prior to standardization ... 34
Figure 16: Pack station after standardization, showing the visuals for each box size ... 34
Figure 17: Hourly diverts on sorter to the 18 rebin stations ... 35
Figure 18: Variation in box usage in System X over two months ... 37
Figure 19: Imbalance in diverts between specialized and unspecialized pack stations ... 38
Figure 20: Current utilization of chute volume with size A box... 39
Figure 21: Future state utilization of chute volume with size A box... 40
Figure 22: Recommended configuration for front shelf on each station ... 40
Figure 23: Recommended configuration for back walls that are used for order overflow ... 41
List of Tables
Table 1: Standard process staffing under different demand scenarios...14Table 2: Expected work rates for each process in System X ... 23
Table 3: Historical usage data by box size and units ... 29
Chapter 1: Introduction and Overview
This thesis deals with increasing the efficiency of an Amazon.com order fulfillment system in Lexington, KY (LEX 1). The fulfillment system comprises the processes by which Amazon.com collects, packages, and prepares customer orders for shipment inside a distribution center. This fulfillment system requires flexibility and responsiveness to handle the broad mix of products that Amazon ships. The primary focus of the internship was how to reduce the cycle time per order of the most labor-intensive process in Amazon's fulfillment system (System X) order processing system. The research and improvements implemented explored standardization of processes to reduce waste. Before discussing the specifics of the internship, it is important to familiarize the reader with the background of the company and its business practices. This introductory information will be helpful in understanding the scope and purpose of the internship. The next pages will provide a background of the company and the current state of their business as an introduction to my internship.
1.1 Company Overview
Amazon.com began selling books online in 1995 as internet commerce businesses were racing to enter this exciting new retail space. Jeff Bezos, the company's founder, shipped books from his garage. Amazon has always strived to minimize costs and increase the variety of products they sell. This legacy of frugality and independence is still a central part of the company's culture. Low cost and high product variety has allowed Amazon to satisfy a wide variety of customers. With the millions of customers who use their site, Amazon strives to be "the world's most customer centric company" which pushes them to bend over backwards to satisfy customer needs'. Over time Amazon.com has expanded its product offerings to include electronics, apparel, toys, and kitchen equipment.
The company has its foundings as a web retail business which has led them to develop strong operational skills to ship their products as well as technology expertise to run their website. Using these two core skills, Amazon has experienced significant growth as they exceed customers'
expectation of the retail experience. Amazon has created a website for customers to find almost anything and have the confidence that it will arrive at their front door quickly and safely.
1.2 Current State
The success of Amazon's market penetration has been based on providing a positive customer
experience that centers on low prices, vast selection, and fast, convenient delivery (Szkutak 2009). To achieve this positive customer experience, Amazon has had to continuously improve the operational efficiency while processing and increasing the variety of products.
Amazon has developed new fulfillment processes to sort, package and ship this increasing variety of products at low cost. The new sortation system at the Lexington, KY fulfillment center (LEX 1) has been a new development in providing a flexible and efficient process for shipping this increased variety of products. Throughout this paper, the sortation system will be referred to as System X. This process must be able to handle products that range in size and weight as well as varying quantities of products as customer demand fluctuates. Amazon.com experiences seasonal order fluctuation with order volumes in the 4' quarter consistently higher. In 2010, 2009, and 2008, Amazon recognized 38%,
39%, and 35% of annual revenue during the fourth quarter (Amazon.com 2010). System X must have the capacity to handle the high order volumes during their peak holiday season and not just the baseline demand during the off-peak season.
1.3 Problem Statement
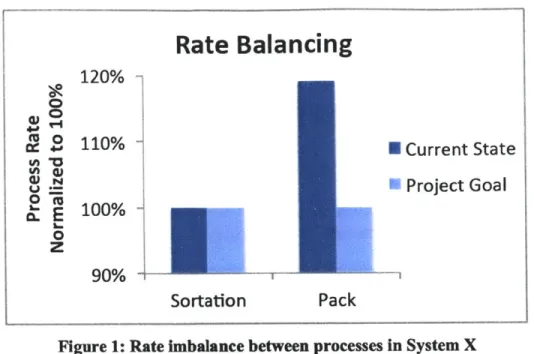
As Amazon's sales continue to grow along with the variety of products, the System X sortation system must increase capacity and processing versatility. The packing operation in System X has consistently been the most labor-intensive process, which increases the processing cost per order. The detailed description of this process and System X system can be found in Chapter 2. After performing a time study of operators in the sortation and packing operations, it was found that each packer operated at a unit per hour rate that was 20% slower than the upstream sorter. This imbalance between the sorting and packing operations is shown in Figure 1 below as well as the goal of the
Rate Balancing
120% -0 11-0% 00CC Current State W Project Goal SE 100% -0 90% Sortation PackFigure 1: Rate Imbalance between processes in System X
During the peak demand period the pack process becomes even less efficient and creates a larger labor imbalance across System X. Before Amazon can implement System X across further fulfillment centers, the inefficiencies of the beta test system should be resolved. It was the purpose of my
internship to analyze the pack process in System X and develop process improvements to increase capacity and processing costs.
1.4 Thesis Overview
The thesis begins with the company background and a description of the retail fulfillment operations in Chapter 2. After providing a framework of the company, Chapter 3 provides relevant research of similar processes and solutions that have been published. This research helps guide the topics explored in this paper. Chapters 4 through 6 describe the evolution of process improvements in an
effort to test the hypothesis that standardization of the pack process will increase overall efficiency. The iterations in process improvements had successes and failures that contributed to the final recommendation that was proposed in Chapter 7. In Chapter 7 all the learnings from testing are combined into a recommended design for future processes similar to System X at the Lexington facility. The conclusions to the thesis are summarized in Chapter 8. During this chapter, the key learning's from this project and the results of the hypothesis testing.
Chapter 2: Fulfillment Center Operations Overview
This section will briefly describe the operations in an Amazon order fulfillment center. Since the primary focus of the internship was on the outbound operations, the majority of the description will be on those processes.
2.1 The Amazon Distribution System
Amazon has a network of fulfillment centers that are strategically placed across the globe. The location of these sites is chosen to optimize the speed of delivery to the most customers while maintaining a low labor cost. The standard fulfillment center is made up of 2 major processes,
inbound and outbound. The inbound operations receive product from suppliers, unpackage the items, and then stow the individual items on the inventory shelves. The outbound operations include the picking of orders from the shelves, sorting the items into complete orders, packaging them into boxes, and applying a shipping label. The internship focused on an outbound operation at the Lexington, Kentucky site.
2.2 Overview of Outbound Shipping Processes
Amazon fulfillment centers hold and ship most of the inventory that they sell. The building is connected with a network of conveyors that bring the items from the inventory holding areas to the shipping area.
Outbound processes begin with the computer systems communicating to "pickers" which items need to be pulled from the shelves and sent to the shipping area. The picking of items is a complex
decision that tries to level the flow of work into the shipping area and provide the most efficient picking path so workers don't waste time walking through the inventory area.
LEXI has 5 primary processes for sorting, packing and shipping orders which are:
1. Process A- an automated process that is used to ship CD's and DVD's using an automatic boxing machine
2. Process B- a manual process for manually processing orders that are too large for any of the other processes
3. Process C- a semi-automated process that shrink wraps orders onto a foot print and places it automatically into one size box
4. Process D- a semi-automated process that shrink wraps orders onto a foot print and the packers manually insert the footprint into one of 3 box sizes
5. System X- an automated sorter that divides individual items into complete orders which are then manually packaged
As containers of items arrive from the picking area, the container's barcode is scanned and identifies which process the container should be diverted to. Which process the containers are sent to is
determined by the size, shape, quantity, and weight of the items in the order as well as the capacity of work that management has decided to receive in each process. The focus of this paper will be on Amazon's newest beta-process called that is called System X throughout this paper.
2.3 System X
In 2007, LEXI became the first fulfillment center in the Amazon network to install a series of manual processes interconnected with sorters and conveyors designed to balance work across stations. This
system was a breakthrough that created the flexibility to process a large variety of orders with
efficiency and speed. There are 5 major processes in System X where manual labor is performed. The following section will describe these 5 steps of product flow through System X. The description of the 5 processes within System X is given below.
Product flow through System X
1. Individual items are picked from inventory, put into green totes, and sent to System X on conveyors. This new system can process a mixture of items that is 30X greater than the traditional process. This flexibility has to do with the downstream sorting processes and the flexibility System X creates.
2. Totes arrive at the Induct station in System X. At this station an operator removes a single item from the green tote, scans the item, and then places I item in one orange tote. This operation begins the sorting process by telling the computer system that each orange tote (identified with a unique bar code) contains a specific item and which order it belongs to. The orange tote then moves along a horizontal sorting conveyor until the computer system
physically "kicks-out" the orange tote to 1 of N rebin stations. In this way, the computer and mechanical conveyor are sorting the items into complete customer orders.
3. At the rebin station, an operator picks up the item from the orange tote and places it into a shelf that is divided into Z individual bins. The computer system uses a light system to indicate which bin the item should be placed into to complete the order. Once all the items for an order have arrived in the bin, a light flashes and indicates that an order is complete and the operator should push the order through to the packer on the other side of the shelf. 4. Once a complete order is pushed to the pack station a light indicates that an order is
complete and ready to pack. The pack associate scans the barcode on the bin, verifies that the order is complete, chooses a box of the appropriate size, and places the items into a
shipping box. The open box is placed onto a conveyor into that leads into the shipping label and quality check area.
5. In shipping area, open boxes arrive and operators insert a receipt, tape the box shut, weigh the order to insure accuracy and apply a shipping label. The completed order is then
transported to the shipping dock where it is loaded onto a truck.
In addition to these core process steps, a box delivery system provides all the pre-assembled boxes to packers. The boxes were delivered on a hanging trolley system that is loaded with boxes and passes
in front of packers who remove the required boxes as they pass by.
Process managers need to carefully monitor and balance the labor pool within System X to ensure no backups begin to block workflow or starve downstream operations. Managers have different staffing models depending on the quantity of work flowing through System X. Table 1 shows the number of operators that are typically used in each of the N interconnected stations under different demand
scenarios. This illustrates the extra labor required to staff the pack stations. If managers fail to add extra labor to the pack station, completed orders will fill up the rebin shelves and System X's capacity is limited.
Table 1: Standard process staffing under different demand scenarios
Induct Rebin Pack
Standard Demand
0.5
1
1.25Heavy Demand 0.5 q 1 2
Peak Seasonal Demand 1 1 2 4
2.4 Strategic Overview of System X
System X is a flow system in which each process is connected to both the upstream and downstream processes. There is very little inventory between operations and the rate of one operator depends on both the inflow of work and the space to flow work out. This interdependence has key strategic benefits for Amazon. Since there are so few places for inventory to accumulate, work can flow very quickly from the picking area to the shipping dock. The design of the rebin shelves also allows for a wide variety of item sizes and quantities when compared to the legacy processes.
The flexibility and high capacity of the system has led Amazon to consider implementing System X into new fulfillment centers as they continue to expand. This internship will present
Chapter 3: Literature Review
This chapter contains a review of other research papers that have studied the following topics: 1. The effects of process standardization - review of benefits and limitations of process changes
towards a simplified and standardized process
2. Order packing systems in fulfillment centers - benchmark other best practices for sorting and packaging orders
Effects of Process Standardization
Fredrick Taylor did one of the first studies of process standardization in his article The Principles of Scientific Management (Taylor, 1911). The paper demonstrated the efficiency improvements that can be gained by carefully defining the best production practices for a process. Henry Ford was forced to standardize the products he delivered so that he could use unskilled workers on a repetitive
production line (Tolliday, 1987). At the time a standardized product was acceptable because of the price discount that was created. As customers demand more customized products, the method used by Ford has fallen out of favor and been replaced by standardized processes that allow for flexibility. Liker described these flexible processes in his study of the Toyota Production System (Liker, 2004). De Meyer (1989) describes flexibility in a manufacturing process as the 'next competitive battle' for businesses. Similarly, Koste (1999) states that businesses that produce using standardized processes and products can not compete with customers 'demanding a greater variety of high quality, low-cost goods and services'. De Toni (1998) described the paradox between standardized, rigid processes and flexible processes when he said, "an organization must possess some procedures which enhance its flexibility in order to avoid becoming rigid, but it must also be anchored in some way in order to avoid chaos." It was precisely this balance between efficient standardized process and a flexible process that I was involved with defining during my internship.
Order Packing Systems
It is also worth reviewing the research behind the best practices in the retail order fulfillment businesses. This is done in an effort to identify the lessons learned by other businesses in web retail fulfillment. Immediately installing automated order fulfillment systems was a warning that was made by Trew (1995). Businesses need time to learn from their process and experience variation before investing in automation that may need to be changed. He argues, "only after the information and
warehouse processes are controlled and accurate should you augment the system with additional mechanized equipment." Geoff (1999) discusses how Tesco could only automate up to a point because they needed flexibility to process varying quantities of orders. A highly automated system that ships online shoe orders is possible because of the highly consistent shape of the boxes that the boxes are shipped in (Witt 2005). One business that was trying to increase order volumes added
smarter software logic that sorted the orders before arriving at the packing stations, which drastically increased packing efficiency (Witt 2008).
Chapter Summary
This chapter has evaluated the available research on standardized process. The evolution in defmed processes has drastically increased company's ability to efficiently produce products at lower costs. Businesses should carefully consider the amount of standardization and automation that they incorporate into their processes. Creative solutions exist that increase the amount of standardization while allowing the process to remain flexible and responsive to customer demand.
Chapter 4: Analysis of Order Variations in System X
4.1 Baseline observations
The first month of the internship at LEXI included heavy data collection and process observations. It was during this time that the current state of the process was clearly documented. The initial data collection involved both quantitative review of System X as well as qualitative information gathering from line workers and managers. Since the primary goal of the project was to focus on the pack operations, the data presented here relates primarily to that process.
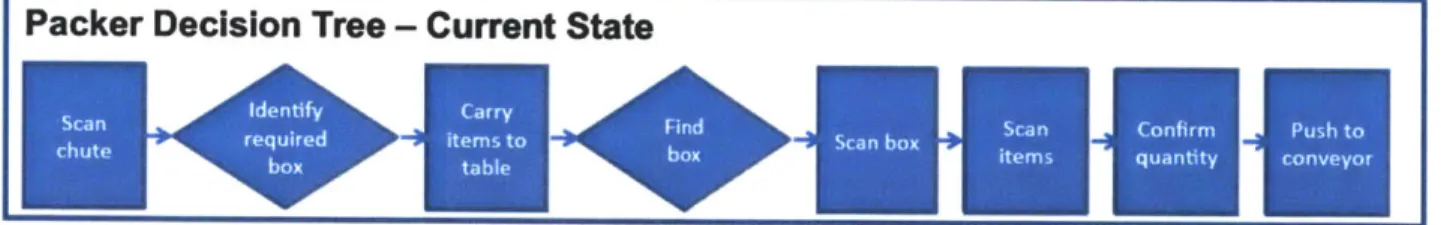
The key steps in the packing operation in System X are represented in Figure 2, which is a decision tree of a standard packers process. The flow chart uses squares for standardized and repetitive
motions. The diamonds in the chart represent decision points in the process where the operator has to evaluate the individual order he is packing and make a decision about how to complete the packing process.
Packer Decision Tree - Current State
Figure 2: Pack process decision tree
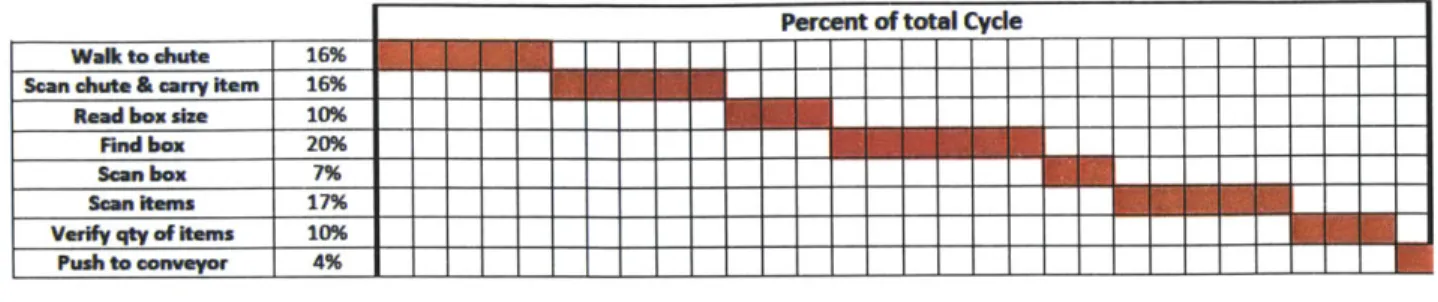
The following table shows the key steps with the associated cycle time study to complete the step. This data was collected in February 2010 by observing multiple shifts, pack stations, and operators. This study did not include approximately 8% of all orders because those orders needed to be packed into extra-large (Boxes G and H) boxes. Boxes G and H are excluded because they included the additional step of hand making boxes and folding down the box flaps. These cycle times are represented in Figure 3 below. The step in the process is described on the left and each red square represents approximately 4% of the cycle time.
Percent of total Cycle
Walk to Chute 16% Sca chute & Cary item 16% Read box size 10%
Rnd box 20%
S...b.x 7%
Scan Items 17%
Verify qty of items 10% Push to conveyor 4%
Figure 3: Baseline cycle time study of the pack process 4.2 Inefficiencies in Pack Process
The initial month of data collection and observation identified numerous inefficiencies in the pack process to improve during the internship. Some of these forms of waste included:
- Finding the recommended box
- Hand making boxes G and H (account for 8% of all boxes) - Insufficient supply of required boxes
- Folding and unfolding flaps of boxes G and H - Extra verification in scanning process
There were many potential improvement activities that could have worked on during this project. During the project, we led four weeklong Kaizen events with System X workers to reduce waste. We implemented major five improvements to eliminate waste and relieve the bottleneck in System X. In this paper we focus on the standardization of order flow to eliminate the decision points in the pack process.
4.3 Hypothesis of Pack Process Improvements
One of the key learnings from the observations of the pack process was the delay and waste that occurs at the decision points in the packing operation. The two questions that a packer must evaluate as each order is packed are:
- What size box does this order require?
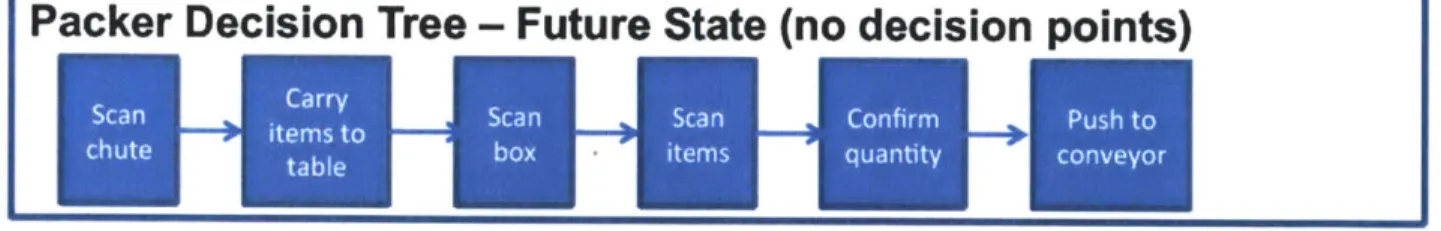
As workers reach these two points they have to pause and mentally answer the question. In the case of finding the correct box size, packers work areas are full of eight different box sizes and they have to remember where the correct box is stored. Another way to consider these two questions is to visually represent the packer's decision tree with the decision points removed from the process. Figure 4 below shows how removing decision points would create a standardized process that doesn't have any instances where a packer has to stop and consider what to do next.
Packer Decision Tree - Future State (no decision points)
Scan .[ arry 1Scan ca ofirm Push to
chute items to box - items quantity conveyor
Figure 4: Future state decision tree with decision points removed
All the remaining steps in the process do not have the interruption of considering what they should do
and the operator can quickly processes work without interruptions. We began to consider the potential rates that the pack process could experience if these decisions were removed from each order and all steps in the pack process became standardized. The hypothesis was the following:
If decision points and the time spent fulfilling those decisions cause a delay in the pack process, then removing both of these interruptions will improve the overall pack rates.
We chose this as the primary focus of my research and this paper. The remaining sections will focus primarily on the analysis, testing and results of my hypothesis test.
4.4 Definition of Success for Hypothesis Test
As discussed earlier, System X is an interdependent process that flows work through the system. If the changes to the pack station limit the flexibility for work to flow into and out of any other process then the improvement is unacceptable. As the improvement activities were considered, it was agreed that any changes to the pack station could not decrease the individual work rates at other stations or reduce the overall capacity of the system. Also, the improvements to the pack rates had to be statistically significant and not be simple noise.
Chapter 5: Design of Standardized Packing Station Test
5.1 Concept Validation - Singles Wall
To begin testing the hypothesis, we began by identifying concepts that remove the decision points in the process. The most compelling concept was to modify way that orders are sorted so that orders that fit into specific box sizes are sent to predetermined stations. This standardization of order processing would enable packers to know what box size is required to package the order before each order is packaged. It also simplifies packers pre-assembled box selection because they only need to stock the one box size that is assigned to that station in lieu of stocking all eight box sizes in the area. Before designing and testing a full-scale standardized test station, we felt it would be useful to perform small tests of the concept. A simple test would reduce the risk of disrupting the entire production system. During a kaizen event with employees, a test concept was identified to send all single item orders of one box size to one station that is equipped with the right boxes.
This test was low risk because single item orders have the lowest dwell time in the pack wall. This limits the potential risk of orders filling a pack wall and backing up the system. This is possible because single item orders don't have to wait for multiple items to arrive at the rebin station before being pushed to the pack station. Single item orders would allow us to test removing the decision point without adding complexity to the change. The decision points being removed are which box
size is needed to package the order and then the interruption that the packer has of finding the appropriate box size.
5.1.1 Single Item Order Data Analysis
To test this concept, we needed to determine which box size we would test and how many stations should be dedicated to pack this particular size. We chose to study historical data as a means to forecast future order volume. Historical data doesn't represent all future order behavior because Amazon's customer behavior varies significantly as new products are released and sales promotions are implemented. However, a thorough statistical review of historical data will be used to design the standardized pack stations.
There are 3 key pieces of historical data that needed to be analyzed when designing this initial test. First, the daily quantity of single item orders by box size should be reviewed. This would show the most frequent box size used and identify which boxes might be good candidates for the dedicated
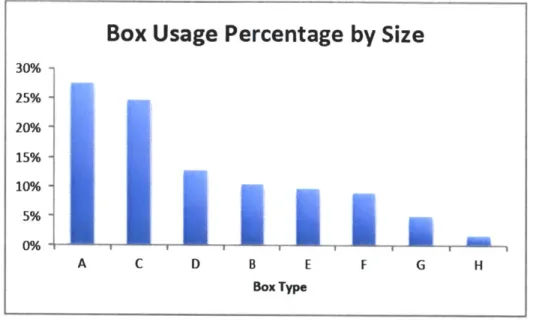
singles pack station. Since the test would take place during the month of February 2010, we chose to use the data from January 2010 to simulate the demand during February. The box sizes used in February 2009 were different from the current box sizes and therefore were not a valid sample. Figure 5 below shows that the most frequently used single item boxes are the E and the A boxes. These 2 box sizes represent approximately 50 percent of all orders.
Box Usage Percentage by Size
30% 25% 20% 15% 10% 5% 0% A C D B E F G H Box Type
FIgure 5: Average daily consumption of each box size In System X
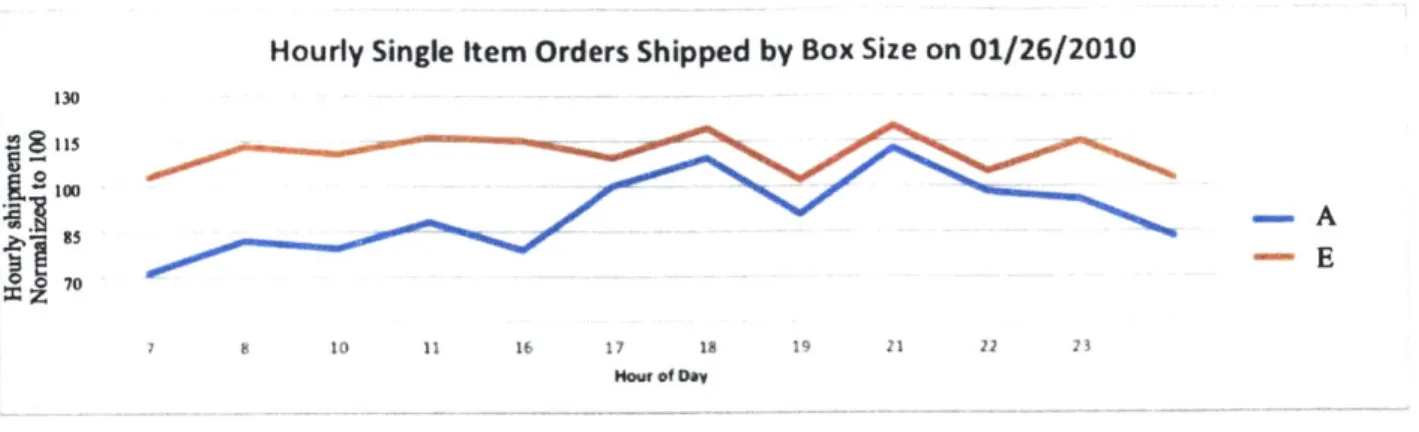
Second, the hourly variation in single item orders processed by box size should be studied. This data will show the correlation between box sizes. The theory is that designating a pack station to receive only 1 box size will cause the system to back up if order volumes exceed the operators' processing capacity. Likewise, if order volumes drop too low, the operators' processing capacity is under-utilized and will create additional waste. We studied the data in January 2010 to understand hourly variation. The data from the sample period showed a moderately strong correlation of 0.67 between the E and the A boxes. Figure 6 below shows a sample of boxes shipped per hour in the 2 most
frequently used boxes on 01/26/2010. The chart shows a trend which is that at critical shipping hours, "premium orders" or the orders that must be shipped out to make a promised customer delivery times experience a spike in order volume. At 17:00 and 18:00, orders in box size A increased over 65% to make the 18:00 trucking deadline. Orders are not level throughout the day.
Hourly Single Item Orders Shipped by Box Size on 01/26/2010 130 115 70 7 8 10 11 16 17 18 19 21 22 23 Hour of Day
Figure 6: Hourly box usage of the 2 most frequently used boxes in System X
Third, the processing rates needed to be reviewed to determine how many operators and stations are needed to process single item orders. At Amazon, data is collected at each operation. This allows management to track the flow of each order through the system as well as provide quantitative metrics to evaluate employee performance. With this data, the average rate of each operation can be reviewed. The 2 key processes that we needed to know processing rates for were induct, rebin, and packing since these would be directly involved with processing the single item orders during the test. The value that I chose for this is the expected processing rate that management holds employees to
for each of these operations. The rates for the 3 processes are summarized below in Table 2 and are normalized to the expected rate for the rebin process.
Table 2: Expected work rates for each process in System X Hourly Unit
per hr. Rate
Induct 225%
Rebin 100%
Pac 92%
5.1.2 Design of Single Pack Station
With the key pieces of data collected, a singles pack station test could be designed. The key design questions that needed to be answered were the following:
- Which box size(s) should be designated on the test station? - How many operators should be staffed at each station?
- Are there any required changes in box delivery to the packers? - What are the potential risks for the change?
Working with management, Amazon's Operations group in Seattle, and the LEXI line workers, we decided to run the test at 1 of the N pack stations and designate the station to process all single item orders of E and A boxes. The staffing to maximize utilization of the rebin and pack operators is 2 rebinners and 2 packers at this designated station. The expected utilization of workers at rebin and pack based on historical data would be 85% and 93% respectively. Although there was an imbalance in employee utilization between the 2 processes, management was comfortable taking this potential lose to learn from the test.
Since this new station will be consuming a higher volume of the two designated box sizes, additional box delivery was set up to keep one pallet of each box size near the packers. If box delivery is interrupted on the trolley system, the pallet will be available to keep orders flowing though this station.
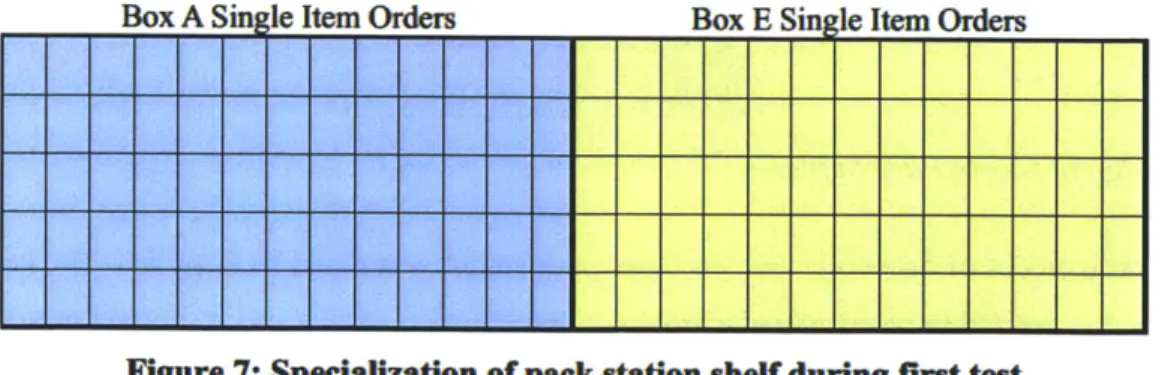
Each pack station is made up of two shelves. Each shelf has T slots for orders. The software team at Amazon's headquarters in Seattle agreed to designate one shelf to process E single item orders and the other shelf would process A single item orders. The change was done by applying a software filter to the T slots on each shelf to process single item orders of the respective size. With this filter applied, the horizontal push sorter would always send orders that satisfy that filter designation to those slots. If all T slots are full, then the orders will be dispersed to the N-I remaining stations until slots on the designated station become available. Figure 7 shows a representation of how packers at the designated single item order station would see the packing shelves.
Box A Single Item Orders Box E Single Item Orders
Figure 7: Specialization of pack station shelf during first test
5.1.3 Expected Outcome of Single Item Pack Station
There are two primary goals that we expected to see from the test. First we anticipated an increase in pack rates at this station as the decision point was removed and packers could work uninterrupted
with a standard process. Eliminating the delays associated with these decision points would create at least a 15% rate improvement. This savings was calculated by eliminating the time spent reading the recommended box size and then finding the recommended box size among the 8 different box sizes. The second outcome of this test that we hoped for was to observe the behavior of the horizontal push
sorter as a pack station was specialized. The horizontal sorter is able to balance work across all N pack stations since all the stations are the same and any size order can be sent to each station. This
allows the software to send work to stations that are low on work and avoid stations that have a higher work content. We hoped to learn how a specialized pack station would impact the sorter rates across the system.
5.1.4 Observed Outcome of Single Item Pack Station
During the second and third week of February 2010, one pack station in System X was designated to process E and A boxes. The test provided insights into the effects of standardization on packers and on System X as a whole. To describe the outcome, I will provide feedback from the operators, then the managers, and then my observations.
Reaction
from
OperatorsThe first person in the process that was impacted by the change was the rebinner. This person places the items into the slots on the shelf and then pushes them through to the packer as the order is complete. The average items per order reduced by 230%. As a result of this change rebinners at the designated single item station have 18% less time to do the work of their peers on the traditional station. This loss of time is from the additional time spent pushing orders through to the pack stations. However, the operators on the other stations are now doing fewer pushes since the average items per order has increased. Using the same logic, the remaining N-1 rebinners have an extra 2.4% time to do their work.
The second affected operator was the packer. By removing the decision points and standardizing their process, the average carton per hour rate increased by 195% after the test because of the exclusive use of single item orders. The average units per hour increased by 21.4% from the average rate at the
start of the project. The timesaving came from the elimination of time spent identifying which box they needed as well as the time spent looking for boxes. The common complaint from packers was the increased stress of coming back and forth from the pack wall to the pack table. This is the same
result as observed by the rebinners. Packers now have a lower item per order value, which means they had to make 2.4 times as many trips to the pack wall compared to their average before the test. These extra trips reduced the available time to achieve their target rate by 11% In spite of this loss, pack rates rose from by 21.4%.
Reaction
from
ManagersManagers did not have positive feedback from the test. As anticipated, order flow into the station was not level and some hours were under utilized while other hours the station was overloaded with work. During the underutilized hours, managers were not happy about the labor hours wasted and the
impact that had on their overall performance metrics. When the station was overloaded, managers would send additional personnel to help process the work or they would temporarily shut down the
station and send the work to N-I remaining stations until the singles station caught up. Managers did not welcome this additional complexity in System X. The singles station required managers to monitor an additional process. They felt that although pack rates at the singles station seemed to
improve, the imbalance of work across System X caused the entire system to perform worse.
General Observations
The comments from the operators and managers capture many of the critical observations from the test. An additional learning from the test was the performance of the horizontal sorter. The horizontal
sorter is the central mechanical piece of the process that directs the totes that hold the order items to the rebin and pack stations. During the hours of high single premium shipments, the designated pack station was assigned higher quantities of work. This imbalance overloaded the rate at which rebinners could process totes of items. The conveyor leading to the rebinner can only handle a fixed number of trays at a time. Once the conveyor lane leading to the rebinner is full, trays are re-circulated around
the sorter until a lane is no longer full. Recirculation is a form of waste, which is caused by an imbalance in work rates between processes. If a lane is causing high levels of recirculation, the horizontal sorter slows down to reduce the imbalance between processes. The singles station caused an increase in the occurrence of recirculation and therefore slowed the overall sorter rates. Overall, during the two-week test, sorter rates decreased 8.3%. This decrease in sorter rates should be compared with the improvement in pack rates.
5.1.5 Lessons for Next Iteration
The first concept validation showed a positive impact on pack rates but provided multiple aspects that needed to be improved. After reviewing the results with management, we decided that a follow on test should be performed that continued to explore the benefits of standardization. The team agreed that the first test was too specialized which accentuated the negative effects on the sorter. The next test would increase the variety of orders processed on a designated pack station in an effort to level flow between the designated and undesignated pack stations.
This could have been a point to build and run a computer simulation to test the different configurations and their impacts on processing rates. Amazon however prefers to learn through physical experimentation within their processes. A computer simulation would have allowed us to test more drastic changes where as with physical experimentation the process changes are limited because the system still needs to fulfill orders to the customer. We chose to proceed with the physical testing after carefully designing the test.
5.2 Concept Expansion - Multi-box Singles Item Pack Station
Building off the lessons from the first test, new designs were explored that added box sizes to the configuration in a hope to smooth the variation in work flow to the designated pack station. The same data set used in the initial test was used in this the following design.
5.2.1 Design of Multi-box Single Item Pack Station
The same questions used in the initial design were used to guide the design of the next iteration. - Which box size(s) should be designated on the test station?
- How many operators should be staffed at each station?
- Are there any required changes in box delivery to the packers? - What are the potential risks for the change?
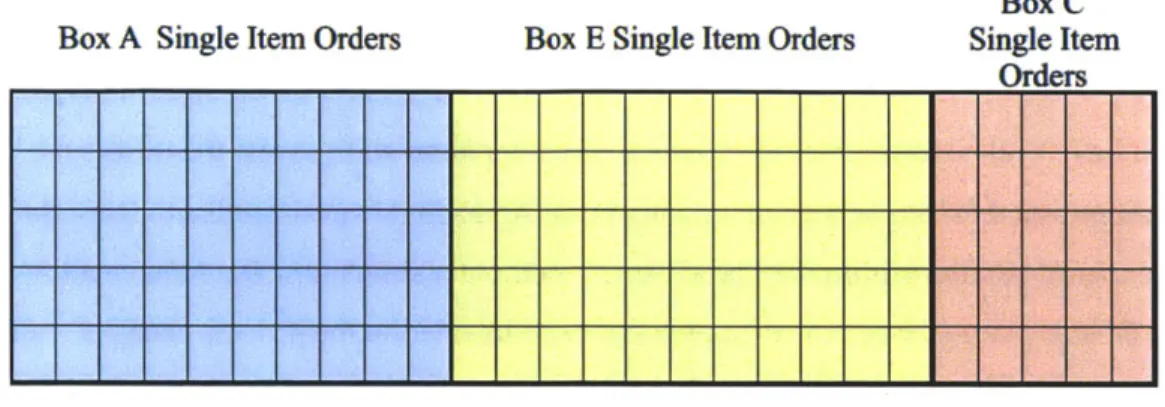
After evaluating multiple scenarios against the historical data, the next design was to designate 2 pack stations to process the single item orders that fit into A, C, and E boxes. The staffing under this scenario was to have I rebinner and I packer at each station. A 'floating' rebinner/packer were available to be brought in by management if order volumes exceeded the process capacity of the
rebinner or packer. This design adds 1 box size in a hope to reduce variation. It also increases the total number of slots to place orders so that recirculation would decrease. Figure 8 shows how the packer would view the updated test configuration. In this image, each cell represents 1 chute on the shelf and the color-coding is a representation of the software code change that designated that chute to a specific box size.
Box C Box A Single Item Orders Box E Single Item Orders Single Item
Orders
Figure 8: Specialization of pack station shelf during second test
5.2.2 Observed Outcome of Multi-box Single Item Pack Station
The second test was run during the fourth week of February and the first week of March 2010. The results of this test were similar to the first test. The intended effect of reducing the higher
recirculation that we experienced in the first test was achieved. However, managers still needed to monitor work flow into the stations and assign flexible workers to the station when work flow exceeds processing rates. The operators also experienced the same difficulty of having to process more single item orders.
These two tests were low risk and showed the improvement in pack rates through standardization. The improvement in pack rates during the second test was similar to the first test. During the first week of testing, we observed a pack rate improvement of 18.9% compared to the expected rate. However, to overcome the negative impacts from over specialization in System X (single items on
limited stations) a more flexible design was needed. The scope of the test needed to be expanded to include both single and multi-item orders. The next section describes the development of this next phase of testing.
5.3 Design of Full Standardized Pack Station Test
Building upon the efficiencies gained from the specialized single station, another design was developed with more flexibility to handle order variation into System X. The next test design would include both singles and multi-item orders. After reviewing the historical orders of October 2009 -March 2010, a design was developed that sent 44% of all orders, both single and multi-item orders, through 8 designated pack stations that used 3 different box sizes. The remaining 56% of orders would be sent to the 10 remaining stations to be packed into the 5 remaining box sizes. This section will describe the data collection, analysis, and design of the next phase of testing.
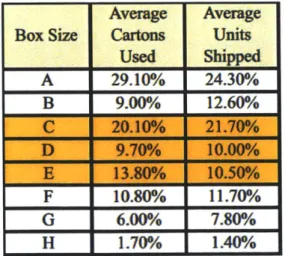
In order to determine the configuration for the next phase of testing, a careful review of historical data was performed. Table 3 shows the historical percentage of box consumption and percentage of total items shipped per box size. This data was critical for designing the flow of work between the specialized and unspecialized pack stations. Choosing the 3 box sizes highlighted is equal to 43.6% of the cartons and 42.2% of the items based on 30 days of historical data during the month of April 2010. These three box sizes were chosen because these box sizes produced a high utilization of the pack chutes as well as producing a relatively balanced mix between the specialized pack stations and the unspecialized pack stations.
Table 3: Historical usage data by box size and units Average Average
Box Size Cartons Units
Used Shipped A 29.10/9 24.30% B 9.00/ 12.60% H 10.80% 11.70% G6.00% 7.80% HI 1.70%/ 1.40%
In addition to looking at the average percentage of each box size that is used in System X, it is also important to consider the hourly variation. As we learned from the testing of the singles pack station, hourly variation can cause some stations to experience high volumes while during other hours operators are underutilized. The following 2 charts show the correlation between the designated and
undesignated pack stations. Reviewing the historical hourly box usage data, the correlation is seen to be a moderately strong positive correlation of 0.64. Figure 10 shows this strong correlation, which
allows the system to remain balanced during most hours. Figure 9 shows that in some instances there is an imbalance because one type of wall increases when the other type of wall stays the same or decreases.
Hourly cartons packed for designated boxes (blue) and
200' undesignated boxes(red) =0 150%/ 100% 0 .. 500/0 1 4 7 10 13 16 19 22 25 28 31 34 37 40 43 46 49 52 55 58 61 64 67 70 73 76 79 82
Hourly observations during April 2010
FIgure 9: Hourly orders shipped on the designated and undesignated pack stations
I
Correlation of 0.64 with Designated and Undesignated -12000 1800 1600 1400 1200 1000 00 600 400 200 0 . . * , * * ' * 4*. . * * 200 400 600 800 1000 Designated Bo Observations 1100 1400 1600
Figure 10: Correlation of the designated and undesignated pack stations
The theory of this new design is that the specialization of the 8 stations is significantly less than the single item order pack stations and therefore will behave in a similar way to the traditional pack stations. The correlation data supports that theory.
5.3.1 Peak Box Usage Analysis
After reviewing the off-peak box consumption, an analysis of the 2009 peak box usage data was done. Management was concerned that the proposed changes may not be scalable to the peak demand around the Christmas holiday. To test this concern, the data from the 2009 peak holiday season was queried for analysis. Figure 11 provides an example of I day worth of box consumption in System X pack. Overall, during the period between Thanksgiving and Christmas, the correlation between the proposed designated stations and the undesignated stations was also moderately strong with a
correlation value of 0.68. This was encouraging because it led us to believe that this change could be scalable for the peak season. Scalability is achieved by adding workers to each station to increase the capacity of the system.
12/3/2009 Hourly Demand Variation by Box Size
3W0
--c 210
so0E
0 56 781 0 11 13 16 17 is1 19 21 22 2
Figure 11: Hourly box usage by box size during peak demand
However, there are instances during the peak season that are a cause for concern. After careful review of the 2009 peak data a few examples of abnormal demand behavior were identified. Figure 12 is a sample of the hourly shipments in System X during the last day of 2009 peak season where Amazon is racing to satisfy demand for the last orders before Christmas. At hour 13, a significant spike in box size E usage would have shut down System X if all the orders tried to ship through the 8 designated pack stations. If System X had been configured with 2 types of pack stations, the specialized stations and the traditional station, the horizontal sorter would experience a recirculation percentage that would shut down System X. The sorter would try to send too many orders to the specialized station and operators would be overloaded. The traditional configuration allows orders to be spread across 18 stations but specializing limits the number of stations that can process orders. This was a concern for further implementation but after discussing this with management, it was agreed that we should proceed and rollback the change if the risk persisted after the test.
Box Usage by Hour on 12/22/2009
0 C-C,_ V.. CL 600 500 400 300 200 100 0 8 10 11 13 14 16 Hour (PST)--
c
-NG 17 18 19 22 ""H -EFigure 12: Abnormal demand behavior during peak demand
5.3.2 Peak Box Usage Analysis
After considering the historical demand trends both on and off peak, I developed the next iteration of the specialized pack station. By modifying the sortation logic to send both single and multi-item orders to these specialized stations, the demand fluctuations and the imbalance between the
specialized and the standard pack station should be reduced. Figure 13 below shows the layout that a packer would see when working on this next version of the pack station. The 8 specialized pack stations are all identical. Each station is divided into 3 zones, which are assigned to process only 1 specific box size. Each zone is color-coded and has a label showing the name of the designated box size for each chute.
BoxD-4 Box C - 13 columns
Box E - 9 columns columns
5.3.3 Fill Priority Improvements
After specializing the 8 pack stations to process specific box sizes, the fill priority was adjusted to keep packers focused in 2 central areas. The fill priority is part of the sortation code that gives some chutes on the station a higher priority then others. The image below shows the highest priority chutes in the station to have a score of 10 and then descend as the priority decreases. This was done so that a packer is most likely to spend their time packing along the dividing line between the 2 designated box sizes. This decreased the travel time for both the rebinner and the packer. Figure 14 shows the fill priority used on the designated pack station. The green chutes with a score of 10 have the highest fill priority and the priority descends down to the red chutes with a number 3.
FIgure 14: Fill priority map for sortation software
5.3.4 Color-coding Pack Station
Feedback from the packers from previous tests led us to develop a color-coding and labeling system for the next phase of testing. This would assist in removing the decision points and help quickly train
new packers on the specialized pack station. For the next phase of testing, the specialized pack stations were all color-coded and a box name label was added to each pack chute so packers didn't
have to think about which size box was required. Box containers were also built to hold sufficient safety stock of the required box size. These visuals are compared in
Figure 15: Pack station prior to standardization
Figure 16: Pack station after standardization, showing the visuals for each box size Chapter Summary
This chapter has described the iterative process of developing a full test for the hypothesis. The 2 initial tests helped shape the design of final test by defining the strengths and limitations of a specialized pack station. The chapter also describes the analysis and design of a full test of the specialized pack station concept.
Chapter 6: Trial of Specialized Pack Station
The specialized pack stations were operational from 5/25/2010 to 7/21/2010. As anticipated, the cycle time reduction of not having to read the recommended box size and find the box is 10.9% of the total pack cycle time. The carton per hour pack rates on the designated pack station was 23.7% higher when comparing the rates before and after the change. During the first week after the change, packers also performed at an item per hour rate that was 7.2% higher than before the change.
6.1 Analysis of Results from Standardized Pack Station Trial
The workloads between the 2 sets of pack stations were nearly identical during the first weeks of testing. The balance of work between the 2 types of stations meant that recirculation was at its normal
operational levels and work was flowing evenly across the system. Figure 17 below shows the quantity of items that are sent to each pack station in an hour on 6/28/10. The variation in workflow between the different stations was within the average variation in rebinner rates. This supports the theory that the less specialized the pack stations are, the more capable the system is at handling variation in demand.
Average hourly diverts on 5-28-10
120 1 ~1002 80 -80
0
60
40 ~i20-0 C 1 2 3 4 5 6 7 8 9 10 1112 13 14 15 16 17 18 Rebin StationFigure 17: Hourly diverts on sorter to the 18 rebin stations
6.1.1 Initial Reaction from Operators
Rebinners and packers were generally satisfied with the updated configuration. The use of both Multi-item and single-item orders on the designated pack stations reduced the strain on rebinners and packers. However, the average items per order on the designated pack station was 35% lower than the undesignated stations. This difference in items per order was a source of complaints by both
rebinners and packers. The rebinners complained because of all the extra pushes that they had to make and the packers complained because of all the additional trips between the pack wall and the table.
However, some packers were satisfied with the changes to the pack because it made their processes less complex. Managers used the designated pack stations as a training location for new packers because new packers could understand the process much faster with the decision points removed
from the operation.
6.1.2 Initial Reaction from Managers
Initially managers did not have any concerns with the change and felt the improvement was a sustainable change. Managers had to spend additional time training packers after the change and addressing packers concerns.
6.1.3 General Observations
The test was generally very stable and showed strong benefits for packers. However, the box sizes used on the 8 designated pack stations are more susceptible to spikes in demand at premium shipment times. These spikes in demand created a noticeable imbalance, which caused rebinners and packers at these stations to experience higher work demands.
6.2 Order Variation during Standardized Test Station
During the first month after the change, the specialized pack stations proved to be a success. However, over time the changes in the order mix created an imbalance between the specialized and unspecialized pack stations and decreased sort rates. This shift increased the average workload to the
8 designated pack stations when compared to the 10 undesignated stations. The result of this imbalance is a higher than average recirculation rate on the tote sorter and a decrease in induct and rebin rates. Based on these findings, we chose to stop specializing on the 8 specialized test stations until the final design is implemented. At the end of the project, System X had returned back to the same configuration and operations that were present at the beginning of the project.
Figure 18 below shows the change in box usage over a 2-month period. The usage of the E box size increased 50% and the usage of the A box size decreased by 45%. This change in consumption was caused by a redistribution of work in LEXI outbound. The cause for more small orders during this
period is unknown. It could have been a form of seasonality or possible a shift in product mix within the facility. The increase in E box usage caused the 8 specialized pack stations to get more work than the 10 standard pack stations. This imbalance resulted in higher recirculation rates and lower induct and rebin rates.
Weekly Box Usage
300o0 25000 20000 to~ 15000 iso Bo """Box A 10000 inmBox E 5000
Figure 18: Variation in box usage in System X over two months 6.3 Sorter Divert Variation during Order Variation
As the distribution of work changed during the specialized pack station test, the workload to the different pack stations varied. Figure 19 below shows the percentage of the items per station (total items/N stations) during I hour of operation. The specialized station had a higher workload by 17%. This variation in work shows one of the primary weaknesses with the specialized pack station design. The workload in an Amazon fulfillment system and the demands of customers are very dynamic. Using historical data to design a standard packing system is not a viable design method because the system is in constant change.
Figure 19: Imbalance in diverts between specialized and unspecialized pack stations Chapter Summary
This chapter discussed the results of the full test that was run on 8 specialized pack stations. The results continued to show improvements in pack rates but the overall system suffered from imbalances between the specialized and unspecialized pack areas. This identified the need for a balanced design that is the same across all stations as well as more responsive software that monitors
the flow of work and relieves the constraints as the system becomes imbalanced.
Diverts per Rebin Lane During Test
0
160 -o140 S120 E E 100 18 56789 0121111 eb LeActual M 60 Designated Avg CL Undes Avg 1 2 3 4 5 6 7 8 9 10 1112 131415 16Chapter 7: Recommendations for Future Designs
As Amazon expands its operations to satisfy customer demand, the use of System X will be a key part to efficiently ship orders. My internship provided useful insights into design improvements for the next iteration of System X design. This section will outline ways to improve pack rates in the next System X based on the learnings from my internship.
7.1.1 Creation of a New Chute Size Category
The utilization of space in the pack wall is a very valuable opportunity for improving the pack walls. Currently, the narrowest pack chute is
Q
inches wide and has the small chute category. Over 60% of orders can fit into a new chute category (extra small) that is 25% narrower. An example of the chute utilization is shown in Figure 20 and Figure 21 below.Figure 21: Future state utilization of chute volume with size A box
By doing this, additional chutes can be added to the pack walls and increase the capacity of the pack walls. Also, a higher density of orders within a pack station will result in less wasted travel for both packers and rebinners. The density is greater because there is less wasted space between orders with
limits the amount of travel that rebinners and packers must make.
7.1.2 Specialization ofAll Pack Chutes
The specialization of pack chutes will be less susceptible to the negative impacts of variation if all the pack stations are the same. By designating each box size on the front shelf of the pack station the back shelves can be used as overflow capacity when orders fluctuate outside of the mean demand. The following image is the recommended layout for the final pack wall design. This design would be the same on all N pack walls. This design is based on the physical constraints of the pack wall and the recommended quantity of chutes based on historical
consumption. The layout is for both the front wall and the back walls are shown in Figure 22 and Figure 23 below.