Publisher’s version / Version de l'éditeur:
Vous avez des questions? Nous pouvons vous aider. Pour communiquer directement avec un auteur, consultez la
première page de la revue dans laquelle son article a été publié afin de trouver ses coordonnées. Si vous n’arrivez pas à les repérer, communiquez avec nous à PublicationsArchive-ArchivesPublications@nrc-cnrc.gc.ca.
Questions? Contact the NRC Publications Archive team at
PublicationsArchive-ArchivesPublications@nrc-cnrc.gc.ca. If you wish to email the authors directly, please see the first page of the publication for their contact information.
https://publications-cnrc.canada.ca/fra/droits
L’accès à ce site Web et l’utilisation de son contenu sont assujettis aux conditions présentées dans le site LISEZ CES CONDITIONS ATTENTIVEMENT AVANT D’UTILISER CE SITE WEB.
Infra 2006 - Le Québec en chantier : optimiser les interventions, pp. 1-17, 2006-11-01
READ THESE TERMS AND CONDITIONS CAREFULLY BEFORE USING THIS WEBSITE. https://nrc-publications.canada.ca/eng/copyright
NRC Publications Archive Record / Notice des Archives des publications du CNRC :
https://nrc-publications.canada.ca/eng/view/object/?id=4671f600-cfb5-44e3-9495-a81a1e9fa429 https://publications-cnrc.canada.ca/fra/voir/objet/?id=4671f600-cfb5-44e3-9495-a81a1e9fa429
NRC Publications Archive
Archives des publications du CNRC
This publication could be one of several versions: author’s original, accepted manuscript or the publisher’s version. / La version de cette publication peut être l’une des suivantes : la version prépublication de l’auteur, la version acceptée du manuscrit ou la version de l’éditeur.
Access and use of this website and the material on it are subject to the Terms and Conditions set forth at
Life cycle cost analysis of high performance concrete bridges considering environmental impacts
http://irc.nrc-cnrc.gc.ca
Life cycle c ost a na lysis of high
pe rfor m a nc e c onc re t e bridge s
c onside ring t he ir e nvironm e nt a l im pa c t s
N R C C - 4 8 6 9 6
D a i g l e , L . ; L o u n i s , Z .
A v e r s i o n o f t h i s d o c u m e n t i s p u b l i s h e d i n
/ U n e v e r s i o n d e c e d o c u m e n t s e t r o u v e
d a n s : I N F R A 2 0 0 6 : L e Q u é b e c e n c h a n t i e r :
o p t i m i z e r l e s i n t e r v e n t i o n s , V i l l e d e
Q u é b e c , N o v . 2 0 - 2 2 , 2 0 0 6 , p p . 1 - 1 7
LIFE CYCLE COST ANALYSIS OF HIGH PERFORMANCE CONCRETE
BRIDGES CONSIDERING THEIR ENVIRONMENTAL IMPACTS
Lyne Daigle, M.Sc., P.Eng. Technical Officer
Zoubir Lounis, Ph.D., P. Eng. Group Leader, Concrete Structures
Institute for Research in Construction National Research Council Canada, M-20 1200 Montreal Road, Ottawa, ON, K1A 0R6
INFRA 2006
November 20-22
ABSTRACT
This paper presents a comprehensive approach to life cycle cost analysis of reinforced concrete bridges that takes into account all costs incurred by the owners and users during construction, maintenance rehabilitation and replacement. This approach provides also an estimate of the environmental impacts associated with construction and replacement of bridge decks in terms of greenhouse gas emissions and waste production. The analysis considers all the key stages in the life cycle, which include extraction of raw materials, construction, maintenance, repair and rehabilitation, replacement, and disposal. The total life cycle costs are evaluated by using the present value method. In this paper, the long-term economic efficiency of high performance concrete (HPC) containing supplementary cementing materials for the construction and rehabilitation of concrete bridges is evaluated and compared to that of normal performance concrete (NPC) in terms of service life, life cycle cost and environmental impacts.
The proposed comprehensive approach for life cycle cost analysis is illustrated on the cases of two concrete highway bridge decks that are built in a corrosive environment using HPC and NPC. It is found that:
(i) In terms of durability, the HPC deck has a service life that can vary from 3 to 10 times
the service life of NPC deck having the same water-to-cementitious material ratio; (ii) In terms of economy, the HPC deck is found to be more cost-effective than NPC deck in
terms of both agency and user costs. The agency life cycle cost for the HPC deck is about 40%-45% lower than that of the NPC deck; while the user’s life cycle cost of the HPC deck is about 1/3 that of the NPC deck; and
(iii) In terms of environmental impact, the HPC deck yields a 65% reduction in the CO2
1. Introduction
In the last three decades, the use of high performance concrete (HPC) incorporating supplementary cementing materials (SCMs) in concrete structures has increased considerably. The use of HPC enables he construction of structures with higher strength, lower weight and longer service life than normal performance concrete (NPC). The initial cost of structures built using HPC can be much higher than those built with NPC. However, HPC structures have much longer service lives than NPC structures, which in turn lead to lower maintenance and rehabilitation costs over their life cycles. The selection of cost-effective design and rehabilitation alternatives should therefore be based on the total life cost of the structure, which includes the initial construction cost and the costs of inspection, maintenance, rehabilitation, and replacement. A realistic approach to life cycle analysis should consider all the key stages, which includes extraction and transportation of the raw materials, construction, maintenance, repair and rehabilitation, replacement, and disposal of the structure. Different types of costs are incurred within the life cycle of a structure, which can be divided into different categories, including owner’s costs, users’ (or social) costs, and additional third-party costs (e.g. environmental costs). This paper presents an approach to life cycle cost analysis of reinforced concrete bridges that takes into account of all the costs incurred by the owners, users, as well as the environmental impacts throughout their life cycles. The long-term economic efficiency of high performance concrete (HPC) containing (SCMs) for the construction and rehabilitation of concrete bridges is compared to that of normal performance concrete (NPC) in terms of service life, life cycle cost and environmental impacts.
A comparative life cycle assessment of the performance, cost and environmental impacts of high performance (HPC) and normal performance concrete (NPC) is undertaken for the case of reinforced concrete highway bridge deck that are built in corrosive environments. The determination of the deck service life is required for the life cycle cost analysis and life cycle environmental impact assessment. In this example, the extended durability of HPC over NPC is shown to be the leading criterion in ensuring the improved overall performance of HPC decks when compared to NPC decks.
2. Service Life of HPC and NPC Bridge Decks
The service life of RC structures built in corrosive environments can be described by a two-stage model:
(i) corrosion initiation stage, during which chlorides penetrate the concrete cover, reach the
reinforcing steel and accumulate until they reach the so-called “threshold level” and depassivate the steel;
(ii) corrosion propagation stage during which the concrete structure deteriorates due to stresses generated by the corrosion products around the steel rebars.
In this paper, the service life of reinforced concrete bridge deck is defined as the time to the onset of corrosion. It is determined by using Crank’s solution (Eq. 1) of Fick’s second law of diffusion (Crank 1975) to predict the chloride ingress into concrete.
)] Dt x erf( [ C C(x,t) s 2 1− = (1)
where: C(x,t) is the chloride concentration at depth x after time t; Cs is the chloride concentration
at the surface; D is the diffusion coefficient; t is the time of exposure; and erf is the error
function. To predict the time of corrosion initiation (Ti), the chloride concentration in equation (1)
is set equal to a chloride threshold value Cth at which the corrosion of the reinforcing steel is
expected to start, and the variable x (depth from the surface) is set equal to the effective cover
depth of the reinforcing steel, dc . Equation (1) can be rewritten as follows:
2 1 2 1 4 ⎥ ⎥ ⎦ ⎤ ⎢ ⎢ ⎣ ⎡ ⎟⎟ ⎠ ⎞ ⎜⎜ ⎝ ⎛ − = − s th c i C C erf D d T (2)
The following service life parameters for the HPC and NPC bridge decks are assumed: (i)
concrete cover depth = 60 mm; (ii) surface chloride concentration = 6 kg/m3, which is the
boundary value between the high and severe levels of corrosive environment (Weyers 1994); and (iii) threshold chloride content (assuming the same threshold value for HPC and NPC and that
conventional “black” steel is used in both cases) = 0.70 kg/m3. The chloride coefficients of
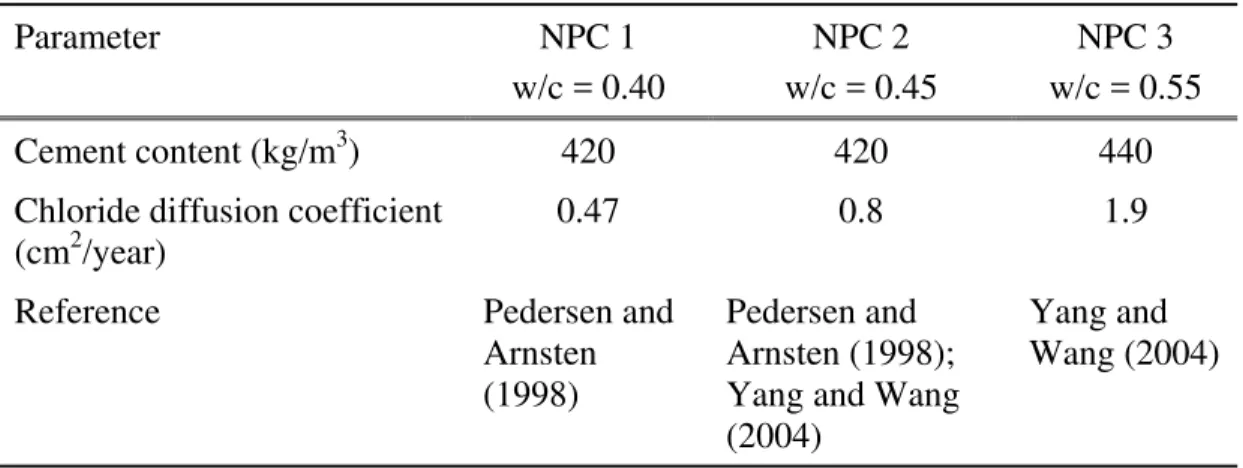
diffusion of both types of concrete were determined for different mixes. Three different types of normal concrete mix with increasing water-to-cementitious materials ratios (0.4, 0.50 and 0.55) and three different types of HPC mix incorporating different types of SCMs (fly ash, slag, and silica fume) were investigated. The chloride coefficient of diffusion and related information for the NPC and HPC mixes are given in Table 1 and Table 2, respectively.
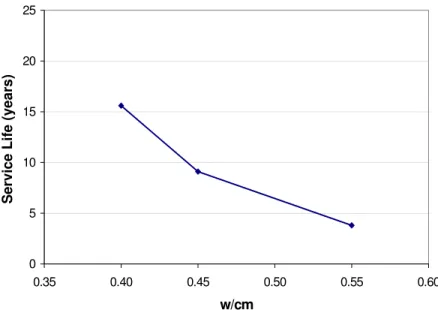
The predicted service lives for NPC bridge decks with different water-to-cementitious materials (w/cm) ratios are shown in Fig. 1. From this figure, it can be seen that as the w/cm increases the service life decreases quite considerably (a 37% increase in w/cm yields a 60% decrease in service life), which illustrates the benefits of using HPC with low w/cm to extend the service life of concrete structures. Figure 2 shows the service lives obtained for HPC and NPC bridge decks made with concrete having the same w/cm. The service life of HPC decks incorporating SCMs is 3 to 10 times higher than that of normal concrete decks having the same w/cm. The main difference between NPC and HPC decks is the reduced coefficient of diffusion for the HPC. It can be seen from Table 1 and Table 2 that the diffusion coefficients of HPC decks vary from 7% to 42% of the values of NPC decks.
The coefficients of diffusion of chlorides are taken from limited long-term outdoors-testing data available in the literature. A direct comparison between the different types of HPC mixes is not possible due to the difference in w/cm and also in the percentage of the SCM material used.
Table 1. Data on NPC mixes and associated chloride diffusion coefficients
Parameter NPC 1 w/c = 0.40 NPC 2 w/c = 0.45 NPC 3 w/c = 0.55 Cement content (kg/m3) 420 420 440
Chloride diffusion coefficient
(cm2/year)
0.47 0.8 1.9
Reference Pedersen and
Arnsten (1998)
Pedersen and Arnsten (1998); Yang and Wang (2004)
Yang and Wang (2004)
Table 2. Data on HPC mixes and associated chloride diffusion coefficients
Parameter / HPC Mixes HPC1-SF HPC2-S HPC3-FA
Cement content (kg/m3) 389 110 227
w/cm 0.40 0.48 0.54
Silica fume- SF (kg/m3) 31 (7.5%) 0 0
Fly Ash - FA (kg/m3) 0 0 97 (30%)
Slag - S (kg/m3) 0 255 (70%) 0
Chloride diffusion coefficient
(cm2/year) 0.14 0.17 0.16 Reference Pedersen and Arnsten (1998) Bamforth (1993) Bamforth (1993)
0 5 10 15 20 25 0.35 0.40 0.45 0.50 0.55 0.60 w/cm
Service Life (years)
Fig.1. Variation of service life with water-to-cementitious materials ratio for NPC bridge decks
0 10 20 30 40 50 60
Service Life (years)
HPC NPC 7.5% S ilica fum e 30% Fly Ash 70% S lag w/cm=0.40 w/cm=0.48 w/cm=0.54
3. Life Cycle Cost of HPC and NPC Bridge Decks
A life cycle cost analysis (LCCA) is undertaken to evaluate the economic performance of competing design and maintenance alternatives. The use of the LCCA enables to assess the total cost of a bridge deck when different inspection, maintenance repair and rehabilitation activities are incurred at different points in time.
The present value life cycle cost (PVLCC) of a bridge deck over a given life cycle T, which
incurs expenditures Ci at different points in time ti (i=1,2…n), assuming a constant discount rate
r, is given by (Hawk 2003): PVLCC = C0 +
(
)
T v T t t i i r R r t C i i + − +∑
= (1 ) 1 ) ( 1 (3) where:C0= Initial construction cost (including design costs);
Ci(ti) = ith expenditure at time ti(e.g. inspection, maintenance, repair, demolition, disposal, etc.);
r = discount rate;
T = life cycle; and
Rv= residual (or salvage) value at the end of the life cycle.
Based on the previous service life prediction for NPC and HPC decks, the NPC deck (w/cm=0.4) has an average service life of 15 years, while an average value for the service life of HPC decks can be about 45 years. The life cycle costs analysis (LCCA) is carried over a period of 30 years (T), assuming a discount rate (r) of 3%.
During a life cycle of 30 years, it is assumed that the NPC deck is replaced with a similar type of deck after 15 years. At the end of the life cycle, the end of service life of the HPC deck is not reached. A residual value for this alternative is included (as a negative value) in the life cycle cost calculations to account for the remaining service life. General information on the bridge and traffic data are summarized in Table 3.
Table 3. Bridge Data
Bridge width 12.35 m
Bridge length 35 m
Deck thickness 200 mm
Isotropic reinforcement percentage for both mats 0.3%
Annual Average Daily Traffic (AADT) 4000
Annual Average Daily Truck Traffic (AADTT) 1000
3.1 Agency Costs
The direct costs incurred by the bridge owner include the initial construction costs and costs associated with the inspection, repair, rehabilitation and replacement. In this example, the initial construction costs include the in-place costs of concrete and reinforcing steel and additional construction costs. The in-place costs include, in addition to the on-site material cost, the cost of formwork, placing the reinforcement steel, pouring and surface finishing of the concrete, and form stripping (Table 4). The estimated in-place cost of HPC with SCMs will depend on factors such as (Bouzoubaâ and Fournier 2003):
The cost of different SCMs varies widely. Depending on the location of the construction site, the cost of silica fume may be 3 to 5 times higher than Portland cement Type 10, whereas the costs of slag and fly ash vary between 40% and 85% of the cost of Type 10 cement.
Additional cost for incorporating SCMs in concrete mix. Additional storage space for SCMs.
In this example, the lower bound for the in-place cost of HPC with SCMs is assumed the same as that of normal concrete and the upper bound cost is assumed to be 50% higher than the cost of
normal concrete. The additional construction cost is fixed at $350/m2 to achieve a total deck
construction cost comparable to the replacement cost (Table 5) excluding the costs of demolition and disposal.
Table 4. In-place costs of materials
Material Unit Cost
Conventional (“black”) steel $1.80 /kg
Normal concrete $600 /m3
High performance concrete with SCMs $600 /m3-$900/m3
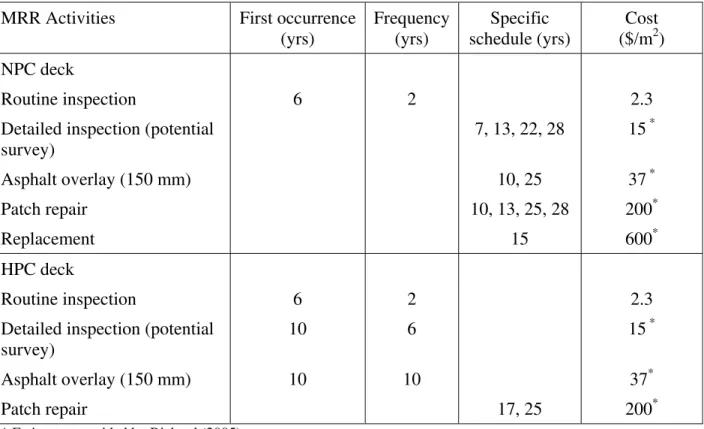
The schedule and costs of inspection, repair, rehabilitation and replacement activities are listed in Table 5 for both NPC and HPC deck alternatives. The cost of patch repairs includes: (i) cost of removing the contaminated or deteriorated concrete; (ii) cost of concrete patching; and (iii) cost of traffic control when the bridge is partially opened to traffic. It is assumed that 5% of the deck area is repaired at each occurrence of the patch repair activity. After the normal concrete deck is replaced (after 15 years), the same activities are assumed to take place with the same schedule until the end of the analysis period as shown in Table 5. The replacement cost includes the
construction cost and the costs of demolition and disposal evaluated at $350/m3. The residual
value of the HPC deck is calculated based on the remaining service life and replacement cost. The present values of the life cycle costs (PVLCC) for the agency are presented in Fig. 3. For the
$524/m2 to $584/m2 depending on the in-place cost of the HPC mix. Therefore, the life cycle cost of the HPC design alternative is about 40% to 45% lower than the life cycle cost of the NPC deck alternative.
Table 5. Schedule and cost of inspection, repair, rehabilitation and replacement activities
MRR Activities First occurrence
(yrs) Frequency (yrs) Specific schedule (yrs) Cost ($/m2) NPC deck Routine inspection 6 2 2.3
Detailed inspection (potential survey) 7, 13, 22, 28 15 * Asphalt overlay (150 mm) 10, 25 37 * Patch repair 10, 13, 25, 28 200* Replacement 15 600* HPC deck Routine inspection 6 2 2.3
Detailed inspection (potential survey)
10 6 15 *
Asphalt overlay (150 mm) 10 10 37*
Patch repair 17, 25 200*
* Estimates provided by Richard (2005).
The relative importance of the construction, maintenance and repair activities, in terms of present value, is quite similar for both deck alternatives (Fig. 4). For both alternatives, the inspection, maintenance and repair activities represent less than 20% of the PVLCC. In this example, the influence of the estimated service lives, initial construction costs and replacement cost on the PVLCC is more significant than the precise estimation of inspection, maintenance and repair costs and schedules.
3.2 User Costs
The user costs represent the inconvenience and expenses incurred by the bridge users due to traffic disruption, which include the travel delay costs, vehicle-operating costs (VOC), and accident costs. The user cost model and some cost data are based on a methodology and cost data of CALTRANS and other sources (Golabi et al. 1993; Ehlen and Marshall 1996; Walls and Smith 1998). To include these costs in the analysis, additional information is needed for each activity
NPC (Mix cost is constant)
HPC
Fig.3. Present Value of Life Cycle Agency Cost for NPC and HPC bridge decks
81% 3%6% 8% 2% Construction minus Residual Value NPC 87% 2% 4% 5% 2% Routine inspection Detailed inspection Asphalt overlay
Patch repair (5% of surface) Construction and
Replacement
performed throughout the life cycle of the bridge deck. Table 6 provides estimated values of the duration of each activity (average for both ways); length of road affected during the activity (average for both ways), and reduced traffic speed during the activity. The traffic speed reduction should be estimated according to work zone traffic control guideline applicable in the jurisdiction of the project. Short duration activities (less than a day) are usually performed during non-rush hours. In such cases, the user cost calculated with the AADT might overestimate the actual user cost.
Table 6. User costs data
Activities Duration (days) Length affected (km) Reduced traffic speed (km/hr) Routine inspection 0.35 0.2 70 Detailed inspection (potential survey ) 0.5 0.5 50 Asphalt overlay 1.5 1 50 Patch repairs 2.5 1 50 Replacement 15 1 50
The travel delay costs depend on:
length of highway affected by the activity (km); traffic speed during activity (km/hr);
normal traffic speed (km/hr); duration of the MRR activity (days);
annual average daily traffic (AADT) and annual average daily truck traffic (AADTT); and average values of automobile and truck drivers time, which were assumed as $12/hr, and
$20 /hr, respectively (Walls and Smith 1998).
The vehicle operating costs depend on the above parameters and the hourly vehicle operating cost, which is assumed as $8.85/hr for both passenger automobiles and trucks (Ehlen and Marshall 1996).
The accident or crash costs depend on the above parameters, as well as the accident rates during normal operation of the bridge and during the (MRR) activity, and the average cost per accident. An average cost per accident, including all types of collisions (damage only, non-fatal injuries and fatalities), is estimated at $22,500 based on accident cost data published in 1994 (Transport Canada) indexed to 2006 $, and the profile of collisions in Canada (Transport Canada 2006). From the total number of collisions and the estimate of the vehicle-kilometers in Canada in 2003, a normal accident rate of 2.1 is obtained and assumed to be similar in 2006. Although it is known that accident rates are significantly higher in work zones than in non-work zones, there is a limited amount of data on crash history in work zones and the difficulty of obtaining work zone
accident rate in terms of vehicle-kilometres is even greater. A rule of thumb of three times the normal accident rate is suggested by Walls and Smith (1998) although acknowledging that there is not much statistical research data to support it. A work zone accident rate of 6 is used for the user costs analysis.
The present value of life cycle user costs (PVLCCu), calculated with Eq. 3., is presented in Fig. 5.
For the NPC deck, the PVLCCu is $53/m2 and forthe HPC deck containing SCMs, the PVLCCu
is $16/m2. The traffic delay costs, vehicle operating costs and accident costs represent
respectively 44%, 28% and 28% for both types of decks, as shown in Fig 5. Different cost data or accident rates would result in a different breakdown between the three types of user costs. For example, the average accident cost in this example was calculated using a value of statistical life (VOSL) of $1.6M (Transport Canada 1994). Estimation of VOSL can vary from $0.16M to $33M (Dionne and Lanoie, 2004). Using a VOSL of $5M would increase the average accident cost to $40,700 considering that collisions with fatalities represent 0.4% of the total number of collisions (in 2003). In that case, accident costs would be the main user cost component with 42%
of the total for both types of deck. The total PVLCCu would then soar to $65/m2 for the NPC
deck and $20/m2 forthe HPC deck.
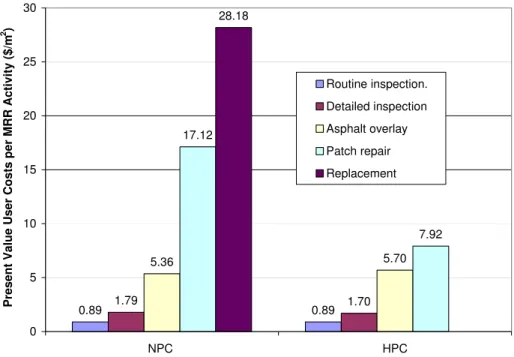
From Fig. 6, it is observed that the reduction by 70% of the user cost for the HPC deck is mainly the result of the difference in frequency and schedule of patch repairs and the need for replacement of the NPC deck during the life cycle period (calculated with a VOSL of $1.6M). This same reduction is observed for a VOSL value of $5M.
53.35 16.21 23.51 7.07 14.86 4.47 14.98 4.67 0 10 20 30 40 50 60 NPC deck HPC deck
Present Value User Costs ($/m
2 )
Total User Costs Delay Costs
Vehicle Operating Costs
Accident Costs
0.89 1.79 0.89 1.70 5.36 5.70 17.12 7.92 28.18 0 5 10 15 20 25 30 NPC HPC P resent V a
lue User Costs per M
RR Activity ($/m 2 ) Routine inspection. Detailed inspection Asphalt overlay Patch repair Replacement
Fig. 6. Present Value of Life Cycle Users Costs for different MRR activities
4. Environmental Impacts of HPC and NPC Bridge Decks
The construction of HPC structures incorporating SCMs enables to achieve durable structures that will require fewer maintenance and repair actions over their life cycles when compared to NPC structures. This reduction in the number of maintenance and repair actions will result in a
reduction in both materials and energy consumption as well as in a reduction of CO2 emissions
and waste production. A simplified life cycle environmental analysis of the two bridge decks is
undertaken by focusing on two impacts: (i) emissions of CO2; and (ii) waste production (or
landfill use). These environment impacts are quantified in their own type of units due to the complex issue of assessing economic values. It is possible to use multi-criteria optimization approaches to assess the efficiency of the HPC deck in terms of cost, environmental impacts, etc. (Lounis 2005).
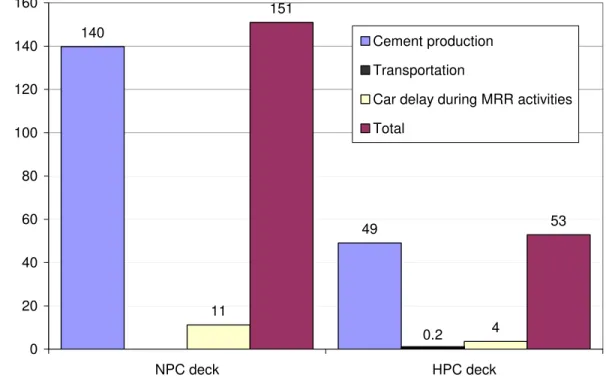
The emissions of CO2 produced during the life cycle of the NPC and HPC decks are shown in
Fig. 7 and include some of the major components that outline the difference between the two alternatives:
SCMs are industrial waste products that replace part of the cement. A reduction of one ton
of cement leads to a reduction of 0.8-1.3 ton of CO2. No additional emissions of CO2 for
the use of SCMs in concrete mix unless it needs to go through beneficiation processes.
Additional transportation for non-locally available SCMs - 0.022 ton of CO2 per ton of
SCM over a distance of 1000 km (Bouzoubaâ and Fournier 2003).
Reduced maintenance, repair and rehabilitation activities on HPC decks reduce the traffic
The CO2 released by the production of reinforcing steel is not included but would typically be the
same for both deck alternatives. In the example, the CO2 emissions associated with the
construction and rehabilitation of normal concrete deck are three times higher than those associated with HPC decks. This difference is mainly due to the shorter service life of the normal deck (the deck is completely replaced after 15 years), which also leads to an increase in traffic disruption.
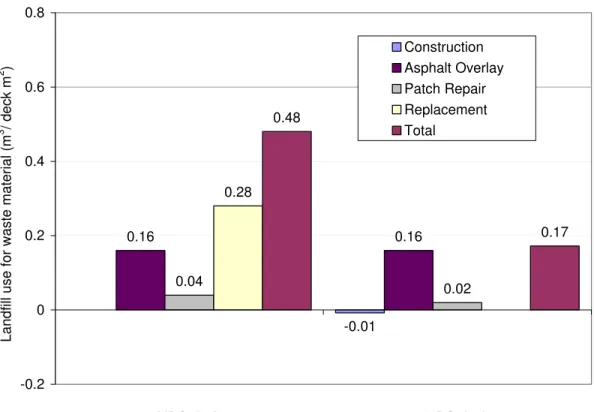
A comparison of the waste produced (or landfill use) for the two deck alternatives is shown in Fig. 8, which includes the volume of waste material produced during the replacement of asphalt overlay, patch repair and deck replacement. The volume of SCM (recycled waste material) not sent to the landfill is shown as a negative value on Fig. 8. Due to the replacement of the normal concrete deck after 15 years, the production of waste materials is much higher for this alternative. Although not exhaustive, the life cycle analysis of the two environmental impacts has shown that the service life of the concrete deck is a key factor. The need for repair and rehabilitation is also a factor and it is implicitly included in the service life of bridge decks. The use of HPC deck containing SCMs has a positive effect on the environment.
140 49 0.2 11 4 151 53 0 20 40 60 80 100 120 140 160 NPC deck HPC deck CO 2 emissions (kg/deck m 2 ) Cement production Transportation
Car delay during MRR activities Total
-0.01 0.16 0.16 0.04 0.02 0.28 0.48 0.17 -0.2 0 0.2 0.4 0.6 0.8 NPC deck HPC deck
Landfill use for waste material (m
3 / deck m 2 ) Construction Asphalt Overlay Patch Repair Replacement Total
Fig 8. Volume of waste materials from HPC and NPC bridge decks
5. Impact of discount rate on life cycle cost
The discount rate for the LCCA was selected based on the values of the official bank rate published by the Bank of Canada for the last five years. For a more complete analysis, a sensitivity study should be performed on the LCCA results to assess the impact of the discount rate on LCC. Figure 9 presents the effects of the discount rate variation on the agency PVLCC for
the NPC and HPC decks (in-place cost of HPC = $900/m3). The cost of the HPC deck increases
from 60% to 70% of the cost of the NPC deck, as the discount rate is increased from 3% to 5%. The tendency of a higher PVLCC with an increase discount rate for HPC deck indicates that a large proportion of the agency costs is incurred at construction time.
The user PVLCCs were also calculated using a discount rate of 3%. It is however arguable that discounting (based on money investment principle) can be directly applied to user costs that are evaluated from average salary, value of statistical life, fuel energy, etc. For user costs, the effect of discount rate should be studied on a wider range and different “discount rate” or actualisation factor could possibly be applied to the different types of user costs reflecting separately the influence of time on the cost figure metrics.
NPC
HPC
Fig 9. Sensitivity analysis of the agency life cycle cost to discount rate
For the comparison of environmental impacts, future impacts were treated the same as present ones, i.e. no actualisation factors were used. The rationale of this method was that:
Impacts were not expressed in terms of dollars; and
Even though a financial value could sometimes be estimated for such impacts, it is quite doubtful that environmental impacts follow economic principles.
It is possible to use multi-criteria decision theory to compare simultaneously conflicting and incommensurable criteria such as costs and environmental impacts.
6. Concluding Remarks
The use of HPC results in a bridge deck with an extended service life and reduced life cycle cost when compared to NPC bridge decks. Furthermore, the HPC bridge deck has a better
environmental profile with reduced CO2 emissions and lowered waste production. From the
example presented in this paper, the following conclusions can be drawn:
In terms of durability, and based on the onset of corrosion as the end of service life criterion, the HPC deck alternative incorporating SCMs has a service life that can vary from 3 to 10 times the service life of normal concrete deck having the same water-to-cementitious materials ratio.
In terms of life cycle costs, the HPC deck alternative is found to be more economic in terms of both agency costs and user costs. The agency life cycle cost for the HPC deck alternative is 40%-45% lower than that of the NPC deck alternative; while the user life cycle cost of the HPC deck is 1/3 that of the HPC deck.
In terms of environmental impact, it is estimated that the HPC deck alternative yields a
reduction of 65% in the CO2 emissions compared to the normal concrete deck.
This example provides a good illustration of the engineering, economic and environmental benefits of using high performance concrete incorporating supplementary cementing materials for the construction and rehabilitation of bridge decks.
REFERENCES
Bamforth, P.B. (1993). “Concrete classifications for RC structures exposed to marine and other
salt-laden environments”. Proc. of 5th Int. Conf. on Structural Faults and Repair, Vol. 2,
Edinburgh, pp.31-40.
Bouzoubaâ, N, Bilodeau, A., Sivvasaundaram, V, and Fournier, B. (2002). Development of
Ternary Blends for High Performance Concrete. MTL 2002-5 (TR-R).
Crank, J. (1975). The Mathematics of Diffusion (2nd ed.), Oxford University Press, London, 414
pp.
Dionne, G. and Lanoie, P. (2004). “ Public choice about the value of a statistical life for cost-benefit analysis – The case of road safety”. Journal of Transportation Economics and Policy, Vol. 38, Part 2, pp.247-274.
Ehlen, M.A., and Marshall, H.E. (1996). The economics of new technology materials: A case study of FRP bridge decks. NISTIR 5864, pp. 67.
Golabi, K., Thompson, P.D., and Hyman, W.A. (1993). “Pontis- version 2.0: Technical manual: a network optimization system for bridge improvement and maintenance.” Report FHWA-SA-93-031, Federal Highway Administration, Washington, D.C.
Hawk, H. (2003). Bridge Life-Cycle Cost Analysis. NCHRP Report 483, Transportation Research Board, Washington, D.C.
Lounis, Z. (2005). "Network-level bridge management using a multiobjective optimization decision model," 1st CSCE Specialty Conference on Infrastructure Technologies, Management and Policy (Toronto, ON. June 02, 2005), pp. 121-1 - 121-9.
Pedersen, V,. and Arntsen, B. (1998). “Effect of early-age curing on penetration of chloride ions
into concrete in the tidal zone”. Proc. of the 2nd Intl. Conf. on Concrete under Severe
Conditions, CONSEC ’98, Tromso, Norway, June 21-24, 1998, pp. 468-477. Richard, G. (2005). Private communication.
Statistics Canada. (2003). Canadian Vehicle Survey, Cat. No. 53-223-XIE. Transport Canada. (2006). Road Safety in Canada – 2003. TP 13951E.
Transport Canada. (1994). Guide to Benefit-Cost Analysis in Transport Canada. TP11875E. Walls, J., and Smith, M.R. (1998). Life Cycle Cost Analysis in Pavement Design. Interim
Technical Bulletin, Publication No. FHWA-SA-98-079, 107 PP.
Weyers, R.E. et al. (1994). Concrete Bridge Protection and Rehabilitation: Chemical and
Physical Techniques - Service Life Estimates. SHRP-S-668, Strategic Highway Research Program, National Research Council.
Yang C.C. and Wang, L.C.2004. “The diffusion characteristic of concrete with mineral admixtures between salt ponding test and accelerated chloride migration test”. Materials