Publisher’s version / Version de l'éditeur:
Polymer Engineering and Science, 50, 4, pp. 819-825, 2009-11-24
READ THESE TERMS AND CONDITIONS CAREFULLY BEFORE USING THIS WEBSITE. https://nrc-publications.canada.ca/eng/copyright
Vous avez des questions? Nous pouvons vous aider. Pour communiquer directement avec un auteur, consultez la
première page de la revue dans laquelle son article a été publié afin de trouver ses coordonnées. Si vous n’arrivez pas à les repérer, communiquez avec nous à PublicationsArchive-ArchivesPublications@nrc-cnrc.gc.ca.
Questions? Contact the NRC Publications Archive team at
PublicationsArchive-ArchivesPublications@nrc-cnrc.gc.ca. If you wish to email the authors directly, please see the first page of the publication for their contact information.
NRC Publications Archive
Archives des publications du CNRC
This publication could be one of several versions: author’s original, accepted manuscript or the publisher’s version. / La version de cette publication peut être l’une des suivantes : la version prépublication de l’auteur, la version acceptée du manuscrit ou la version de l’éditeur.
For the publisher’s version, please access the DOI link below./ Pour consulter la version de l’éditeur, utilisez le lien DOI ci-dessous.
https://doi.org/10.1002/pen.21593
Access and use of this website and the material on it are subject to the Terms and Conditions set forth at
An improved method for single fiber tensile test of natural fibers
Hu, Wei; Ton-That, Minh-Tan; Perrin-Sarazin, Florence; Denault, Johanne
https://publications-cnrc.canada.ca/fra/droits
L’accès à ce site Web et l’utilisation de son contenu sont assujettis aux conditions présentées dans le site
LISEZ CES CONDITIONS ATTENTIVEMENT AVANT D’UTILISER CE SITE WEB.
NRC Publications Record / Notice d'Archives des publications de CNRC:
https://nrc-publications.canada.ca/eng/view/object/?id=b56b799d-65e1-42d0-b543-aea9d87cc4dd https://publications-cnrc.canada.ca/fra/voir/objet/?id=b56b799d-65e1-42d0-b543-aea9d87cc4dd
An Improved Method for Single Fiber Tensile Test
of Natural Fibers
Wei Hu, Minh-Tan Ton-That, Florence Perrin-Sarazin, Johanne Denault
Industrial Materials Institute, National Research Council of Canada, Boucherville, Quebec, Canada J4B 6Y4
An improved Single Fiber Tensile Test (SFTT) for the natural fibers was depicted. Natural fibers have irregu-lar shape, and are not uniform along the fiber length and also from one fiber to another. Applying the con-ventional method, which determine the fiber cross-sec-tion by measuring the fiber diameter using optical mi-croscopy, will result in inaccurate properties of the nat-ural fibers with large standard deviation (SD). In the proposed new SFTT method, an accurate cross-sec-tion area could be obtained from the Scanning Electron Microscope observation of a flat and clear fractured end surface of carefully selected tensile-tested fibers and calculated using imaging analysis. Applying this new approach, tensile strength of different types of flax fiber, including bast fiber, enzyme-retted and water-ret-ted fiber provided SD of less than 11%, while those of these fibers determined by the conventional approach had SD of over 24%. POLYM. ENG. SCI., 50:819–825, 2010.
ª2009 Society of Plastics Engineers
INTRODUCTION
Natural fibers such as flax, hemp, and sisal possess the advantages of good mechanical properties, renewability, environmental friendliness, and also economical feasibil-ity. Therefore, they have been receiving more attention for the past two decades as reinforcements for polymer matrix composites [1]. However, the natural fibers present the disadvantages of quality inconsistence due to local cli-mate, growth conditions, and nature of retting process (dew retting, enzyme treatment, etc) [2, 3]. In addition, in order to improve the adhesion between the nature fiber and matrix, various chemical pretreatments (alkali, acetic anhydride, silane, etc.) [4, 5] have also been used to treat the fiber surface. Accurate and reliable measurement of the tensile strength of natural fibers by feasible technique, thus, becomes crucial for the comparison between
differ-ent kind of fibers and also for the prediction of mechani-cal property of their composites.
Single fiber tensile test (SFTT) is the most widely applied method for the measurement of the tensile proper-ties of fibers [6–10]. Although this method provides ac-ceptable strength and modulus for synthetic fibers, it fails to provide accurate results with low standard deviation (SD) for natural fibers.
In this article, challenges and limitations of SFTT for natural fibers are reviewed and discussed. A new approach to measure the tensile properties of natural fiber was then described. Different kinds of flax fiber were used to validate the method, and the results of the meas-urements are reported.
IMPROVED SFTT METHOD FOR NATURAL FIBERS
Challenges and Limitations of SFTT Carried on Natural Fibers
SFTT was first developed to determine the tensile properties of synthetic fibers (ASTM D 3822-01). In this method, the calculation of the fiber cross-section area is done assuming that the fiber is considered perfectly round, which is true for most synthetic fibers. Optical micros-copy (OM) is commonly used to determine the fiber di-ameter before testing. From the force at which a single fiber fails under the tensile test, the tensile strength of a single fiber can be easily obtained. As most synthetic fibers are fabricated under a well-controlled and opti-mized process, they are uniform and almost perfectly round. The conventional SFTT provides good and reliable tensile properties for synthetic fibers.
However, the natural fibers are quite different from the synthetic fibers. Natural technical fiber often consists of a bundle of elementary fibers, which results in an irregular shape depending on the number of elementary fibers and the way by which they are packed together. Figure 1a presents a typical OM image of the morphology of the seed oil flax fibers, showing cross-sections of both techni-cal and elementary fibers. In addition, the cross-section of elementary fiber is not perfectly round. Thus, the fiber
Correspondence to: Minh-Tan Ton-That; e-mail: Minh-Tan.Ton-That@ imi.cnrc-nrc.gc.ca
Contract grant sponsor: National Science and Engineering Research Council Canada.
DOI 10.1002/pen.21593
Published online in Wiley InterScience (www.interscience.wiley.com).
V
diameter observed under OM can vary a lot depending on the view it is observed. For example, flax ultimate fibers possess a polygonal shape with five to seven sides, and the transversal dimensions can be in the wide range of 5–76 lm [11, 12]. Furthermore, the natural fibers also can present a hollow structure, called lumen, which looks like a small open channel in the centre of the cell and maybe affect the actual fiber area under a mechanical loading [13, 14].
Due to its irregular shape and its nonuniformity along the fiber axis, it is difficult to obtain a good focus on the fiber image under OM to determine the fiber diameter. As shown in Fig. 1b, it is not easy to achieve a good focus of such stack of elementary fiber bundle, and its di-ameter size could be 50% different along the same ele-mentary fiber. The average value of five or more apparent diameters measured at different locations along the fiber was proposed to overcome such problem. However, the fiber is supposed to fail at the location having highest stress concentration. Such location has the smallest cross-section if no more significant defects exist in other pla-ces. Thus, such suggestion could not really solve the
problem. Also, there are always natural and artificial flaws or defects along the natural fibers, it is neither cer-tain that the fiber failure will take place at the location having smallest cross-section area [15, 16] since failure will possibly occur where the defect is situated during tensile test. For example, it has been reported that the probability of fiber break at minimum diameter was actually quite low, in the range of 40–60% [17]. Finally, the fiber splitting can take place depending on the packing and alignment of the elementary fibers in the technical fiber, and also how the whole fiber is gripped in the cross-head. Splitting and misalignment of elemen-tary fibers in one single technical fiber could also be observed in Fig. 1b. To summarize, conventional SFTT approach fails to accommodate the irregularity and com-plexity of natural fibers, especially in the cross-section area determination. Therefore, it is not surprised that this method often results in an inaccurate value of tensile strength with very high SD value for the natural fibers even tests could be conducted with a large number of samples. It is really necessary to improve the SFTT method to obtain more precise tensile strength for the natural fibers.
Improved SFTT Method
The improved SFTT involves modifications of the SFTT, which are described below. These modifications focus on (1) the selection of fibers for testing and (2) the accuracy of cross-section area determination of natural fibers.
Sample Selection for Testing
As discussed earlier, fiber splitting before and during testing have tremendous effect on the results, thus such results do not reflect well the fiber quality and should be discarded. First, single technical flax fibers without split-ting were carefully selected by hand then by OM. Fibers with apparent defects should also be removed in this pro-cess, if such defects are not representative for the fiber nature. In addition, contaminated fibers would result in an obscured cross-section image thus introducing error on the determination of cross-section area, and they should be removed too.
Fiber Tensile Testing Procedure
The preselected fibers are tested according to ASTM D 3822-01 on a standard mechanical testing system at a desire temperature and condition. Both fiber ends were attached on a piece of tape, respectively, for easy han-dling and gripping on the test heads. The force-strain curve of the fiber is recorded during the test, and this will be used to determine the fiber properties in the next step.
FIG. 1. (a) OM image of fiber cross-section; (b) SEM image demon-strating splitting and misalignment of elementary fibers in a single tech-nical fiber.
Cross-section Area Determination
To determine the tensile strength and modulus of the fibers, an accurate cross-section area must be obtained. As the fiber failure is very brittle and its elongation at break is very low (less than 2%), it can be considered that the cross-section area of the fiber at the failure location does not change significantly after failure. After testing, the fractured fibers with appropriate fracture end were selected for the cross-section area calculation. This selec-tion was done by microscopical observaselec-tions to discard fracture end that split into fibril fibers, and keep brittle fracture end without splitting for the further cross-section area determination.
It is important to obtain a flat and clear cross-section of the fiber fracture end to improve the accuracy of cross-section area. Therefore, the tested fiber was carefully attached on a tape, perpendicularly to the edge of the tape. OM coupled with Visilog 5.4 software was utilized to determine the distance between the edge of fiber frac-ture end and tape, thus, to determine the optimum loca-tion at which the samples should be cut for a good pre-sentation of the cross-section and also a clear image.
To prevent the further movement of the fiber, it was fixed between two strong Polyethylene (PE) films (as
sup-porting film). The edge of tape with fracture end and PE films end were tried to be placed on the same plane. The size of the PE films had to be fit to the mold, then the sample was mounted with epoxy resin using the mixture of Epofix resin and Epofix hardener (Struers Company) with the ratio of 15:2 (v/v) and cured at room temperature for 24 h. Proper size of the PE films could prevent the sample moving in the epoxy liquid to avoid a tilted cross-section.
The embedded sample was finally microtomed accord-ing to the distance measured earlier by OM between the edge of tape and the fracture fiber end. More than one cut should be performed to ensure a good representation for the cross-section as necessary. Scanning Electron Micro-scope (SEM) was used to get cross-section image of fiber fracture end (Fig. 2a) with high accuracy.
From the SEM image, the borderline of the cross-sec-tion was traced out using the Adobe Photoshop 4.0 LE software carefully. Figure 2b shows the corresponding boundary line obtained from Fig. 2a. Finally, the accurate value of total cross-section area could be obtained auto-matically using Image-pro Plus 4.5.1.27 software accord-ing to the borderline. The hollow structure (lumen) could be seen clearly in some elementary fibers as shown in Fig. 2a; however, their area could be ignored because it was at the most 1.5% of the total area.
Calculating Tensile Strength and Modulus
As the cross-section area of the fiber is determined and its corresponding force-elongation is obtained from the test, the tensile properties of the fiber can be easily eval-uated according to the ASTM D 3822-01.
EXPERIMENTS
Three types of flax fibers including bast flax (F1), flax retted by enzyme (F2E), and water-retted flax (F2R) were used in this study. F1 was kindly supplied by
Schweitzer-FIG. 2. (a) SEM image of flat cross-section image after cutting proce-dure; (b) the boundary line of cross-section in (a) traced out using Adobe Photoshop 4.0 LE software.
Mauduit Company, F2E and F2R were kindly provided by Biotechnology Research Institute, National Research Council, Canada. A tensile machine Instron 5548 Micro-tester was used for tensile tests. Bausch & Lomb Optical Microscopy coupled with a COHU high performance color CCD camera was utilized in the improved method for fiber selection. It was also used to determine the cut-ting size in the cutcut-ting procedure and the fiber diameter with the aid of Visilog 5.4 software during conventional SFTT. A Reichert-Jung 2050 Supercut Microtome was used in the cutting procedure. JEOL JSM-6100 SEM working at a voltage of 10kV was utilized to select the good fracture end and determine the cross-section area with the aid of Image-pro Plus software.
The following SFTT were conducted according to ASTM D 3822-01 at room temperature. Tensile tests were performed on the carefully selected flax fibers (as described in previous section). Both fiber ends were glued on a piece of tape, for easy handling and fastness on the grips. In this work, a grip length of 9 mm and a gauge length of 50 mm were used for testing. A trans-lation speed of 120 mm/min was applied in all the tests.
Conventional SFTT
The conventional method of diameter measurement for the calculation of cross-section area was carried out in comparison with the improved method on the care-fully selected fibers. The diameter of 20 specimens for each type of fibers was determined under OM before testing. Two diameter-determination methods were exam-ined. One was to measure the average fiber diameter at five different random locations on the fiber; the other one was to measure the smallest diameters along the fiber. The obtained diameter, D, value of both methods were utilized to calculate the cross-section area using equation of area ¼ p D2/4 for the final mechanical data analysis, respectively. In addition, test on fiber bundle composed of 20 manually random selected technical
fibers was also performed and five bundles were tested for each fiber type. The cross-section area of the fiber bundle was calculated from the sum of the cross-section area of the individual technical fiber, which was deter-mined based on the average diameter via OM as describe earlier.
Improved SFTT
The test was conducted on the selected flax fibers using the procedure described in former section. As the improved SFTT method improves the accuracy and reproducibility of the test, but it requires a long pro-cess, six specimens with good fracture end were assumed to be fair enough to determine the tensile property of fibers.
RESULTS AND DISCUSSION
Conventional SFTT
Typical stress–strain curves of the flax fiber from the tensile test are given in Fig. 3. Excluding some slippage at the beginning of the test, the flax fibers exhibit a single linear elastic deformation until failure without plastic de-formation. Similar behavior and shape of plots could be found for the vegetable fibers reported in other works [18, 19]. The slightly slippage at the beginning of the test was difficult to control since the natural fiber is very weak. The behavior of flax fibers is very different from that of many synthetic organic fibers, which often contain plastic deformation following elastic deformation and also have great ductility [20]. The zero strain value was evaluated by carefully determining the beginning of the curve. All fibers show brittle failure with strain to failure of less than 2%.
The average diameters, tensile strengths, modulus, and strains of the F1, F2E, and F2R fibers including their SD values calculated from 20 specimens could be found in Table 1. It was noticed that the SD in average diameter
TABLE 1. Diameter, tensile strength, modulus, and strain values with SD values of flax fibers obtained from conventional method. The strain data was carefully evaluated according to the zero strain determination.
Diameter (lm) SD (lm) Strength (MPa) SD (MPa) Modulus (GPa) SD (GPa) Strain (%) SD (%) Average diameter value of five random locationsa
F1 99.0 34.0 205 87 48 29 1.71 0.94
F2E 58.6 11.3 591 249 57 22 1.43 0.90
F2R 65.3 12.7 701 224 54 23 1.75 1.94
Smallest fiber diameter valueb
F1 81.8 36.0 339 240 78 32 1.71 0.94
F2E 45.1 19.4 688 225 61 18 1.43 0.90
F2R 58.5 10.3 775 186 56 15 1.75 1.94
Fiber bundle testc
F2E — — 526 143 40 7 1.96 0.68
Conventional method usesaaverage diameter value of five random locations along the fiber andbsmallest fiber diameter, respectively, to calculate
the cross-section area, and alsocthe result from the conventional fiber bundle method.
for a single fiber specimen was very high and over 20% in all cases. It has been reported that the tensile strength and modulus of the flax fibers are within the range of 345–1035 MPa and 27.6–80 GPa, respectively [1, 21]. Most of mechanical properties reported in Table 1 are in agreement with the reported results except the strength of F1. The SDs for both strength and modulus are exception-ally very high, in most cases, it is over 30%; although specimens were carefully chosen for the test and a large number of specimens were used in the test aiming to reduce the SDs. A good question that needs to be answered at this point is whether the results reflect the real inhomogeneous nature of the natural fibers or the limitations of the conventional SFTT or both? One evi-dence, but not necessary the only reason, for the large SDs in strength for this test is due to the inaccuracy in measured diameters for each single fiber specimen. In the light that the tested fibers were carefully selected as illus-trated earlier to improve the uniformity of fiber itself, the inaccuracy of the diameter determined by the conven-tional testing method in diameter is possibly one of the major reasons resulting in a great SD in strength and modulus as they are reversely proportional to the diameter in a factor of power of 2 (r ¼ 4F/p D2).
To reduce the SD of the properties, one may try to replace the average diameter by the minimum value since fiber is likely to fails at the smallest cross-section. Table 1 also presents the results based on the minimum fiber di-ameter. The average strengths and modulus of F2E and F2R seem do not alter much, however, these of F1 are now in the range reported in the literatures [1, 21]. The SDs of these tests still remained large, which was possi-bly resulted from the inaccurate value obtained by OM measurement.
In addition, a bundle of 20 specimens of F2E was per-formed, and the results are given in Table 1. The obtained strength and modulus are smaller than the ones obtained from a test on single fibers. The SDs are still high, although they are smaller than those obtained from the test on single fibers, possibly due to the higher amount of testing specimens involved.
To reduce the SD, a larger number of specimens were also tested. Table 2 presents the results of the tensile strength of F2E, which were tested from 20 new speci-mens for the second time using the average diameter value of five random locations along the fiber to calculate
the cross-section area (denoted as F2E (2)). The average strength and SD obtained from the second test series for this sample is not very far from those obtained from the first test series (denoted as F1E (1)) but the maximum strength is significantly greater in the second test series. A combination of the two series of test for this sample (denoted as F2E (1 þ 2)) fails to improve significantly the SD.
As discussed earlier, the large SD in diameter is mainly due to the inaccuracy of the method used to deter-mine the fiber diameter in addition to the nonuniformity of the natural fiber itself. The OM image of the technical flax fibers F1 in Fig. 1a illustrates the irregular shape of flax fiber by which the OM observation of diameter could produce greatly different values depending on what angle the fiber was looked at. As seen in one typical fiber in Fig. 1a, the maximum diameter value could be as large as 45 lm, while the minimum value could be as small as 10 lm. Thus, this could lead to very different values of strength and modulus for this specific fiber. Due to this fact, it is unable to conclude that which approach among the ones presented here should be better or more reliable. As the fiber was carefully selected before test to limit effects of fiber nonuniformity and defects on results, the problem should be mainly due to the poor approach of fiber cross-section determination.
Improved SFTT
As the fiber fracture is a brittle mode in the test and the fiber strain at break is limited to 2% (Fig. 3), it can be assumed that the cross-section area after break does not significantly differ from that before fracture. There-fore, the fiber cross-section area at the fracture location can be determined after the test. However, in some cases, due to the hollow structure of elementary fibers and the brittle nature of natural fiber, the fiber boundary can be deformed or split after mechanical test. Other researchers also reported the images of such cases for other kinds of natural fibers such as hemp, sisal, and abaca [19]. Thus, it is too difficult to identify the boundary of the fibers. As a consequence, preparation of the fiber fracture end for ob-servation as previously described is important. Because the elementary fibers are uniform along the fiber axis for a certain range (counting from the fracture end), it is
TABLE 2. The reproducibility of conventional method, as shown by the maximum, minimum, average tensile strength, and SD values obtained from the conventional method.
Number of testing specimen rmax (MPa) rmin (MPa) raverage (MPa) SD (MPa) (%) F2E(1) 20 974 123 560 256 46 F2E(2) 20 1216 229 623 244 39 F2E(1 þ 2) 40 1216 123 591 249 42
TABLE 3. Corresponding calculated diameter, tensile strength, modulus, and strain values of flax fibers obtained from improved method. The strain data was carefully evaluated according to the zero strain determination. Equivalent diameter (lm) SD (lm) Strength (MPa) SD (MPa) Modulus (GPa) SD (GPa) Strain (%) SD (%) F1 42.6 6.7 400.6 40.8 48.2 4.9 1.32 0.84 F2E 54.6 12.8 456.5 33.9 57.1 7.2 1.35 0.68 F2R 46.4 8.7 354.4 25.4 57.4 8.5 1.08 0.92
expected that the cutting will not contribute significant error on the cross-section area determination. The good microtomy can provide a clear flat cross-section image of fiber facture end, as shown in Fig. 2a. The fiber cross-sec-tion area is the sum of the cross-seccross-sec-tion areas of all ele-mentary fibers consisted in the tested technical fiber and the voids in the center of the elementary fiber was also taken into account. The high magnification and resolution of SEM coupled with image analysis could enhance greatly the precision. As clearly seen, this method pro-vides a most improved fiber cross-section area determina-tion for the SFTT.
Table 3 shows the equivalent diameter, tensile strength, modulus and strain, and their SD values of F1, F2E, and F2R obtained from the improved method. The cross-sec-tion area was calculated from that described earlier. From the obtained cross-section area, an equivalent diameter was also reported for comparison. The strengths obtained from this method are relatively lower than those obtained by conventional methods, whereas the modulus is not much different from them. The strains obtained from the new method are lower than the ones of the conventional methods, however, if SDs, which is independent of
cross-section area, were considered, those differences can be negligible. The strengths fail in the lower range of those reported in [1, 21]. The reason for the comparably lower strength value was due to the oilseed type as well as growing area, climate factors, and retting conditions.
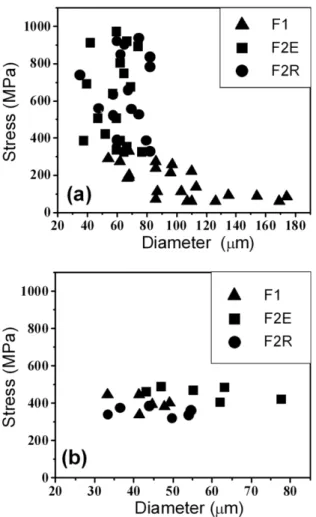
One significant result from Table 3 is SD. Although only six specimens were tested for each sample in this new method (while at least 20 specimens for the old methods), it provides sufficiently lower SDs, which is less than 15%. These SD values were also much lower than those in the literatures [6–10], where the conventional method was applied for the calculation of tensile strength of natural fibers. Figure 4a and b illustrate the improve-ment in accuracy and the statistics of the improved SFTT method over the conventional one applying the average diameter value of five random locations along the fiber to calculate the cross-section area.
CONCLUSIONS
The conventional SFTT method, which is based on the diameter measurement to determine the cross-section area involved in the tensile properties calculation, leads to inac-curate result with high SD in the case of natural fiber due to the irregular shape, nonuniform geometrical characteris-tics, nonconstant transverse dimension and flaws, and defects along the natural fibers. An improved method to obtain more precise tensile strength and modulus of natu-ral fibers was developed. This is based on the fine selec-tion of the fibers and the direct cross-secselec-tion area measure-ment at the failure location. A more reasonable number of samples (around six) needs to be tested to obtain reproduc-ible results. Efforts were focused on the fiber selection with good fracture end and the procedure and techniques to prepare samples for the determination of the cross-sec-tion area at the failure point. With this method, the accu-rate tensile strength of bast flax, enzyme-retted flax, and water-retted flax was measured to be 400.6 (6 40.8) MPa, 456.5 (6 33.9) MPa, and 354.4 (6 25.4) MPa, respec-tively, with the low SD of less than 11%.
ACKNOWLEDGMENTS
The authors acknowledge the Agriculture-Agri-Food Canada for the funding via CBIN program and ABIP pro-grams, and the National Research Council Canada (NRCC) for the funding via NBP-2 program. The author also would like to thank to the Biotechnology Research Institute (NRCC) and Schweitzer-Mauduit Canada for providing flax samples.
REFERENCES
1. A.K. Bledzki and J. Gassan, Prog. Polym. Sci., 24, 221 (1999).
2. D.E. Akin, J.A. Foulk, R.B. Dodd, and D.D. McAlister III, J. Biotechnol., 89, 193 (2001).
FIG. 4. The tensile stress as function of fiber diameter determined by (a) the conventional method; (b) the improved method.
3. W.H. Morrison III, D.D. Archibald, H.S.S. Sharma, and D.E. Akin, Ind. Crop. Prod., 12, 39 (2000).
4. T.T.L. Doan, S.L. Gao, and E. Ma¨der, Comp. Sci. Technol., 66, 952 (2006).
5. A. Arbelaiz, B. Ferna´ndez, G. Cantero, R. Llano-Ponte, A. Valea, and I. Mondragon, Compos. Part A, 36, 1637 (2005).
6. R. Joffe, J. Andersons, and L. Wallstro¨m, Compos Part A, 34, 603 (2003).
7. J.M. Park, S.T. Quang, B.S. Hwang, and K.L. DeVries, Comp. Sci. Technol., 66, 2686 (2006).
8. Y. Li and Y.W. Mai, J. Adhes., 82, 527 (2006).
9. N.E. Zafeiropoulos, G.G. Dijon, and C.A. Baillie, Compos. Part A, 38, 621 (2007).
10. M.P. Bhuwan and M.S. Mohini, Mat. Res. Innovat., 7, 231 (2003).
11. S.K. Batra, ‘‘Other Long Vegetable Fibers, Handbook of Fiber Science and Rechnology,’’ in Fiber Chemistry, Vol. 4, Marcel Dekker, New York, 507 (1998).
12. C. Baley, F. Busnel, Y. Grohens, and O. Sire, Compos. Part A, 37, 1626 (2006).
13. H.L. Bos and A.M. Donald, J. Mater. Sci., 34, 3029 (1999). 14. K. Charlet, C. Morvan, J. Bre´ard, J. Jernot, and M. Gomina,
Revue des Composites et des Mate´riaux Avance´s, 16, 11 (2006).
15. G.C. Davies and D.M. Bruce, Text. Res. J., 68, 623 (1998). 16. A. Arbelaiz, G. Cantero, B. Ferna´ndez, I. Mondragon,
P. Gan˜a´n, and J.M. Kenny, Polym. Compos., 26, 324 (2005). 17. W. Yu, R. Postle, and H. Yan, J. Appl. Polym. Sci., 90,
1206 (2003).
18. A. Nechwatal, K.P. Mieck, and T. Reumßmann, Comp. Sci. Technol., 63, 1273 (2003).
19. A. Baltazar-y-Jimenez, M. Bistritz, E. Schulz, and A. Bis-marck, Comp. Sci. Technol., 68, 215 (2008).
20. P. Colomban, J.M. Herrera Ramirez, R. Paquin, A. Marcel-lan, and A. Bunsell, Eng. Frac. Mech., 73, 2463 (2006). 21. X. Li, L.G. Tabil, and S. Panigrahi, J. Polym. Environ., 15,