HAL Id: hal-00830066
https://hal.inria.fr/hal-00830066
Submitted on 4 Jun 2013HAL is a multi-disciplinary open access archive for the deposit and dissemination of sci-entific research documents, whether they are pub-lished or not. The documents may come from teaching and research institutions in France or
L’archive ouverte pluridisciplinaire HAL, est destinée au dépôt et à la diffusion de documents scientifiques de niveau recherche, publiés ou non, émanant des établissements d’enseignement et de recherche français ou étrangers, des laboratoires
Phenotyping progenies for complex architectural traits:
a strategy for 1-year-old apple trees (Malus x domestica
Borkh.)
Vincent Segura, Christian Cilas, François Laurens, Evelyne Costes
To cite this version:
Vincent Segura, Christian Cilas, François Laurens, Evelyne Costes. Phenotyping progenies for complex architectural traits: a strategy for 1-year-old apple trees (Malus x domestica Borkh.). Tree Genetics and Genomes, Springer Verlag, 2006, 2 (3), pp.140-151. �10.1007/s11295-006-0037-1�. �hal-00830066�
Phenotyping progenies for complex architectural traits:
1 2 3 4 5 6 7 8 9 10 11 12 13 14 15A strategy for 1-year-old apple trees (Malus x domestica Borkh.)
Segura V.(1)*, Cilas C.(2), Laurens F.(3) & Costes E.(1)
(1) UMR Biologie du Développement des Espèces Pérennes Cultivées – Equipe Architecture et Fonctionnement des Espèces Fruitières, INRA - AGRO Montpellier; 2 place Pierre Viala 34060 Montpellier Cedex 1 – France
(2) CIRAD, TA 80-03; avenue Agropolis, 34398 Montpellier – France
(3) UMR Génétique et Horticulture, INRA - INH - Université d’Angers; 42 rue Georges Morel, BP 57, 49071 Beaucouzé Cedex, France
* Corresponding author: Evelyne Costes, tel: 33 4 99 61 25 15 fax: 33 4 99 61 26 16 email: costes@ensam.inra.fr 16 17 18 19 20 21 22 23 24 25
ABSTRACT 26 27 28 29 30 31 32 33 34 35 36 37 38 39 40 41 42 43 44
The aim of this study was to define a methodology for describing architectural traits in a quantitative way on tree descendants. Our strategy was to collect traits related to both tree structural organization, resulting from growth and branching, and tree form and then to select among these traits relevant descriptors on the basis of their genetic parameters. Because the complexity of tree architecture increases with tree age, we chose to describe the trees in the early stages of development. The study was carried out on a one-year-old apple progeny derived from two parent cultivars with contrasted architecture. A large number of variables were collected at different positions and scales within the trees. Broad sense heritability and genetic correlations were estimated and the within tree variability was analyzed for variables measured on long sylleptic axillary shoots (LSAS). These results were combined in order to select heritable and not correlated variables. Finally, the selection of variables proposed combines topological with geometric traits measured on both trunks and LSAS: (i) on the trunk, mean internode length and number of sylleptic axillary shoots; (ii) on axillary shoots, conicity, bending and number of sylleptic axillary shoots born at order 3. The trees of the progeny were partitioned on the basis of these variables. The putative agronomic interest of the selected variables with respect to the subsequent tree development is discussed.
INTRODUCTION 44 45 46 47 48 49 50 51 52 53 54 55 56 57 58 59 60 61 62 63 64 65 66 67 68 69
Apple breeding programs aim primarily to develop productive cultivars with good fruit quality, and ensure pest and disease resistance (Lespinasse 1992). But, the consideration of tree architecture and shoot morphology traits is also considered as a promising manner to obtain trees that are adapted to training systems while reducing intrants and improving the control of vegetative development and yield regularity (Lespinasse 1992; Laurens et al. 2000). Usually, the introduction of traits which segregate in a quantitative way in selection schemes requires genetic studies to analyse their variability and to estimate the expected genetic improvement (Gallais 1989; Hill et al. 1998). To investigate the relationship between traits measured and genotypic effect, the concept of heritability has been introduced into quantitative genetics (Hanson 1963; Falconer 1981). However, accurate heritability estimates can be obtained only if it is possible to extend the phenotyping to many trees (Yao and Mehlenbacher 2000; Hardner et al. 2002; Chao and Parfitt 2003; Liebhard et al. 2003).
Great variability in tree habit has been demonstrated in apple cultivars, which have been qualitatively classified into 4 architectural types according to tree growth habit, distribution of branches and fruiting position (Lespinasse 1977). In the 1970s, the discovery of natural mutants with a columnar compact growth habit (Lapins 1974; Lapins 1976) led Lespinasse (1992) to modify this classification:.Type I is now composed of columnar cultivars (e.g. ‘Wijcik’); Type II is characterized by erect trees that mainly bear short shoots and by fruiting on spurs with alternate bearing (e.g. ‘Starkrimson’); Type III is composed of cultivars with medium to long shoots and an open branching angle (e.g. ‘Golden Delicious’); Type IV is characterized by weeping trees that mainly bear long shoots and by fruiting on medium and long shoots and production that is usually regular (e.g. ‘Granny smith’). Tree form can also be evaluated through the overall tree hierarchic organisation, using the concepts of hierarchy vs. polyarchy introduced by Edelin (1991)
70 71 72 73 74 75 76 77 78 79 80 81 82 83 84 85 86 87 88 89 90 91 92 93 94
and used to described two-year-old apple trees (De Wit et al. 2004). However, studies based on qualitative classification of the trees into types without precise and objective measurements may, as Hansche et al. (1972) argued, induce large errors in the estimation of genetic parameters. Over the last ten years more detailed architectural studies have been performed in different species, with a distinction between tree topology (i.e. relative position of the entities within the tree) and geometry (i.e. spatial position and form of the entities), and considering entities at different scales (Godin et al. 1999a). Regarding the topological organization in apple tree, the variability of branching patterns has been investigated for several cultivars along branches (Lauri et al. 1995) and trunks (Costes and Guédon 2002). Tree and branches form has also been investigated. A modeling approach carried out on three contrasted varieties of apricot tree, showed that the main factors involved in the final shoot form were first its initial geometry (in particular slenderness and inclination) and second the distribution of load along the shoot (Alméras et al. 2004). But these studies were performed on contrasted cultivars and genetic parameters of traits have not been investigated.
Regarding genetic studies for architectural traits in apple tree, accurate values of heritability have been estimated by studying several full-sib progenies, but only basic morphological traits such as trunk diameter were investigated (Tancred et al. 1995; Durel et al. 1998; Oraguzie et al. 2001). Recently Liebhard et al. (2003) estimated genetic and environmental variances and highlighted QTLs for growth (tree height and basis diameter) and phenological traits in an apple progeny. However, most of the genetic studies have been performed on the inheritance of the columnar trait suggesting that a single dominant gene called Co was implicated (Lapins 1974; Lapins 1976). Several genetic maps were drawn up for apple progenies deriving from a columnar parent and molecular markers close to the Co gene were found (Hemmat et al. 1997; Kim et al. 2003). Gradually, tree
96 97 98 99 100 101 102 103 104 105 106 107 108 109 110 111 112 113 114 115 116 117 118 119 120 121
in particular the branching process: (i) long shoots were shown to be relevant for partitioning adult trees belonging to a progeny derived from ‘Wijcik’ (type I) and ‘Baujade’ (type IV) (Godin et al. 1999b); (ii) main shoot growth and its branching characteristics were used to cluster a 1-year-old progeny deriving from ‘Telamon’ (type I) and ‘Braeburn’ (type III) (De Wit et al. 2002). But these studies did not investigate the genetic variability of traits. In addition, the Co gene was shown to have pleiotropic effects and could thus hide the variability of other architectural traits (Kenis and Keulemans 2004).
This study aimed at defining a method to describe tree architecture based on accurate and objective measurements which remain compatible with quantitative genetic studies carried out with large progenies and open new perspectives on Quantitative Traits Loci (QTL) research. In particular, the perennial structure of trees induces methodological difficulties in the phenotyping for architectural traits (Osorio et al. 2003; Jansson et al. 2005). Indeed, a diminution in primary growth in relation to tree age has been showed for different species and in different agronomic contexts (Barthélémy et al. 1997; Costes et al. 2003; Seleznyova et al. 2003). Because of these gradients, the successive years cannot be used as repetitions to separate genotype and environment effects. Furthermore, some traits are only transiently expressed in the course of tree development (e.g. sylleptic branching mainly expressed early before tree maturity is reached) while others are cumulated over years (primary and secondary growth). To account for these difficulties, we chose to start phenotyping the trees from the first year of growth when the structure is simple enough to investigate a large number of traits, measured on a large number of trees. This allowed us to consider both the topology and geometry of entities, at different positions and scales within the trees. The following questions were addressed: (i) which variables should be measured to point out the architectural variability ? (ii) should we measure either trunks or long sylleptic axillary shoots (LSAS) or both ? (iii) if LSAS have to be considered, how many should be measured per tree ? Among the large number of variables explored we then
made a selection based on the three following criteria: (i) high heritability value (ii) low genetic correlations between selected variables, and (iii) putative agronomic interest and easiness of measurement.
122 123 124 125
MATERIALS AND METHODS 125 126 127 128 129 130 131 132 133 134 135 136 137 138 139 140 141 142 143 144 145 146 147 148 149 150 Plant Material
The progeny under study was derived from a ‘Starkrimson’ x ‘Granny Smith’ cross. Parents were chosen for their contrasting architecture. According to Lespinasse (1992), the ‘Starkrimson’ maternal parent has an erect growth habit with many short shoots and a tendency to irregular production (type II). The ‘Granny Smith’ pollen parent is characterized by a weeping growth habit with long shoots and fruit bearing regularity (type IV).
In 2002, 125 seedlings were grown on their own roots for one year. At the beginning of 2003, grafts were taken on 3 successive nodes in the middle of the shoots from 50 plants selected at random. Three grafts were carried out for each of the 50 genotypes onto ‘Pajam 1’ rootstock to produce repetitions. Rootstocks were bought to nursery men and selected for their uniformity. ‘Pajam 1’ rootstock is a clonal selection of M9 which confers low vigor, a short juvenile period and substantial, regular productivity. The 150 trees obtained were planted in March 2003 at the Melgueil INRA Montpellier experimental station 5m x 2m apart in an east - west orientation. In order to study their architecture, the trees were grown with minimal training, i.e. trees were not pruned and the trunks were staked up to 1 m. They were regularly irrigated using a microjet system to avoid soil water deficits. Pests and diseases were controlled by conventional means in line with professional practices throughout the study.
Morphological and Architectural Description
A total of 149 trees were observed in January 2004 after the first year of growth (one tree had died). At that time, the trees were composed of a trunk, sometimes with rhythmic growth (i.e. meristem activity was periodic), and sylleptic axillary shoots (Figure 1). Three types of sylleptic axillary shoot were distinguished depending on their length: (i) long shoots (length ≥ 20 cm); (ii) brindles (5 cm ≤ length < 20 cm); spurs (length < 5cm). For
151 152 153 154 155 156 157 158 159 160 161 162 163 164 165 166 167
each of the 149 trees, observations were performed on the trunk and 4 long sylleptic axillary shoots (LSAS) when present. This led us to consider unbalanced dataset on LSAS.
A topological description of the trees was established using the coding method defined by (Godin et al. 1997). Four organization levels were distinguished, first the tree, second the axes, third the growth units (GU) and fourth the internodes. A geometrical description was based on the following variables: (i) length measured at the GU level; (ii) basis and top diameters measured on the trunk and LSAS; (iii) basis and top angles, cord measured on LSAS (Figure1).
These measured variables were used to calculate others aiming to provide descriptors as close as possible to biological processes such as internodes lengthening or bending. These calculations and further analyses were performed with AMAPmod software (Godin and Guédon 2003). Variables were divided into 2 categories whether they were related to tree geometry or to topology. Topological variables were organized into growth and branching variables (Table 1).
Statistical analysis
Broad sense heritability (h²b) has been defined as the ratio between genotypic variance and phenotypic variance (Hanson 1963):
2 P 2 G 2 b
h
=
168 169 170 171Where: ²G is genotypic variance, ²P is phenotypic variance.
If phenotypic variance is broken down into genetic variance and environmental variance, then broad sense heritability is given by:
)
(
h
2 e 2 G 2 G 2 b+
=
172174 175 176 177 178 179 180 181 182 183 184 185 186 187 188 189 190 191 192 193 194 195 196 197 198 199
As several LSAS were described on each tree, the mean value per tree was used to estimate individual heritability, i.e. at the level of the individual, while on trunks the measured values were used directly. The restricted maximum likelihood method (REML) (Corbeil and Searle 1976) was used to estimate both “genotype” and “error” variances since it is considered the most suitable procedure to estimate variance components for unbalanced data (Dieters et al. 1995). Individual broad sense heritability values were then calculated along with the associated standard deviations to obtain a confidence interval for the estimates (Agresti and Coull 1998). According to Gallais (1989), variables are considered as heritables if (i) their heritability value is greater than 0.2; (ii) the lower limit for the confidence interval of their heritability value is greater than 0. Within-tree variability was also estimated for variables measured on the LSAS in addition to the genotypic and error variances, and this to evaluate the stability of the variables within the trees. Moreover, in order to determine the minimal number of LSAS which should be described to obtain accurate values of individual broad sense heritability, this parameter was calculated by considering an increasing number of LSAS, from 1 to 4.
Then, relevant traits were selected to match 2 criteria. The first selection criterion was the broad sense heritability of traits and the associated confidence interval. The second was the genetic correlation between characters, since two variables with a significant genetic correlation can be predicted one from the other, and this allows the breeder to use only one variable, e.g. the easiest to measure (Gallais 1989). Genetic correlations were calculated between the variables using the average value by genotype (Hill 1971).
In order to define groups of trees with relatively similar architectures, the trees were partitioned for trunk and axillary shoot traits using the Partitioning Around Medoids (PAM) method (Kaufman and Rousseeuw 1990). Partition was performed on the relevant selected traits because we wanted to consider only heritable variables. Partition quality was evaluated by (i) the ratio between global within-cluster distance and global between-cluster
distance, and (ii) the partition mean silhouette value (Smean) (Kaufman and Rousseeuw 1990). The higher the S
200 201 202 203 204 205 206 207 208 209 210 211 212 213 214 215 216
mean value, the more separated the clusters. Cluster isolation was evaluated by (i) their diameter i.e. dissimilarity between the most dissimilar object of a cluster and (ii) their separation i.e. smallest dissimilarity between an object in the cluster and an object outside the cluster. Partitioning was performed from the dissimilarity matrix between trees (Kaufman and Rousseeuw 1990). Euclidean distances between trees were calculated from standardized data. For non branching trees, missing data for axillary shoots were replaced by the mean value for the variable. Finally, to investigate how the variables discriminated each cluster, an ANOVA study and a Newman and Keuls test were carried out between clusters.
Genetic correlations and genetic models of variance decomposition used to calculate h²b were performed using Proc Corr and Proc Mixed respectively in SAS v8 software (SAS Institute Inc 2000). Partitioning methods were those in the stat module of AMAPmod software (Godin and Guédon 2003). ANOVA and Newman and Keuls tests used to investigate the differences between clusters were performed using Proc GLM in SAS v8 software.
RESULTS 216 217 218 219 220 221 222 223 224 225 226 227 228 229 230 231 232 233 234 235 236 237 238 239 240 241
Broad sense heritability of traits
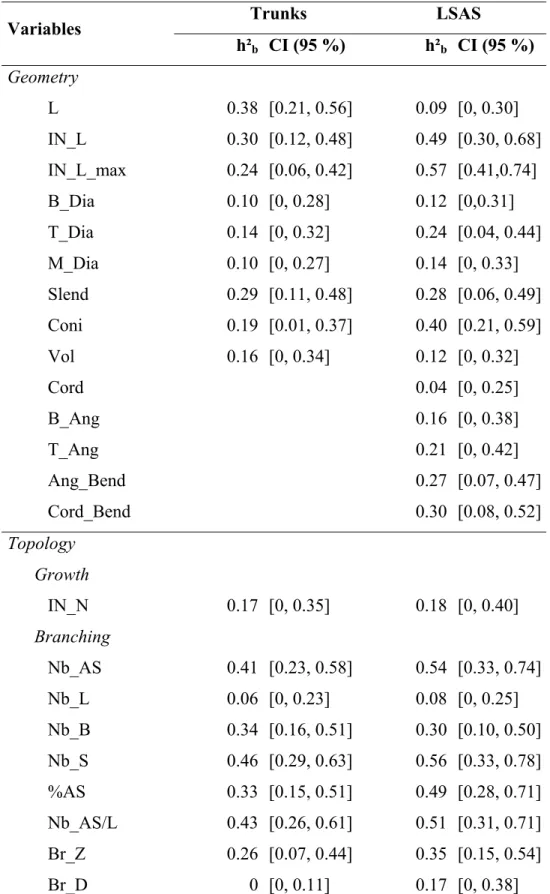
The geometrical variables measured on the trunks showed relatively low heritability values (Table 2). Among them, the highest values were found for variables related to the trunk length: length (L), mean internode length (IN_L), length of the longest internode (IN_L_max) and slenderness (Slend). All these variables had heritability values greater than 0.2 and the lower limit of their confidence interval was in excess of 0.1. Three branching variables showed high heritability values close to 0.4 and the lower limit of their confidence interval was greater than 0.2: number of axillary shoots (Nb_AS), number of spurs (Nb_S) and branching by length unit (Nb_AS/L).
Among the geometrical variables measured on LSAS, those which characterized internode length (IN_L, IN_L_max) and shoot conicity (Coni) showed the highest heritability values (0.5 and 0.4 respectively), and the lower limit of their confidence interval was greater than 0.2 (Table 2). Bending variables (Cord_Bend, Ang_Bend) and slenderness (Slend) showed intermediate values close to 0.3. In the same manner as for the trunks, many branching variables (Nb_AS, Nb_S, %AS, Nb_AS/L) measured on the LSAS were highly heritable (h²b close to 0.5, with the lower limit of the confidence interval close to 0.3).
By contrast, some volume-related variables (basis diameter – B_Dia, mean diameter – M_Dia and volume – Vol) and count-related variables (number of internodes – IN_N, number of long shoots – Nb_L, branching density – Br_D) showed low heritability values (h²b lower than 0.2) whether they were measured on trunks or the LSAS.
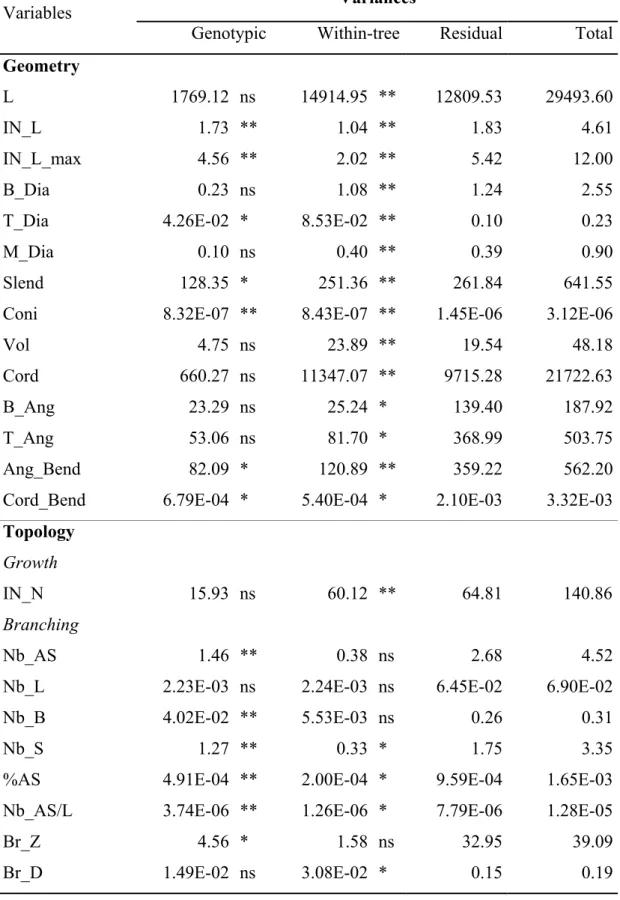
Within-tree variability of variables measured on the LSAS
A significant within-tree effect was observed for all geometrical variables (Table 3). But, several variables (mean internode length – IN_L, length of the longest internode – IN_L_max and cord bending – Cord_Bend) also showed genotypic variance that was
242 243 244 245 246 247 248 249 250 251 252 253 254 255 256 257 258 259 260 261 262 263 264 265 266
greater than the within-tree variance. Of the topological variables, some branching variables, such as number of axillary shoots (Nb_AS), number of long shoots (NB_L), number of brindles (Nb_B) or branching zone (Br_Z), were considered as stable because they did not show a significant within-tree effect. Excepted the number of long shoots (Nb_L), all these branching variables also showed a significant genotypic effect.
The individual broad sense heritability values were then estimated by considering an increasing number of LSAS per tree. Depending on the variable, 3 kinds of patterns were observed which are illustrated only for a selection of variables (Figure 2). The heritability values increased with the number of LSAS for many branching variables (e.g. number of axillary shoots – Nb_AS and number of brindles – Nb_B) and some geometrical variables (e.g. Conicity – Coni). All these variables showed a highly significant genotypic variance, while their within-tree variance was generally non significant or lower than the genotypic variance (Table 3). By contrast, the heritability values decreased when the number of LSAS considered increased for variables which showed a non significant genotypic variance while their within-tree variance was significant to highly significant (e.g. branching density – Br_D). In a third intermediate case, quite similar heritability values were obtained whatever the number of LSAS considered. This case includes variables with significant genotypic and within-tree variances (e.g. cord bending – Cord_Bend). For most of the variables considered in the study, the highest difference in heritability values was obtained between 1 and 2 LSAS considered (e.g. number of axillary shoots – Nb_AS, conicity – Coni, branching density – Br_D) even though, in several cases, the heritability value changed until 3 LSAS considered (e.g. number of brindles – Nb_B or top angle – T_Ang).
Correlations between variables
268 269 270 271 272 273 274 275 276 277 278 279 280 281 282 283 284 285 286 287 288 289 290 291 292 293
variables exhibited even higher genetic than phenotypic correlations. Significant genetic correlations were mainly observed between variables belonging to a same category, i.e. geometric or topological (Table 4). In fact, more than 80 % of the variables belonging to the same category showed significant genetic correlations on both trunks and LSAS. Significant genetic correlations were also observed between geometric and topological variables, for instance on trunks (i) between 2 variables that characterize growth: length (L) and number of internodes (IN_N) (r = 0.86); (ii) between a geometric and a branching variable: slenderness (Slend) and branching by length unit (Nb_AS/L) (r = - 0.55).
If the same variables are considered on both trunks and LSAS, most of the geometric variables, except slenderness (Slend) and conicity (Coni), showed strong genetic correlations one with the other (r ranged from 0.5 to 0.7). Topological variables showed significant genetic correlations for number of internodes (IN_N), number of axillary shoots (Nb_AS), number of spurs (Nb_S), percentage of branching nodes (%AS), number of axillary shoots by length unit (Nb_AS/L) and branching zone (Br_Z). However, these genetic correlations were fairly weak (r around 0.3) compared with the geometric variables.
Selection of relevant descriptors
High genetic correlations per category of variables make it possible to reduce redundancy and select variables that are representative of the different aspects of tree architecture, including both geometric and topological descriptors.
The geometric variables that characterize internode length (i.e. mean internode length – IN_L and length of the longest internode – IN_L_max) were the only ones to show elevate heritability values on both trunks and LSAS. Furthermore, mean internode length (IN_L) was more strongly correlated with other geometric variables than length of the longest internode (IN_L_max). We thus selected the mean internode length (IN_L) as a descriptor of trunk geometry. LSAS geometry was characterized by cord bending (Cord_Bend) and conicity (Coni) because: (i) their heritability values were high to
294 295 296 297 298 299 300 301 302 303 304 305 306 307 308 309 310 311 312 313 314 315 316 317 318
moderate; (ii) they showed a weak genetic correlation one with the other; (iii) they were not correlated with mean internode length (IN_L) on the trunks (Table 4).
Branching variables were highly heritable on both trunks and LSAS. These variables were strongly correlated one with the other when they were considered separately either on trunks or LSAS. In particular, the number of axillary shoots (Nb_AS) showed a strong genetic correlation with all the other branching variables measured on the same axis, either trunks or LSAS. Besides, the within-tree variability for the number of axillary shoots (Nb_AS) was not significant, unlike the number of spurs (Nb_S) and branching by length unit (Nb_AS/L). Finally, a weak genetic correlation was observed between the number of axillary shoots (Nb_AS) measured respectively on the trunks and on the LSAS (Table 4). For all these reasons, the number of axillary shoots (Nb_AS) were selected as relevant variables on both trunks and LSAS.
Thus, 5 variables were selected to describe both tree geometry and topology: (i) on trunks, mean internode length (IN_L_tr) and the number of axillary shoots (Nb_AS_tr); (ii) on LSAS, conicity (Coni_as), cord bending (Cord_bend) and the number of axillary shoots born at order 3 (Nb_AS_as).
Partitioning the trees of the progeny
The trees of the progeny were then partitioned on the basis of the mean standardized values of the 5 selected variables. Several partitions were performed with the number of clusters increasing from 2 to 8, called P2 to P8. The highest mean silhouette values were found for partitions P2 (Smean = 0.38) and P6 (Smean = 0.22). These partitions were also characterized by a ratio of 0.62 between global within-cluster dissimilarity and global between-cluster dissimilarity. In P2, the number of axillary shoots born at order 3 (Nb_AS_as) was the only variable used for cluster discrimination (data not shown). In P6, even though no clusters were clearly isolated (i.e. for each one diameter was higher than separation), significant
clusters were discriminated by LSAS variables, i.e. the number of axillary shoots born at order 3 (Nb_AS_as), cord bending (Cord_Bend_as) and conicity (Coni_as) (Figure 3). These clusters were characterized by the lowest number of trees and the highest separation values. Clusters 4, 5 and 6 were composed of 39, 34 and 42 trees respectively and their separation values were fairly low. Clusters 4 and 5 were discriminated by trunk variables, i.e. branching (Nb_As_tr) and internode length (IN_L_tr), while cluster 6 was characterized by low values for all 5 variables. The distribution of trees in a given genotype between the clusters was investigated. 3 cases were observed: (i) the 3 replicates were in the same cluster; (ii) 2 replicates were in the same cluster; (iii) each replicate was in a different clusters. The proportion of genotypes observed in each case was respectively 24 % (12 genotypes), 52 % (26 genotypes) and 24 % (12 genotypes).
320 321 322 323 324 325 326 327 328 329 330 331
DISCUSSION AND CONCLUSION 331 332 333 334 335 336 337 338 339 340 341 342 343 344 345 346 347 348 349 350 351 352 353 354 355
Selecting quantitative variables : which method ?
The first criterion we used to select variables was broad sense heritability. A variance decomposition was performed using the REML method because it gives a confidence interval for heritability and is considered the most suitable procedure to estimate variance components for unbalanced data (Dieters et al. 1995). However, heritability estimates are specific to the population and the environment analyzed (Souza et al. 1998). In particular, the choice of the parents is crucial since their contrasted behaviour for a trait does not guarantee its segregation in the progeny. Indeed, when parents are both homozygous for a trait, then all the descendants display the same heterozygous genotype for this trait. However, in apple tree, cultivars are known to be very heterozygous. In addition, the quantitative distributions of the studied traits suggest a probable polygenic control and in this case the probability that all genes responsible for trait expression are homozygous for the two parents is very low. After due consideration of the above, the parents of the progeny were chosen for their contrasted architecture (‘Starkrimson’ is type II and ‘Granny Smith’ is type IV according to the Lespinasse classification (1992)). As a matter of fact, fairly elevated heritability values were obtained even though measurements repetitions, at least for a subset of variables, either on different progenies or different climatic conditions would complement the present results and lead to more precise trait selection.
The second criteria used for selecting variables consisted in taking account of within-tree architectural variability. Indeed plant structure results, at least to some extent, from repetitive processes (White 1979). In particular, branches belonging to a same apple tree exhibit similar behavior in growth, branching and flowering occurrence (Costes et al. 2003). In the present study, significant within-tree variability, as observed for many variables at the LSAS level, underlined the difficulty in characterizing individuals on the
357 358 359 360 361 362 363 364 365 366 367 368 369 370 371 372 373 374 375 376 377 378 379 380 381 382
considering at least 2 repetitions of LSAS within the trees. This suggests that adequate within tree sampling benefits to estimations of the genetic parameters. Even though in some cases heritability values would be still over or under estimated, the choice of 2 LSAS described by tree appears as a realistic compromise between the time of notation required and the accuracy of the heritability value.
A third criteria was the analysis of genetic correlations between variables which highlighted, as expected, a high redundancy among variables. This analysis avoid to select among the variables a priori in a relative speculative way. Rather, it led us to select variables in each group of highly correlated traits, with a minimum of correlations between them. In addition, genetic correlations provide information on the other variables which could be predicted from the selected variables (Gallais 1989), when correlation between the variables considered explains a sufficient part of variance. For instance, the high genetic correlations between the mean internode length considered on trunks and many geometrical variables measured on both trunks and LSAS, suggests that this variable should be representative of axis geometry in trees.
These criteria allowed us to select relevant traits which were used for partitioning progeny into architectural groups containing trees of relatively similar branching and form. The PAM method was used rather than more classical methods such as hierarchic classifications, because it gives a small number of clusters containing a large number of individuals, and it provides a wealth of statistics to evaluate the clustering stability, and thus choose the more stable partition (Kaufman and Rousseeuw 1990). The partitioning into 6 clusters on the basis of these statistics took account of all tree architecture since both branching and geometrical variables were considered on both trunk and LSAS. Moreover, since variables with fairly elevated heritability values were selected for the partition, more than 75% of genotypes had at least two repetitions in the same cluster. This objective partitioning could be used to test simplified tree phenotyping when screening juvenile trees
383 384 385 386 387 388 389 390 391 392 393 394 395 396 397 398 399 400 401 402 403 404 405 406 407
in a nursery. Such a partitioning could be useful in progenies that lack major genes such as Co involved in the cross, i.e. when no contrasted phenotypes can be visually identified down the rows.
Which relevance of the proposed variables with respect to further tree development ?
Basic morphological traits in the apple tree, such as basis diameter and length, are usually measured to characterize the trunk “vigor”. In previous studies, heritability values for trunk basis diameter were close to 0.5 (Durel et al. 1998; Liebhard et al. 2003). Our results seem to underestimate the genetic variability for this variable with an heritability value of 0.12. In the same manner our result seems to underestimate heritability for trunk height since Watkins and Spangelo (1970) showed high additive variance for this trait. This low value may be due to a lack of contrast between the progeny parents for this trait (as previously discussed), or a reduction in total variability because of a rootstock effect. In support of this, the studies conducted by Watkins and Spangelo (1970) and Durel et al. (1998) were carried out with trees on their own roots, and the ‘Fiesta’ and ‘Discovery’ parents of the progeny studied by (Liebhard et al. 2003) were considered as contrasted for this character. Regarding trunk height, our results were consistent with the study of Liebhard et al. (2003) performed on a progeny grafted on low vigorous rootstock (M27), since we calculated an heritability value of 0.38 for trunk length. However, we selected a more local trait, i.e. mean internode length, to represent trunk geometry as it was considered as the most relevant. Thus, more global descriptors such as shoot length, made up of a combination of both internode length and number of internodes, appears as less convenient for our purpose. Moreover, this suggests that the emergence of new metamers (i.e. the elementary set of organs from which a plant is built (White 1979)) is a process which allows the plant to adapt to its environment and contribute to its architectural plasticity whereas internode lengthening appears as a more stable process. However, internode length is likely to depend
408 409 410 411 412 413 414 415 416 417 418 419 420 421 422 423 424 425 426 427 428 429 430 431 432 433
on the agronomic context, e.g. rootstock (Seleznyova et al. 2003) and should be further investigated.
Previous studies have considered few variables of axillary shoot morphology. Axillary shoot length was used to cluster ‘Telamon’ x ‘Breaburn’ progeny (De Wit et al. 2002). But this variable is not significantly affected by genotype and consequently had a low heritability value in the present study. As previously discussed for trunk length, this is probably due to the combination of both internode lengthening and the leaf emergence process. An analysis of genetic parameters in the progeny under study showed that the most relevant traits on axillary shoot geometry consisted of conicity and cord bending. These variables had a substantial impact on progeny clustering since they separated 2 clusters containing a fairly low number of trees and characterizing by a quite high separation value. From an agronomic point of view, the flexion of branches is an important factor in fruit tree growth and branching habit since it affects both fruit production and training practices (Lauri and Lespinasse 1999). In addition, internode length and shoot conicity along with shoot slenderness have been shown to be the main determinants of shoot bending in apricot tree (Alméras et al. 2004). The lower the conicity, the higher the slenderness and the more the branches bend. Thus conicity and internode length could be used to predict branch propensity to bend, while cord bending could be a descriptor of branch flexion. However, because fructification is of major importance in the acquisition of branch and tree form, tree habit in the adult stage will result from interference between initial branch geometry and branch flexion process (Alméras et al. 2004). Thus, phenotyping trees from the first year of growth could provide information concerning the relative importance of the initial branch geometry and fructification in the variability of adult tree habit.
With regard to the branching process, many variables measured on the trunks showed heritability values greater than 0.3. These results are consistent with those found in Telamon x Breaburn 1-year-old apple tree hybrids and with the clustering of this progeny
434 435 436 437 438 439 440 441 442 443 444 445 446 447 448 449 450 451 452 453 454 455 456 457 458
based mainly on sylleptic branching (De Wit et al. 2002). The number of axillary shoots has several advantages in addition to its high heritability value: a significant genetic correlation with all topological variables, and it is easier to measure than other branching variables. At the axillary shoot level, branching at order 3 was also shown to be a relevant descriptor of architectural variability since it had a high heritability value and was poorly correlated with branching on trunks. This variable had a considerable weight in tree partitioning, since it was the only variable involved in the discrimination of the partition in two clusters. In fruit trees, the development of sylleptic shoots along the trunk in the early stage of tree development (in nursery), is considered as an advantage for young tree establishment (Wertheim 1978). Plant growth regulators (mostly including a cytokinin effect) are often applied in order to produce feathered trees which have a potential for early cropping (Miller 1988; Elfving and Visser 2005). In addition, the number of sylleptic shoots in young pear cultivars has been shown to be related to the length of the juvenile period (Costes et al. 2004). Since sylleptic shoots mainly develop during early developmental years of tree life (Crabbé 1987), this trait is expected to be a potential early selection criterion provided its correlation with interesting agronomic behavior at adult stage is checked in apple progenies.
Presently, our results are being used to continue investigating the genetic determinants of the architectural traits on older and more complex trees, using a within-tree sampling strategy. Progeny phenotyping in the second year of growth is in the process and for a longer time step, until flowering and fruiting occurrence. These further investigations should provide information on the correlations between the variables selected in the present study, at early stages of tree development, with traits of agronomic interest, measured at adult stage.
We are grateful to Y. Guédon for his help in statistics, particularly for partitioning, to G. Garcia for his contribution to field measurements, and to S. Feral for technical assistance in the orchard. This research was funded by INRA. We also acknowledge Mr Mark Jones for improving the English.
460 461 462 463 464
REFERENCES 464 465 466 467 468 469 470 471 472 473 474 475 476 477 478 479 480 481 482 483 484 485 486 487 488
Agresti A, Coull BA (1998) Approximate is better than "Exact" for interval estimation of binomial proportions. Am Stat 52: 119-126
Alméras T, Costes E, Salles JC (2004) Identification of biomechanical factors involved in stem shape variability between apricot tree varieties. Ann Bot 93: 455-468
Barthélémy D, Caraglio Y, Costes E (1997) Architecture, gradients morphogénétiques et âge physiologique chez les végétaux. In: Bouchon J, Reffye de P, Barthelemy D (eds) Modélisation et simulation de l'architecture des végétaux. INRA, Paris, pp 89-136
Chao CT, Parfitt DE (2003) Genetic analyses of phenological traits of pistachio (Pistacia vera L.). Euphytica 129: 345-349
Corbeil RR, Searle SR (1976) Restricted maximum likelihood (REML) estimation of variance components in the mixed model. Technometrics 18: 31-38
Costes E, Guédon Y (2002) Modelling branching patterns in 1-year-old trunks of six apple cultivars. Ann Bot 89: 513-524
Costes E, Belouin A, Brouard L, Le Lezec M (2004) Development of young pear tree architecture and occurrence of first flowering: a varietal comparison. J Hortic Sci Biotech 79: 67-74
Costes E, Sinoquet H, Kelner JJ, Godin C (2003) Exploring within-tree architectural development of two apple tree cultivars over 6 years. Ann Bot 91: 91-104
Crabbé J (1987) Aspects particuliers de la morphogenèse caulinaire des végétaux ligneux et introduction à leur étude quantitative. IRSIA, Bruxelles
De Wit I, Cook NC, Keulemans J (2004) Characterization of tree architecture in two-year-old apple seedling populations of different progenies with a common columnar gene parent. Acta Hort 663: 363-368
489 490 491 492 493 494 495 496 497 498 499 500 501 502 503 504 505 506 507 508 509 510 511 512 513 514
De Wit I, Keulemans J, Cook NC (2002) Architectural analysis of 1-year-old apple seedlings according to main shoot growth and sylleptic branching characteristics. Trees 16: 473-478
Dieters MJ, White TL, Littell RC, Hedge GR (1995) Application of approximate variances of variance-components and their ratios in genetic tests. Theor Appl Genet 91: 15-24
Durel CE, Laurens F, Fouillet A, Lespinasse Y (1998) Utilization of pedigree information to estimate genetic parameters from large unbalanced data sets in apple. Theor Appl Genet 96: 1077-1085
Edelin C (1991) Nouvelles données sur l'architecture des arbres sympodiaux: le concept de plan d'organisation. In: Edelin C (ed) L'Arbre. Biologie et développement, Naturalia Monspeliensia, Montpellier, pp 127-154
Elfving DC, Visser DB (2005) Cyclanilide induces lateral branching in apple trees. HortScience 40: 119-122
Falconer DS (1981) Introduction to quantitative genetics. Longman, London Gallais A (1989) Théorie de la sélection en amélioration des plantes. Masson, Paris
Godin C, Guédon Y (2003) AMAPmod version 1.8 : Introduction and reference manual. CIRAD, Montpellier
Godin C, Costes E, Sinoquet H (1999a) A method for describing plant architecture which integrates topology and geometry. Ann Bot 84: 343-357
Godin C, Guédon Y, Costes E (1999b) Exploration of a plant architecture database with the AMAPmod software illustrated on an apple tree hybrid family. Agronomie 19: 163-184
Godin C, Guédon Y, Costes E, Caraglio Y (1997) Measuring and analyzing plants with the AMAPmod software. In: Michalewicz M (ed) Advances in computational life science. CSIRO, Melbourne, pp 53-84
515 516 517 518 519 520 521 522 523 524 525 526 527 528 529 530 531 532 533 534 535 536 537 538 539
Hansche PE, Hesse CO, Beres V (1972) Estimates of genetic and environmental effects on several traits in peach. J Am Soc Hort Sci 97: 76-79
Hanson WD (1963) Heritability. In: Hanson WD, Robinson HF (eds) Statistical Genetics and Plant Breeding. Nat Acad Sci, Washington, pp 125-163
Hardner CM, Winks CW, Stephenson RA, Gallagher EG, McConchie CA (2002) Genetic parameters for yield in macadamia. Euphytica 125: 255-264
Hemmat M, Weeden NF, Conner PJ, Brown SK (1997) A DNA marker for columnar growth habit in apple contains a simple sequence repeat. J Am Soc Hort Sci 122: 347-349
Hill J, Becker HC, Tigerstedt PMA (1998) Quantitative and ecological aspects of plant breeding. ITP, London
Hill WG (1971) Design and efficiency of selection experiments for estimating genetic parameters. Biometrics 27: 293-311
Jansson G, Jonsson A, Eriksson G (2005) Use of trait combinations for evaluating juvenile-mature relationships in Picea abies (L.). Tree Genetics & Genomes 1: 21-29
Kaufman L, Rousseeuw PJ (1990) Finding groups in data, an introduction to cluster analysis. Wiley-Interscience, New York
Kenis K, Keulemans J (2004) QTL analysis of growth characteristics in apple. Acta Hort 663: 369-374
Kim MY, Song KJ, Hwang JH, Shin YU, Lee HJ (2003) Development of RAPD and SCAR markers linked to the Co gene conferring columnar growth habit in apple (Malus pumila Mill.). J Hortic Sci Biotech 78: 512-517
Lapins KO (1974) Spur type growth habit in 60 apple progenies. J Am Soc Hort Sci 99: 568-572
541 542 543 544 545 546 547 548 549 550 551 552 553 554 555 556 557 558 559 560 561 562 563 564 565 566
Laurens F, Audergon J, Claverie J, Duval H, Germain E, Kervella J, Lelezec M, Lauri P, Lespinasse J (2000) Integration of architectural types in French programmes of ligneous fruit species genetic improvement. Fruits 55: 141-152
Lauri PE, Lespinasse JM (1999) Apple tree training in France: current concepts and practical implications. Fruits 54: 441-449
Lauri PE, Terouanne E, Lespinasse JM, Regnard JL, Kelner JJ (1995) Genotypic differences in the axillary bud growth and fruiting pattern of apple fruiting branches over several years - an approach to regulation of fruit bearing. Scientia Hort 64: 265-281
Lespinasse JM (1977) La conduite du pommier : Types de fructification, incidence sur la conduite de l'arbre. INVUFLEC, Paris
Lespinasse Y (1992) Breeding apple tree: aims and methods. In: Rousselle-Bourgeois F, Rousselle P (eds) Proceedings of the joint conference of the E.A.P.R breeding and varietal assessment section and the E.U.C.A.R.P.I.A. potato section. I.N.R.A., Ploudaniel (France), pp 103-110
Liebhard R, Kellerhals M, Pfammatter W, Jertmini M, Gessler C (2003) Mapping quantitative physiological traits in apple (Malus x domestica Borkh.). Plant Mol Biol 52: 511-526
Miller SS (1988) Plant bioregulators in apple and pear culture. Horticultural Reviews 10: 309-401
Oraguzie NC, Hofstee ME, Brewer LR, Howard C (2001) Estimation of genetic parameters in a recurrent selection program in apple. Euphytica 118: 29-37
Osorio LF, White TL, Huber DA (2003) Age-age and trait-trait correlations for Eucalyptus grandis Hill ex Maiden and their implications for optimal selection age and design of clonal trials. Theor Appl Genet 106: 735-743
567 568 569 570 571 572 573 574 575 576 577 578 579 580 581 582 583
Seleznyova AN, Thorp T, White M, Tustin S, Costes E (2003) Application of architectural analysis and AMAPmod methodology to study dwarfing phenomenon: the branch structure of 'Royal gala' apple grafted on dwarfing and non-dwarfing rootstock combinations. Ann Bot 91: 1-8
Souza VAB, Byrne DH, Taylor JF (1998) Heritability, genetic and phenotypic correlations, and predicted selection response of quantitative traits in peach: II. An analysis of several fruit traits. J Am Soc Hort Sci 123: 604-611
Tancred SJ, Zeppa AG, Cooper M, Stringer JK (1995) Heritability and patterns of inheritance of the ripening date of apples. HortScience 30: 325-328
Watkins R, Spangelo LPS (1970) Components of genetic variance for plant survival and vigor of apple trees. Theor Appl Genet 40: 195-203
Wertheim SJ (1978) Manual and chemical induction of side-shoot formation in apple trees in the nursery. Scientia Hort 9: 337-345
White J (1979) The plant as a metapopulation. Ann Rev Ecol Syst 10: 109-145
Yao Q, Mehlenbacher SA (2000) Heritability, variance components and correlation of morphological and phenological traits in hazelnut. Plant Breed 119: 369-381
TABLES 583 584 585 586 587
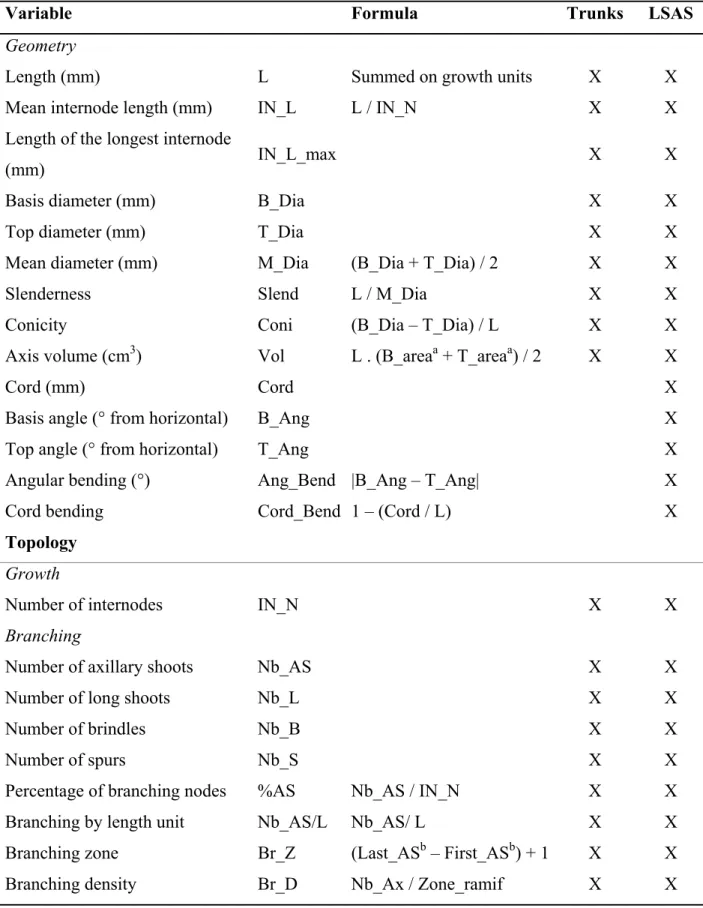
Table 1. List of quantitative variables classified whether they are related to tree geometry
or topology, corresponding abbreviates and within-tree positions of the measurements (trunks and long sylleptic axillary shoots – LSAS). Formula are detailed for calculated variables.
Variable Formula Trunks LSAS
Geometry
Length (mm) L Summed on growth units X X
Mean internode length (mm) IN_L L / IN_N X X
Length of the longest internode
(mm) IN_L_max X X
Basis diameter (mm) B_Dia X X
Top diameter (mm) T_Dia X X
Mean diameter (mm) M_Dia (B_Dia + T_Dia) / 2 X X
Slenderness Slend L / M_Dia X X
Conicity Coni (B_Dia – T_Dia) / L X X
Axis volume (cm3) Vol L . (B_areaa + T_areaa) / 2 X X
Cord (mm) Cord X
Basis angle (° from horizontal) B_Ang X
Top angle (° from horizontal) T_Ang X
Angular bending (°) Ang_Bend |B_Ang – T_Ang| X
Cord bending Cord_Bend 1 – (Cord / L) X
Topology
Growth
Number of internodes IN_N X X
Branching
Number of axillary shoots Nb_AS X X
Number of long shoots Nb_L X X
Number of brindles Nb_B X X
Number of spurs Nb_S X X
Percentage of branching nodes %AS Nb_AS / IN_N X X
Branching by length unit Nb_AS/L Nb_AS/ L X X
Branching zone Br_Z (Last_ASb – First_ASb) + 1 X X
a
B_area = (B_Dia / 2)², T_area = (T_Dia / 2)² 588
589 590 591
b
First_AS = rank from the basis of the first branching node, Last_AS = rank from the basis of the last branching node
Table 2. Individual broad sense heritability values (h²b) with confidence interval (CI)
indicated into brackets for variables considered on both trunks and long sylleptic axillary shoots (LSAS; for variable abbreviates see Table 1).
591 592 593 Trunks LSAS Variables h²b CI (95 %) h²b CI (95 %) Geometry L 0.38 [0.21, 0.56] 0.09 [0, 0.30] IN_L 0.30 [0.12, 0.48] 0.49 [0.30, 0.68] IN_L_max 0.24 [0.06, 0.42] 0.57 [0.41,0.74] B_Dia 0.10 [0, 0.28] 0.12 [0,0.31] T_Dia 0.14 [0, 0.32] 0.24 [0.04, 0.44] M_Dia 0.10 [0, 0.27] 0.14 [0, 0.33] Slend 0.29 [0.11, 0.48] 0.28 [0.06, 0.49] Coni 0.19 [0.01, 0.37] 0.40 [0.21, 0.59] Vol 0.16 [0, 0.34] 0.12 [0, 0.32] Cord 0.04 [0, 0.25] B_Ang 0.16 [0, 0.38] T_Ang 0.21 [0, 0.42] Ang_Bend 0.27 [0.07, 0.47] Cord_Bend 0.30 [0.08, 0.52] Topology Growth IN_N 0.17 [0, 0.35] 0.18 [0, 0.40] Branching Nb_AS 0.41 [0.23, 0.58] 0.54 [0.33, 0.74] Nb_L 0.06 [0, 0.23] 0.08 [0, 0.25] Nb_B 0.34 [0.16, 0.51] 0.30 [0.10, 0.50] Nb_S 0.46 [0.29, 0.63] 0.56 [0.33, 0.78] %AS 0.33 [0.15, 0.51] 0.49 [0.28, 0.71] Nb_AS/L 0.43 [0.26, 0.61] 0.51 [0.31, 0.71] Br_Z 0.26 [0.07, 0.44] 0.35 [0.15, 0.54] Br_D 0 [0, 0.11] 0.17 [0, 0.38] 594
Table 3. Variance decomposition for variables measured on long sylleptic axillary shoots
(LSAS): estimates of genotypic, within-tree, residual and total variances (for variable abbreviates see Table 1). Significance of the corresponding factors are indicated as follows: ns – non significant, * – significant (0.01 < p ≤ 0.05), ** – highly significant (p ≤ 0.01). 594 595 596 597 Variances Variables
Genotypic Within-tree Residual Total
Geometry
L 1769.12 ns 14914.95 ** 12809.53 29493.60
IN_L 1.73 ** 1.04 ** 1.83 4.61
IN_L_max 4.56 ** 2.02 ** 5.42 12.00
B_Dia 0.23 ns 1.08 ** 1.24 2.55
T_Dia 4.26E-02 * 8.53E-02 ** 0.10 0.23
M_Dia 0.10 ns 0.40 ** 0.39 0.90
Slend 128.35 * 251.36 ** 261.84 641.55
Coni 8.32E-07 ** 8.43E-07 ** 1.45E-06 3.12E-06
Vol 4.75 ns 23.89 ** 19.54 48.18
Cord 660.27 ns 11347.07 ** 9715.28 21722.63
B_Ang 23.29 ns 25.24 * 139.40 187.92
T_Ang 53.06 ns 81.70 * 368.99 503.75
Ang_Bend 82.09 * 120.89 ** 359.22 562.20
Cord_Bend 6.79E-04 * 5.40E-04 * 2.10E-03 3.32E-03
Topology
Growth
IN_N 15.93 ns 60.12 ** 64.81 140.86
Branching
Nb_AS 1.46 ** 0.38 ns 2.68 4.52
Nb_L 2.23E-03 ns 2.24E-03 ns 6.45E-02 6.90E-02
Nb_B 4.02E-02 ** 5.53E-03 ns 0.26 0.31
Nb_S 1.27 ** 0.33 * 1.75 3.35
%AS 4.91E-04 ** 2.00E-04 * 9.59E-04 1.65E-03 Nb_AS/L 3.74E-06 ** 1.26E-06 * 7.79E-06 1.28E-05
Table 4. Genetic correlations between variables selected on the basis of their broad sense heritability value, measured on trunks and long sylleptic
axillary shoots (LSAS; for variable abbreviates see Table 1). Significant correlations (p ≤ 0.05) are in bold. Genetic correlations higher than phenotypic correlations are in italics.
599 600 601
Trunk Variables LSAS Variables
L IN_L IN_L _max Slend Nb_ AS Nb_S Nb_ AS/L IN_L IN_L
_max Slend Coni
Ang_ Bend Cord_ Bend Nb_A S Nb_S %AS Nb_ AS/L L 1 IN_L 0.84 1 IN_L_max 0.63 0.66 1 Slend 0.72 0.58 0.40 1 Nb_AS -0.17 -0.21 -0.24 -0.41 1 Nb_S -0.11 -0.20 -0.19 -0.21 0.85 1 T runk V ari abl es Nb_AS/L -0.41 -0.40 -0.40 -0.55 0.95 0.80 1 IN_L 0.55 0.66 0.60 0.42 -0.45 -0.38 -0.55 1 IN_L_max 0.48 0.55 0.60 0.36 -0.49 -0.43 -0.60 0.83 1 Slend 0.32 0.11 0.16 0.22 0.01 -0.11 -0.11 0.20 0.26 1 Coni -0.23 -0.08 -0.19 -0.37 0.09 0.15 0.17 -0.13 -0.15 -0.70 1 Ang_Bend 0.07 0.03 -0.07 -0.15 -0.05 -0.12 -0.09 0.24 0.15 0.40 0.01 1 Cord_Bend 0.07 -0.11 -0.17 0.02 -0.03 -0.06 -0.04 -0.01 -0.01 0.41 -0.14 0.68 1 Nb_AS -0.28 -0.40 -0.26 -0.25 0.20 0.22 0.22 -0.05 0.12 0.26 -0.02 0.19 0.14 1 Nb_S -0.29 -0.40 -0.28 -0.23 0.20 0.23 0.21 -0.06 0.12 0.23 -0.05 0.14 0.08 0.98 1 %AS -0.32 -0.42 -0.28 -0.27 0.23 0.24 0.26 -0.05 0.09 0.21 0.01 0.15 0.09 0.99 0.97 1 L S A S V ari abl es Nb_AS/L -0.33 -0.43 -0.30 -0.28 0.25 0.26 0.29 -0.09 0.05 0.21 0.02 0.13 0.09 0.99 0.96 1.00 1
Table 5. Characterization of partition P6 composed of 6 clusters: number of trees by cluster (N), diameter, separate and mean value for each selected variable measured on trunks and long sylleptic axillary shoots (LSAS; for variable abbreviates see Table 1). Diameter = d(within) 602 603 604 605 606
max, separate = d(between)min; a, b, c, d = discrimination of the clusters according to the Newman-Keuls test (p ≤ 0.05).
Clusters 1 2 3 4 5 6 N 5 7 22 39 34 42 diameter 2.73 3.24 3.22 2.78 2.94 3.06 separate 1.34 0.68 0.44 0.18 0.38 0.18 IN_L 13.63 (b) 14.03 (b) 15.00 (b) 14.41 (b) 16.82 (c) 12.14 (a) Trunks
Nb_AS 16.80 (c) 10.14 (a, b) 11.95 (b) 21.82 (d) 9.38 (a, b) 6.02 (a) Coni 0.0086 (a) 0.0079 (a) 0.0108 (b) 0.0084 (a) 0.0079 (a) 0.0081 (a) Cord_bend 0.09 (a) 0.24 (b) 0.07 (a) 0.10 (a) 0.09 (a) 0.08 (a) LSAS
Nb_AS 6.82 (b) 1.10 (a) 0.48 (a) 1.05 (a) 0.48 (a) 0.83 (a) 607
FIGURES CAPTION 607 608 609 610 611 612 613 614 615 616 617 618 619 620 621 622
Figure 1. Schematic representation of a tree with 2 growth units (GU) on the trunk and 3
sylleptic branching orders. Branching orders are 1 for the trunk, 2 for the branches born on the trunk and so on; long sylleptic axillary shoots (LSAS). Three geometrical variables measured on the LSAS are illustrated.
Figure 2. Individual broad sense heritability value variation with the number of long
axillary sylleptic shoots (LSAS) described, for a selection of variables: Nb_AS ( ), Coni ( ), Cord_Bend ( ), Nb_B (∆), Br_D ( ), T_Ang ( ) (for variable abbreviates see Table 1).
Figure 3. Schematic representation of progeny partition into six clusters with a typical
tree representing each cluster. Variables involved in the definition of each cluster are mentioned above the graph with the variation direction indicated by + versus -, and the number of trees per cluster are mentioned below the graph (for variable abbreviates see Table 1; _tr or _as were added to abbreviates whether the variable was measured on trunks or long sylleptic axillary shoots).
622 624 626 628 630 632 634 636 638 640 642 644 646 648 650 651 652 653 654 655 656 657 658 659 660 661 662 663 664 665 666 667 668 Fig.1
671 673 675 677 679 681 683 685 687 689 691 693 695 697 699 701 703 705 706 707 708 709 710 711 712 713 714 715 716 717 718 719 720 721 Fig. 2
722 723 725 727 729 731 733 735 737 739 741 743 745 747 749 751 752 753 754 755 756 757 758 759 760 761 762 763 764 765 766 767 768 Fig. 3