Publisher’s version / Version de l'éditeur:
Vous avez des questions? Nous pouvons vous aider. Pour communiquer directement avec un auteur, consultez la première page de la revue dans laquelle son article a été publié afin de trouver ses coordonnées. Si vous n’arrivez pas à les repérer, communiquez avec nous à PublicationsArchive-ArchivesPublications@nrc-cnrc.gc.ca.
Questions? Contact the NRC Publications Archive team at
PublicationsArchive-ArchivesPublications@nrc-cnrc.gc.ca. If you wish to email the authors directly, please see the first page of the publication for their contact information.
https://publications-cnrc.canada.ca/fra/droits
L’accès à ce site Web et l’utilisation de son contenu sont assujettis aux conditions présentées dans le site LISEZ CES CONDITIONS ATTENTIVEMENT AVANT D’UTILISER CE SITE WEB.
2010 Eighth International Conference on Privacy, Security and Trust, pp.
110-117, 2010
READ THESE TERMS AND CONDITIONS CAREFULLY BEFORE USING THIS WEBSITE.
https://nrc-publications.canada.ca/eng/copyright
NRC Publications Archive Record / Notice des Archives des publications du CNRC :
https://nrc-publications.canada.ca/eng/view/object/?id=cad88c75-4cb8-412f-b691-e256bd75d28f
https://publications-cnrc.canada.ca/fra/voir/objet/?id=cad88c75-4cb8-412f-b691-e256bd75d28f
NRC Publications Archive
Archives des publications du CNRC
This publication could be one of several versions: author’s original, accepted manuscript or the publisher’s version. / La version de cette publication peut être l’une des suivantes : la version prépublication de l’auteur, la version acceptée du manuscrit ou la version de l’éditeur.
For the publisher’s version, please access the DOI link below./ Pour consulter la version de l’éditeur, utilisez le lien DOI ci-dessous.
https://doi.org/10.1109/PST.2010.5593253
Access and use of this website and the material on it are subject to the Terms and Conditions set forth at
A new perspective of privacy protection: unique distinct l-SR diversity
Wang, Yunli; Cui, Yan; Geng, Liqiang; Liu, Hongyu
A New Perspective of Privacy Protection:
Unique Distinct l-SR diversity
Yunli Wang, Yan Cui, Liqiang Geng and Hongyu Liu
Institute for Information Technology National Research Council Canada Fredericton, NB, Canada E3B 9W4
Email: yunli.wang, yan.cui, liqiang.geng, hongyu.liu@nrc-cnrc.gc.ca
Abstract—More and more public data sets which contain information about individuals are published in recent years. The urgency to reduce the risk of the privacy disclosure from such data sets makes the approaches of privacy protection for data publishing be widely employed. There are two popular models for privacy protection: anonymity and l-diversity. k-anonymity focuses on reducing the probability of identifying a particular person, which requires that each equivalence class (a set of records with same identifier attributes) contains at least k records. l-diversity concentrates on reducing the inference from released sensitive attributes. It requires that each equivalence class has at least l “well-represented” sensitive attribute values. In this study, we view the privacy protection problem in a brand new perspective. We proposed a new model, Unique Distinct l-SR diversity based on the sensitivity of private information. Also, we presented two performance measures for how much sensitive information can be inferred from an equivalence class. l-SR diversity algorithm was implemented to achieve Unique Distinct l-SR diversity. We tested l-SR diversity on one benchmark data set and three synthetic data sets, and compared it with other l-diversity algorithms. The results show that our algorithm achieved better performance on minimizing inference of sensitive information and reached the comparable generalization data quality compared with other data publishing algorithms.
I. INTRODUCTION
The amount of data containing private information collected by different organizations is increasing dramatically in last two decades. These organizations need to publish these data for various purposes. Typically such data is stored in database tables. Each row in the table refers to one person. Three types of attributes are usually contained in the table: unique identifier attributes, quasi-identifier attributes, and sensitive attributes. Although unique identifier attributes can be removed from tables, it cannot prevent privacy leakage of identifying individ-uals by combining quasi-identifiers in this table or with other publically available databases. Different models have been purposed for the data publishing and privacy protection. k-anonymity [1] and l-diversity [2] are two well known models. In a k-anonymized table, each record is indistinguishable with at least k-1 other records with respect to quasi-identifier at-tributes. Although k-anonymity can prevent identity disclosure, it does not take the sensitive attribute (e.g. disease, salary) into consideration. Due to that, a new model, l-diversity [2], has been proposed. l-diversity demands that in each equivalence class there are at least l “well-represented” sensitive attribute values. However, both k-anonymity and l-diversity did not take
the sensitivity levels of sensitive attributes into consideration. Most people would agree that “HIV” is more sensitive than “Flu” in a disease database. Knowing a person has flu has much lower impact than knowing someone has HIV. Thus, we emphasize another aspect of privacy: the sensitivity of private information in the framework of l-diversity.
We propose a new model: Unique Distinct l-SR diversity, achieving l-diversity on the sensitivity levels of sensitive attributes. The purpose is to generate a table in which each equivalence class has exactly l distinct sensitivity levels of the sensitive attribute. When the sensitivity levels of these sensitive attributes are balanced, the data can be released with limited risk of inference of sensitive information from sensitive attributes. This paper is organized as follows. In Section 2, we introduce two basic models: k-anonymity, l-diversity and a stronger l-diversity model: Unique Distinct l-diversity. We present our new model: Unique Distinct l-SR diversity in Section 3 and l-SR diversity algorithm in Section 4. In Section 5, we compare l-SR diversity algorithm with other l-diversity algorithms on one benchmark data set and three synthetic data sets. We conclude the paper and discuss some future work in Section 6.
II. BACKGROUND
The effort of protecting privacy falls into two categories: preventing identifier disclosure (k-anonymity), preventing at-tribute disclosure (l-diversity and others).
A. k-anonymity
Sweeney proposed the definition of k-anonymity [1]. A table satisfies k-anonymity when each record is indistinguishable with at least k-1 other records in terms of quasi-identifier attributes. Although k-anonymity can prevent identifier dis-closure, it is unable to prevent homogeneity attack and back-ground knowledge attack. Homogeneity attack happens when all records in an equivalence class has the same sensitive value. If the adversary has the knowledge of the sensitive attribute of specific individuals, it could lead to positive disclosure or negative disclosure. When the adversary has particular knowledge about the distribution of sensitive and non-sensitive attributes in the population, background knowledge attack could happen.
B. l-diversity
In order to address the limitations of k-anonymity and provide more protections on attribute disclosure, l-diversity was introduced by Machanavajjhala [2]. The main reason of k-anonymity suffers from homogeneity and background knowledge attack is that k-anonymity does not take sensi-tive attributes into account. l-diversity requires that in each equivalence class there are at least L ”well-represented” sen-sitive attribute values. There are several interpretations of this “well-represented” in the principle of l-diversity: Distinct l-diversity, Entropy l-diversity and Recursive (c,l)-diversity. Distinct l-diversity ensures that there are at least l distinct values for the sensitive attribute in each equivalence class. A table has entropy l-diversity if each equivalence class satisfies Entropy(E) > log(l). While Recursive (c,l)-diversity makes sure that the most frequent value does not appear too fre-quently, and the less frequent values do not appear too rarely. C. Unique Distinctl-diversity
To provide a better protection on probabilistic inference attacks, a new model Unique Distinct l-diversity was proposed by Ye et al. [10]. A table is said to be Unique Distinct l-diversity if each equivalence class has exactly l distinct sensitive values. Unique Distinct l-diversity is a stronger model than Distinct l-diversity, Recursive (c,l)-diversity, and Entropy l-diversity because if a table satisfy Unique Distinct l-diversity, the other three will be also satisfied [10]. However, Unique Distinct l-diversity is a restrictive requirement. There is an upper boundary for a table to reach Unique Distinct l-diversity. It requires the fraction of the most frequent sensitive value in the entire table to be less than 1/l. If there is one sensitive attribute value appearing quite frequently, the upper boundary of l satisfying Unique Distinct l-diversity will be very low.
III. UNIQUEDISTINCTl-SRDIVERSITY
A. Sensitivity of private information
The purpose of privacy protection for data publishing is to minimize the risk of releasing individually private informa-tion. Personal information refers to individually identifiable information. However, personal information does not mean the information is especially sensitive, private or embarrassing [13]. We propose to consider the sensitivity of private informa-tion in the data publishing models. Sensitivity can be used to measure the impact on disclosure of personal data. Knowing a person having flu will have totally different impact than knowing someone has HIV. Usually the sensitivity of private information is subjective and context dependent. Nevertheless, we can still obtain the sensitivity of certain information from experts with the knowledge of what is socially acceptable or through survey [12]. In this study, we assume we can obtain the sensitivity of private information, and we only focus on how to incorporate the sensitivity of private information in the framework of anonymization for data publishing.
TABLE I ORIGINAL DISEASE TABLE
ID PostCode Age Gender Disease
1 86653 31 M Blood Cancer 2 86657 34 M AIDS 3 86665 32 M Heart Disease 4 86452 32 F Fungal Pneumonia 5 86458 33 F SARS 6 86451 32 M Bacterial Pneumonia 7 86861 38 F Flu 8 86859 36 M Fever 9 86852 39 F Cough TABLE II
3-DIVERSITY VERSION OF THE DISEASE TABLE
ID PostCode Age Gender Disease
1 866** 30-35 M Blood Cancer 2 866** 30-35 M AIDS 3 866** 30-35 M Heart Disease 4 8645* 30-35 * Fungal Pneumonia 5 8645* 30-35 * SARS 6 8645* 30-35 * Bacterial Pneumonia 7 868** 36-40 * Flu 8 868** 36-40 * Fever 9 868** 36-40 * Cough B. Sensitivity attack
Considering of sensitivity of private information, we would like to bring your attention to one type of attack: sensitivity attack. Sensitivity attack happens when the sensitivity level of sensitive attributes in one equivalence class falls into a narrow range, so the adversary can learn some information and the importance of such information. If the sensitivity levels of sensitive attributes in an equivalence class are high, it will have big impact if we release such data. Sensitivity is one of aspects of private information. l-diversity did not take sensitivity into consideration. It only requires that there are at least l ”well-represented” sensitive attribute values. It does not mean that the distribution of l distinct values is balanced. Even though some algorithms such as BSGI which tends to form a uniform distribution on sensitive attribute with exact l distinct sensitive attribute values in almost each equivalence class, the released data is still vulnerable for sensitivity attack.
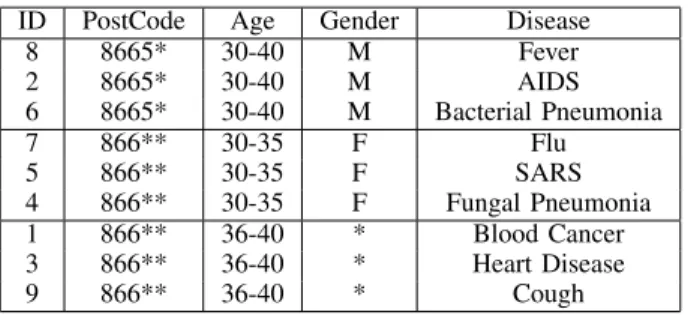
Table 1 is a part of an original disease table. Table 1 can be transformed into table 2 using a l-diversity algorithm. Tuples {t1, t2, t3}, {t4, t5, t6}, {t7, t8, t9} form three equivalence classes. Each of those three has exactly three distinct sensitive attribute values, so they are unique distinct 3-diversity. If the adversary has some prior belief about the sensitive attribute, this table is still vulnerable for similarity attacks and sensitivity attack. Similarity attack will happen when the sensitive values in an equivalence class are semantically similar [3]. In the second equivalence class, three different diseases belong to the same semantic category, inflammatory illness of lung, so it suffers from the similarity attack. Thus, the adversary can conclude the persons in this equivalence class have Pneu-monia. Although all three sensitive values are in different
TABLE III
UNIQUEDISTINCTl-SRDIVERSITY VERSION OF TABLE1
ID PostCode Age Gender Disease
8 8665* 30-40 M Fever 2 8665* 30-40 M AIDS 6 8665* 30-40 M Bacterial Pneumonia 7 866** 30-35 F Flu 5 866** 30-35 F SARS 4 866** 30-35 F Fungal Pneumonia 1 866** 36-40 * Blood Cancer 3 866** 36-40 * Heart Disease 9 866** 36-40 * Cough
semantic categories in the first and third equivalence class, they could suffer from sensitivity attack. For instance, if Bob knows his neighbor Peter is in the first equivalence class, he could not know exactly which disease or disease category Peter has, but Bob knows for sure that Peter has a severe illness, because each one of those is severe. In the second equivalence class, the sensitivity levels of these diseases are different, so it does not suffer from sensitivity attack. Unique Distinct l-SR diversity cannot prevent similarity attack since we try to address different issues. Similar in semantic category and similar in sensitivity level might mean the same thing for some situations. For example, if in one equivalence class all records fall into low income category, then they are similar both in semantic category and sensitivity level.
C. Sensitivity Ranking
We need to take the diversity to another level, diversity on sensitivity levels of sensitive attributes. We introduce sensitivity ranking to rate the sensitivity level of sensitive attributes. The basic idea is to rank distinct values of sensitive attributes and represent them as sensitivity ranking levels. The higher the sensitivity ranking level, the bigger the impact of data disclosure has. If in an equivalence class, all sensitive attribute values have high sensitivity ranking levels such as the first equivalence class in table 2, the adversary can infer some information from it. On the country, if all records have low sensitivity level in one equivalence class such as the third equivalence class in table 2, the adversary can still infer a person has a minor condition. Nevertheless, the impact of later example is much smaller than the former. Ideally, we want to reach l-diversity on the sensitivity ranking level of sensitive attributes, so the adversary cannot infer sensitive information from the equivalence class.
D. Unique Distinctl-SR diversity
In order to prevent sensitivity attack, we introduce a new l-diversity model: Unique Distinct l-SR diversity.
Definition 1. A table is said to satify Unique Distinct l-SR diversity if each of its equivalence class contains exactly l distinct sensitivity ranking levels.
Table 3 is the example of Unique Distinct l-SR diversity version of the table 1.
Observation 1. If an equivalence class satisfies Unique Distinct SR diversity, it also satisfies Unique Distinct l-diversity.
If an equivalence class e, e = {t1, t2, ..., tl}, satisfies Unique Distinct l-SR diversity, each tihas the one sensitivity ranking level ti[SAri], and ti[SAri] 6= tj[SArj], i 6= j. Eachti[SAri] has one corresponding sensitive value ti[SAi], also ti[SAi] 6= tj[SAj], i 6= j. Therefore, e satisfies Unique Distinct l-diversity. This also applies to the situation of single tuple with multiple sensitive attributes since multiple sensitive attributes can be mapped to one sensitivity ranking level as described in section 3.3.
Observation 2. If an equivalence class satisfies Unique Distinct l-diversity, it might not satisfy Unique Distinct l-SR diversity.
An equivalence class e, e = {t1, t2, ..., tl}, satisfies Unique Distinct l-diversity, so it has l distinct sensitive values ti[SAi] 6= tj[SAj], i 6= j. They can be mapped to k distinct sensitivity ranking levels, whilek ≤ l. Therefore, e might not satisfy Unique Distinct l-SR diversity.
Observation 3. The upper boundary of l for reaching Unique Distinct l-SR diversity is max[2, [n
n1]], where n1 is the most frequent sensitivity ranking level in a table and n is the number of tuples in the table.
Based on observation 1, the method for calculating the upper boundary for Unique Distinct l-SR diversity is the same with Unique Distinct l-diversity.
Observation 4. An equivalence class with Unique Distinct l-SR diversity also satisfies Distinct diversity, Entropy l-diversity, and Recursive (c,l)-diversity(with(c > 1)).
Since a equivalence class with unique distinct l-diversity also satisfy Distinct l-diversity, Entropy l-diversity, and Re-cursive (c,l)-diversity(with c > 1) [10], we can infer that an equivalence class with Unique Distinct l-SR diversity also satisfies Distinct l-diversity, Entropy l-diversity, and Recursive (c,l)-diversity(with(c > 1)).
Based on above observations, we can generate this hypoth-esis and it will be tested in experiments.
Hypothesis: Unique Distinct l-SR diversity provides better protections over sensitivity attacks than Unique Distinct l-diversity does.
E. Measures for sensitivity diversity
There are two aspects for measuring the quality of released data for data publishing. One is to measure the amount of gen-eration on quasi-identifier attributes in the original data. The better data quality indicates less generation and suppression on the original data. Some studies used Information Loss[10], Discernibility Metric, and Average Group Size [2], [10] for this aspect. Most of these studies [2], [10] focus solely on the generalization of the quasi-identifier attributes for measuring the performance of those l-diversity Algorithms. Another as-pect is to measure how much information can be inferred from the sensitive attributes. t-closeness is a parameter that could measure how closer of the distribution of sensitive attribute to the original data. Less information can be learned about the
released data if the distribution of sensitive attributes is closer to the original data. However, t-closeness only concentrates on the distribution of sensitive values. From the perspective of sensitivity of private information, we need different measures for how much sensitive information can be inferred from the released data. We proposed two measures: Entropy Metric and Variance Metric. Entropy Metric EM = (X e∈E R X i=1 −pi∗ log2pi)/|E| e is one equivalence class;
E is the set of all the equivalence classes; |E| is the number of equivalence classes; R is the highest sensitive ranking level;
piis the probability of tuples with sensitive ranking level i in this equivalence class.
High entropy indicates that the sensitivity ranking level of sensitive attributes in an equivalence class tends to be more uniformly distributed.
Variance Metric
Variance Metric measures the difference of the average sensitivity ranking level between each equivalence class and the whole table. High Variance Metric indicates the average sensitive ranking level in an equivalence class is far away from that of the whole table.
V M =X e∈E
|Ae− A0|/|E| e is one equivalence class;
E is the set of equivalence classes; |E| is the number of equivalence classes;
Ae is the average sensitivity ranking level of equivalence class e;
A0 is the average sensitivity ranking level of the whole table.
Combining both Entropy Metric and Variance Metric, we are able to measure the how much sensitive information can be learned from the released data.
IV. THE IMPLEMENTATION TO ACHIEVEUNIQUEDISTINCT
l-SRDIVERSITY
We implemented an l-SR diversity algorithm to achieve Unique Distinct l-SR diversity. Our implementation was in-spired by BSGI since BSGI can achieve Unique Distinct l diversity for sensitive values, which is a stronger model than other l-diversity: Distinct l-diversity, Entropy l-diversity and Recursive (c,l) diversity. Our l-SR diversity algorithm also includes two steps: selecting and incorporating. Each sensitive value is associated with a sensitivity ranking level. l-SR diversity minimize Variance Metric of equivalence classes in the selecting step and minimize the Entropy Metric in the incorporating step. In other words, l-SR diversity optimizes sensitivity measures when generating equivalence classes. Low Variance Metric means that the average sensitivity ranking level in each equivalence class is closer to the original table.
It will avoid the problem that the average sensitivity ranking level in some equivalence classes are much higher than others, so these equivalence classes are vulnerable to sensitivity attack. We also prefer an equivalence class has high entropy. Uniform distribution will limit the information which can be learned by the adversary.
Suppose a table T has n tuples T = {t1, t2, ..., tn}. ti is one tuple in T. T has a set of attributes A, andA∗
is the set of sensitive attributes A∗
= {SA1, SA2, ..., SAm}, A∗ ⊂ A. ti[SAr] is the sensitive ranking level of tuple ti on A∗. T∗ is the table after anonymization. E is the set of equivalence classes.T∗= e
1∪ e2... ∪ ej. P is the upper boundary of l for reaching Unique Distinct l-SR diversity as described in section 3.4. IL and EM are information loss and entropy metric of an equivalence class.
Selecting
1) Split T into a set of buckets B={B1, B2, , Bs} based on sensitivity ranking level, and |B1| ≥ |B2| ≥ ... ≥ |Bs|. |B| is the number of buckets. |Bk|, k ∈ [1, s] represents the number of tuples in the bucket.
2) Calculate the upper boundary of l, P 3) If l < P
While|B| ≥ l do a) e = ∅;
b) exhausting search from all possible combinations to find a set of buckets with the minimum variance, B∗ = B∗ 1, B ∗ 2, ..., B ∗ l, B ∗
1 is the bucket with the lowest tuple number in this subset, andB∗
l is the bucket with the largest tuple size among all the buckets;
c) randomly remove one tuple t1 for B1∗ ; d) e = t1;
e) For i for 2 to L do:
i) Remove one tupleti from(B∗− B∗1)that min-imize theIL(t1∪ e);
ii) e = ti∪ e; f) E = E ∪ e
g) Update the order of B and removeBiif|Bi| = 0; 4) Else
While|B| ≥ l do a) e = ∅;
b) randomly remove one tuplet1 for B1; c) e = t1;
d) For i for 2 to L do:
i) Remove one tuple ti from Bi that minimize the IL(ti∪ e);
ii) e = ti∪ e; e) E = E ∪ e
f) Update the order of B and removeBi if|Bi| = 0; After the selecting, the residual tuples are in R, R = {t1, t2, ..tk}
Incorporating
1) Order R by sensitivity ranking levels from high to low; 2) Select the first tupleti from R;
3) E′
= {e|e ∈ E&&ti[SAr] 6= tj[SAr], tj ∈ e}; 4) If |E′| 6= 0, find e in E′
that minimize IL(t ∪ e); else, Find e in E that minimizeEM (t ∪ e); 5) e = t ∪ e
V. EXPERIMENT AND RESULTS
A. Data sets
The benchmark Adults dataset from U.C. Irvin Machine Learning Repository was used for experiments [16]. There are 30162 records after filtering those with missing values, and it contains 6 numerical attributes and 8 categorical attributes. In our experiments, we chose seven of those attributes to be quasi-identifier attributes: Age, Final weight, Education Number, Gender, Marital Status, Race, Hours per week, and Occupation to be the sensitive attribute. Occupation has 14 attribute values. Since the number of attribute values is quite small, the mapping from sensitive values to sensitivity ranking levels is straightforward. In our experiments, we mapped 14 sensitive values to 10 sensitivity ranking levels.
In order to demonstrate the performance of Unique Distinct l-SR diversity algorithm on sensitive attributes which have a large amount of sensitive values, we generated a new sensitive attribute, Disease, and added it into the Adults data set. This synthetic data set, namely Disease data set, has the same seven quasi-identifier attributes as Adults data set and uses Disease as the sensitive attributes instead of Occupation. The attribute values in Disease attribute were obtained from MeSH (Medical Subject Headings)[17]. 500 medical terms in disease category were randomly taken from MeSH. The sensitivity ranking level of each disease term was calculated based on the MeSH tree. MeSH tree does not represent sensitivity or severity of diseases. For simplifying the process of obtaining sensitivity, we used the MeSH to represent the sensitivity hierarchy of diseases and we assume that sensitivity level of a disease is high if it is more specific in the MeSH tree. We calculated the sensitivity ranking level of lower level nodes and leaf nodes by multiplying weights with sensitivity ranking level of top level nodes.
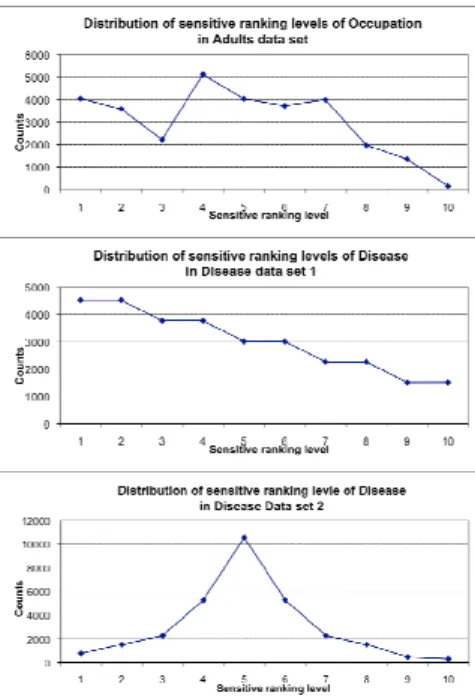
To observe the influence of the distribution of sensitive attributes on our algorithm, we manipulated the distribution of the most frequent sensitive value in disease attribute and created three synthetic Disease data sets with different upper boundaries. Disease data set 1 and 2 have the upper boundary of 6 and 2 respectively. Figure 1 shows the distribution of sensitivity ranking levels of Occupation in Adults data set and sensitivity ranking levels of Disease in Disease data set 1 and 2.
B. The experiment results
We used several parameters to measure both the generaliza-tion of quasi-identifier attributes and the sensitive informageneraliza-tion inference from sensitive attributes. For generalization, we used Information Loss Metric, Discernibility Metric and Average Group Size. We prefer low Information Loss, low Discernibil-ity Metric, and low Average Group Size. For sensitivDiscernibil-ity, we adopted Variance Metric and Entropy Metric. We prefer low
Fig. 1. The distribution of sensitivity ranking levels of the sensitive attribute in Adults and Disease Data set 1 and 2
Variance Metric and high Entropy Metric. Also, we included the elapsed time as the measure for the execution time.
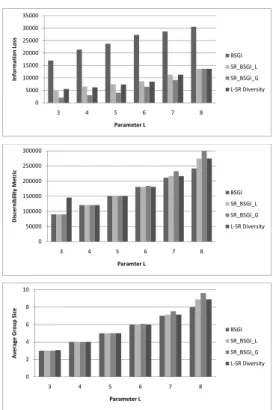
We compared our algorithms mainly with BSGI. We tested four different algorithms in experiments. The first is the original BSGI. The second algorithm is SR BSGI L, in which we adapted BSGI to achieve l-SR diversity. BSGI used local search in minimizing the information loss when generating equivalence classes. Using global search might reduce infor-mation loss, so we have the third algorithm, SR BSGI G, in which we used global search instead of the local search. The last one is our new algorithm, l-SR diversity. Figure 2-3, 4-5, and 6-7 show the performance measures in Adults data set, Disease data set 1 and 2. The elapsed time of these three data sets is showed in Figure 8.
We used two measures for sensitivity aspect: Variance Metric and Entropy Metric. In terms of Variance Metric, l-SR diversity significantly outperforms all other three algorithms in both Diseases and Adults data sets in under boundary cases, while performs similarly with SR BSGI L and SR BSGI G and still outperforms BSGI in the over-boundary cases. Since l-SR diversity algorithm minimizes the variance of an equiv-alence class when forming the equivequiv-alence classes in under boundary cases, its effect is obvious. However, l-SR diversity does not optimize variance in over boundary cases, so there is no significant difference with SR BSGI L, SR BSGI G. Large amount of residual tuples can increase the variance of equivalence classes generated in selecting step, so in over-boundary cases all three algorithms using sensitivity ranking levels performs similarly.
In terms of Entropy Metric, all three algorithms using sensi-tivity ranking levels perform better than BSGI on three Disease data sets, while there is no significant difference on Adults data set. When we compared BSGI with others, we converted
0 10000 20000 30000 40000 50000 60000 3 4 5 6 7 8 In fo rm a ti o n L o ss Parameter L BSGI SR_BSGI_L SR_BSGI_G L-SR Diversity 0 50000 100000 150000 200000 250000 300000 350000 400000 450000 3 4 5 6 7 8 D is ce rn ib il it y M e tr ic Parameter L BSGI SR_BSGI_L SR_BSGI_G L-SR Diversity 0 2 4 6 8 10 12 14 3 4 5 6 7 8 A v e ra g e G ro u p S iz e Parameter L BSGI SR_BSGI_L SR_BSGI_G L-SR Diversity
Fig. 2. Information Loss, Discernibility Metric, and Average Group Size of Adults Data set
0 0.5 1 1.5 2 2.5 3 3 4 5 6 7 8 E n tr o p y M e tr ic Parameter L BSGI SR_BSGI_L SR_BSGI_G L-SR Diversity 0 0.2 0.4 0.6 0.8 1 1.2 3 4 5 6 7 8 V a ri a n c e M e tr ic Parameter L BSGI SR_BSGI_L SR_BSGI_G L-SR Diversity
Fig. 3. Entropy Metric and Variance Metric of Adults Data set
the sensitive values in an equivalence class into sensitivity ranking levels. BSGI reached l-diversity but not l-SR diversity, there are no more than l distinct sensitivity ranking levels in each equivalence class. As a result, BSGI perform worse than other three. l-SR diversity and other two algorithms based on sensitivity ranking levels reached the highest entropy in the under boundary cases since in each equivalence class there
0 5000 10000 15000 20000 25000 30000 35000 3 4 5 6 7 8 In fo rm a ti o n L o ss Parameter L BSGI SR_BSGI_L SR_BSGI_G L-SR Diversity 0 50000 100000 150000 200000 250000 300000 3 4 5 6 7 8 D is ce rn ib il ity M e tr ic Paramter L BSGI SR_BSGI_L SR_BSGI_G L-SR Diversity 0 2 4 6 8 10 3 4 5 6 7 8 A v e ra g e G ro u p S iz e Parameter L BSGI SR_BSGI_L SR_BSGI_G L-SR Diversity
Fig. 4. Information Loss, Discernibility Metric, and Average Group Size of Disease Data set 1
0 0.5 1 1.5 2 2.5 3 3 4 5 6 7 8 E n tr o p y M e tr ic Parameter L BSGI SR_BSGI_L SR_BSGI_G L-SR Diversity 0 0.2 0.4 0.6 0.8 1 1.2 1.4 1.6 1.8 3 4 5 6 7 8 V a ri a n c e M e tr ic Parameter L BSGI SR_BSGI_L SR_BSGI_G L-SR Diversity
Fig. 5. Entropy Metric and Variance Metric of Disease Data set 1
are exactly l distinct sensitivity ranking levels. Although l-SR diversity optimize entropy of equivalence classes in the incorporating step, the optimization in Entropy Metric is very limited. In the under boundary cases, residual tuples needed to be incorporated into equivalence classes is very small. In BSGI, residual tuples is less than l[10]. Since l-SR diversity, SR BSGI L, and SR BSGI G also meet the requirement of
0 5000 10000 15000 20000 25000 30000 35000 3 4 5 6 7 8 In fo rm a ti o n L o ss Parameter L BSGI SR_BSGI_L SR_BSGI_G L-SR Diversity 0 100000 200000 300000 400000 500000 600000 700000 800000 3 4 5 6 7 8 D is c e rn ib il ity M e tr ic Parameter L BSGI SR_BSGI_L SR_BSGI_G L-SR Diversity 0 5 10 15 20 25 3 4 5 6 7 8 A v e ra g e G ro u p S iz e Parameter L BSGI SR_BSGI_L SR_BSGI_G L-SR Diversity
Fig. 6. Information Loss, Discernibility Metric, and Average Group Size of Disease Data set 2
0 0.5 1 1.5 2 2.5 3 3 4 5 6 7 8 E n tr o p y M e tr ic Parameter L BSGI SR_BSGI_L SR_BSGI_G L-SR Diversity 0 0.1 0.2 0.3 0.4 0.5 0.6 0.7 0.8 0.9 3 4 5 6 7 8 V a ri a n c e M e tr ic Parameter L BSGI SR_BSGI_L SR_BSGI_G L-SR Diversity
Fig. 7. Entropy Metric and Variance Metric of Disease Data set 2
unique distinct l diversity, the residual tuples of these three algorithms are also less than l in under boundary cases. In the over-boundary cases, although there are large amount of residual tuples for l-SR diversity, the number of equivalence classes that can be chosen in incorporating step is limited. Therefore, there is no significant difference between these three algorithms using sensitivity ranking levels on Entropy
Fig. 8. Elapsed time of Adults, Disease Dataset 1 and 2
Metric.
Comparing the performance of four algorithms in Infor-mation Loss metric, three algorithms using sensitivity rank-ing levels outperforms BSGI in three Disease data sets and performs similarly in Adults data set. Since BSGI used the original 14 sensitive values in Occupation and 500 disease terms in Disease, it has much bigger upper boundary for Unique Distinct l-diversity. l-SR diversity, SR BSGI L, and SR BSGI G have 10 sensitivity ranking levels, so they have the same boundary for reaching Unique Distinct l-SR diversity. The size of buckets in BSGI is small compared with other three algorithms since the number of sensitive values is larger than sensitivity levels. Therefore, the search range in each bucket for optimizing information loss is small, and as a result, the information loss for BSGI is larger than other three algorithms. SR BSGI G outperforms l-SR diversity and SR BSGI L in under boundary cases. Although using global search can decrease Information Loss, the elapsed time in-crease dramatically.
Discernibility Metric and Average Group Size are two other measures for the generation on original data set. There is no significant difference between four algorithms on these two measures in under boundary cases and BSGI performs better in over boundary cases. Discernibility Metric is a measure on the tuple level and Average Group Size is on the equivalence class level. Discernibility Metric and Average Group Size are largely rely on the number of equivalence classes generated. In under boundary for both Unique Distinct l-SR diversity and Unique Distinct l-diversity, BSGI and other three algorithms will generate same amount of equivalence classes. They perform
same in Discernibility Metric and Average Group Size in under boundary. However, in over boundary for Unique Distinct l-SR diversity, it has not reached the boundary of Unique Distinct l-diversity. BSGI is able to generate more equivalence classes than l-SR diversity, so it performs better than other three algorithms. Nevertheless, information Loss is a finer grained measure than Discernibility Metric and Average Group Size since it measures the generalization on the attribute level. This is probably one of reasons that Information Loss showed some difference between these algorithms in under boundary cases, but Discernibility Metric and Average Group Size did not. We suggest that Information loss is more important than Discernibility Metric and Average Group Size.
For the elapsed time, all four data sets show that SR BSGI G performs worst and BSGI is the most efficient. l-SR diversity and SR BSGI L’s execution time is between SR BSGI G and BSGI. The efficiency of the four algorithms is basically determined by the number of the records searched during each time of forming a new equivalence class. l-SR diversity has larger search range than the SR BSGI L because it will search the bucket with the highest number of instances. BSGI was compared with Mondrian [7] and Incognito[6], which were two k-anonymity algorithms, but were modified from k-anonymity algorithms into l-diversity algorithms by Ye et al. [10]. BSGI outperformed Mondrian and Incognito in terms of generalization measures and execution time. BSGI minimized Information Loss in the selecting and incorporating steps and Information Loss is a finer-grained measure for generalization than Discernibility Metric and Average Group Size, so it reached better performance in Information Loss, Discernibility Metric and Average Group Size. We can infer that l-SR diversity algorithm will outperform Mondrian and Incognito in generalization measures since it outperforms BSGI on Information Loss and is comparable on Discernibility Metric and Average Group Size.
In summary, l-SR diversity performs better than BSGI and SR BSGI L and SR BSGI G in terms of sensitivity measures and comparable in generalization measures and execution time. Since the purpose of designing l-SR diversity is to im-prove the aspect of preventing sensitivity attack, l-SR diversity meets our requirement. It also confirms the hypothesis we generated in Section 3.4.
VI. CONCLUSION ANDFUTUREWORK
Given the limitations of both the k-anonymity and l-diversity, we introduce a new model: Unique Distinct l-SR diversity. This model is based a new perspective: sensitivity of private information. As far as we know, no other studies have considered sensitivity in data publishing models. Using this l-SR diversity model, the released data can prevent the sensitivity attack better than other l-diversity models. We also presented two performance measures: Entropy Metric and Variance Metric for inference of sensitive information from equivalence classes. We developed an algorithm l-SR diver-sity to achieve Unique Distinct l-SR diverdiver-sity. l-SR diverdiver-sity algorithms showed better performance than BSGI in sensitivity
aspect. In generalization aspect, l-SR diversity outperforms BSGI on Information Loss and is comparable on Discernibility Metric and Average Group Size. l-SR diversity outperforms SR BSGI G and SR BSGI L on Variances Metric and is comparable with on Entropy Metric and generation measures. With regards to the efficiency, l-SR diversity performs better than SR BSGI G but worse than SR BSGI L and BSGI. Unique Distinct l-SR diversity is a better model than Unique Distinct l-diversity and it can provide better protection in limiting the impact of privacy disclosure as well as same protection in identifying individuals from the released data.
Although l-SR diversity showed some advantages over other l-diversity algorithms especially in sensitivity measures, there is some future work to improve l-SR diversity algorithm. Firstly, we still need to improve the performance l-SR diversity in over boundary cases. One method could be making l-SR diversity as recursive l-l-SR diversity in over boundary cases, so we can generate more equivalence classes when the distribution of sensitivity ranking levels are very unbalanced. Secondly, the execution time of l-SR diversity is not desirable, but we could improve it by reducing the searching range when generating equivalence classes.
REFERENCES
[1] L. SWEENEY, k-anonymity: a Model for Protecting Privacy, Interna-tional Journal on uncertainty, Fuzziness and Knowledge-based Systems, 2002, 10(5), pp. 557-570.
[2] A. MACHANAVAJJHALA, J. GEHRKE,ANDD. KIFER, l-diversity:
Pri-vacy beyond k-anonymity, ICDE, 2006, pp. 24.
[3] N. LI, T. LI,ANDS. VENKATASUBRAMANIAN, t-Closeness: Privacy
Beyond k-anonymity and l-diversity, ICDE, 2007, pp. 106-115. [4] K. WANG, B.C. M. FUNG, ANDP.S. YU, Handicapping Attacker’s
Confidence: an Alternative tok-anonymization, Knowledge and Infor-mation Systems(KAIS),2007, 11(3), pp. 345-368.
[5] B.C.M. FUND, K. WANG, ANDP.S. YU Anonymizing Classfication Data for Privacy Preservation, IEEE Transactions on Knowledge and Data Engineering, 2007, 19(5): pp. 711-725.
[6] X. XIAO ANDY. TAOAnatomy: simple and effective privacy perserva-tion, Proc. of the 32nd Very Large Data Bases(VLDB), Seoul, Korea. 2006, pp. 139-150.
[7] X. XIAO ANDY. TAOPersonalized privacy preservation, Proc. of ACM SIGMOD, Chicago, IL, USA, 2006, pp. 229-240.
[8] X. XIAO ANDY. TAO m-invariance: Towards privacy preserving re-publication of dynamic datasets, Proc. of ACM SIGMOD, Beijing, China, 2007, pp. 689-700.
[9] J. LI, Y. TAO,ANDX. XIAOPreservation of proximity privacy in pub-lishing numerical sensitive data, Proc. of ACM SIGMOD, Vancouver, Canada, 2008, pp. 473-486.
[10] Y. YE, C. DENG, C. WANG, D. LV, D., Y. LU,ANDJ. FENG, BSGI: an
Effective Algorithm Towards Strongerl-diversity, DEXA 2008, LNCS 5181, 2008, pp. 19-32.
[11] N. MOHAMMED, B. C. M. FUNG, P. C. K. HUNG,ANDC. K. LEE,
Anonymizaing heathcare data: a case study on the blood transfusion service, Proc. of ACM SIGKDD, 2009, pp.1285-1294.
[12] P. FULE,ANDJ. F. RODDICK, Detecting privacy and ethical sensitivity
in data mining results, Twenty-Seventh Australasian Computer Science Conference, ACSC 2004, Dunedin, New Zealand.
[13] S. AI-FEDAGHI, How sensitive is your personal information?, SAC’07, March 11-15, 2007, Seoul, Korea.
[14] K. LEFEVRE, D.J. DEWITT, AND R. RAMAKRISHNAN, Incognito:
Efficient full-domain k-anonymity, SIGMOD, 2005, pp. 49-60. [15] K. LEFEVRE, D.J. DEWITT, AND R. RAMAKRISHNAN, Mondrian
multidimensional k-anonymity, ICDE, 2006, pp. 25.
[16] U.C. Irvin Machine Learning Repository, http:// archive.ics.uci.edu/ml/ [17] Medical Subject Headings, http://www.nlm.nih.gov/mesh/.