doi: 10.1098/rspb.2010.0794
, 3327-3333 first published online 9 June 2010
277
2010
Proc. R. Soc. B
Manabu Sakamoto
theropod dinosaurs
Jaw biomechanics and the evolution of biting performance in
Supplementary data
tml
http://rspb.royalsocietypublishing.org/content/suppl/2010/06/02/rspb.2010.0794.DC1.h
"Data Supplement"
References
http://rspb.royalsocietypublishing.org/content/277/1698/3327.full.html#ref-list-1
This article cites 39 articles, 8 of which can be accessed free
Subject collections
(2213 articles)
evolution
(157 articles)
biomechanics
(132 articles)
palaeontology
Articles on similar topics can be found in the following collections
Email alerting service
right-hand corner of the article or click Receive free email alerts when new articles cite this article - sign up in the box at the topherehttp://rspb.royalsocietypublishing.org/subscriptions
go to:
Proc. R. Soc. B
To subscribe to
Jaw biomechanics and the evolution of
biting performance in theropod dinosaurs
Manabu Sakamoto*
Department of Earth Sciences, University of Bristol, Queen’s Road, Bristol BS8 1RJ, UK
Despite the great diversity in theropod craniomandibular morphology, the presence and distribution of biting function types across Theropoda has rarely been assessed. A novel method of biomechanical profil-ing usprofil-ing mechanical advantage computed for each bitprofil-ing position along the entirety of the tooth row was applied to 41 extinct theropod taxa. Multivariate ordination on the polynomial coefficients of the profiles reveals the distribution of theropod biting performance in function space. In particular, coelophysoids are found to occupy a unique region of function space, while tetanurans have a wide but continuous function space distribution. Further, the underlying phylogenetic structure and evolution of biting performance were investigated using phylogenetic comparative methods. There is a strong phylogenetic signal in ther-opod biomechanical profiles, indicating that evolution of biting performance does not depart from Brownian motion evolution. Reconstructions of ancestral function space occupation conform to this pat-tern, but phylogenetically unexpected major shifts in function space occupation can be observed at the origins of some clades. However, uncertainties surround ancestor estimates in some of these internal nodes, so inferences on the nature of these evolutionary changes must be viewed with caution.
Keywords: biomechanics; biting performance; theropods; phylogenetic comparative methods
1. INTRODUCTION
Theropod dinosaurs display a high degree of cranioman-dibular morphological diversity, which can lead one to infer equally diverse feeding mechanisms, and thus feed-ing preferences, strategies, behaviours and ecology (Bakker 1986; Paul 1988; Henderson 2000; Barrett 2005; Barrett & Rayfield 2006). Biomechanical models have been used as a quantitative means to investigate the mechanics of feeding in theropods (Molnar 2000; Henderson 2002; Therrien et al. 2005), and such models have reached a new level of complexity with the advent of high-resolution computer modelling methods (Rayfield 2007). Such comparative biomechanical studies rely on the assumption, even though rarely explicitly stated, that the selected taxa truly represent different function types (such as ‘typical’ or ‘specialized’), but the presence and distribution of function types across Theropoda have rarely been assessed. Thus, we are left with an unanswered fundamental question: how do biting performances differ among theropod taxa? Here, a simple but novel method of ‘biomechanical profiling’ is devised to capture overall biting performance along the entirety of the tooth row. Further, multivariate ordina-tion is employed to visualize ‘funcordina-tion space’ (Anderson 2009) occupation.
Another important question that is seldom asked is: what is the evolutionary history or the underlying phylo-genetic structure of biting performance in theropods (Westneat 1995, 2004; Sakamoto et al. 2010)? Without a proper phylogenetic framework, biomechanical studies lack evolutionary context. There are numerous methods available for phylogenetically informed comparisons
(phylogenetic comparative methods, PCMs; Harvey & Pagel 1991), but it is essential first to test for phylogenetic signal because PCMs may not produce reliable results if the data are not correlated with phylogeny (Laurin 2004). Testing for phylogenetic signal in itself is also of interest, as this allows further interpretation about the evolution of biting performance in theropods.
2. MATERIAL AND METHODS (a)Biomechanical profiling
Biting performance is quantified using a specifically defined and well-established biomechanical metric, mechanical advan-tage (MA;Westneat 1994), the ratio between the moment arm of the muscle moment (effort) and the moment arm of the biting moment (load). MAs were computed for each biting position along the entirety of the tooth row (figure 1) in 41 theropod taxa and the outgroup Plateosaurus, using a simple two-dimensional lever model. Potentially valuable three-dimensional information can be lost by this simplification, but the benefits of using explicitly defined simple models outweigh the drawbacks; for example, their explicitness and statistical rigour. Muscle reconstructions are based on anatomical observations of modern avian and crocodilian jaw adductor musculature (M. Sakamoto 2005– 2008, personal observation; but also Holliday & Witmer 2007; Holliday 2009; electronic supplementary material, figure S1).
Since theropods have vastly differing tooth counts, direct comparisons are not possible without standardization of biting positions. Following their computation from absolute distances, MAs were plotted against corresponding biting positions scaled as percentage of tooth row length (figure 1
and electronic supplementary material, figure S4). Then a polynomial function of either the second order ( y ¼b0þ
b1x1þ b2x22), third order ( y ¼b0þ b1x1þ b2x22þ b3x33) or
fourth order ( y ¼b0þ b1x1þ b2x22þ b3x33þ b4x44) was
fitted (electronic supplementary material, figure S4) based *[email protected]
Electronic supplementary material is available athttp://dx.doi.org/10.
1098/rspb.2010.0794or viahttp://rspb.royalsocietypublishing.org.
Proc. R. Soc. B (2010) 277, 3327–3333 doi:10.1098/rspb.2010.0794 Published online 9 June 2010
Received 14 April 2010
on the fit of the nth-order polynomial determined by Akaike information criteria weights in the paleoTS library (Hunt 2008) in R (R Core Development Team 2009). The three common coefficients of the polynomial functions (b0, b1
and b2) were subjected to principal components analysis
(PCA) using PAST (Hammer et al. 2001) to visualize function space occupation by theropod clades.
(b)Phylogenetic comparative methods
The phylogeny ofLloyd et al. (2008)formed the basis of all comparative analyses (electronic supplementary material, figures S5 and S6).
(i) Testing for phylogenetic signals
In order to test for phylogenetic signals in the biomechanical variables, the phylogenetic eigenvector regression (PVR;
Diniz-Filho et al. 1998) was employed (Sakamoto et al. 2010). PVR is based on a multiple linear regression in which phylogeny, the predictor variable, is represented as eigenvectors (or principal coordinates axes) of a phylogenetic distance matrix. A multivariate multiple regression was per-formed in R with the polynomial coefficients as the response variable matrix and the first 34 eigenvectors (explaining 95% of phylogenetic variance) as the predictor variables.
Another test for detecting phylogenetic signal devised by
Blomberg et al. (2003) was conducted using the picante library (Kembel et al. 2009) in R. This method uses phylo-genetically independent contrasts (PIC; Felsenstein 1985) and compares the variances of the PIC computed from a given variable on a particular tree topology with those com-puted from permutations of the variable across the same tree. If the variances in PIC for the real data are lower than those from the permutations, then there is a significant phy-logenetic signal (Blomberg et al. 2003). Blomberg et al.’s (2003) K statistic was also computed; K, 1 would indicate that closely related taxa have values that are less similar than
expected under Brownian motion evolution (departure from Brownian motion, such as adaptive evolution), while K. 1 would indicate that closely related taxa have values more similar than expected, thus a strong phylogenetic signal (Blomberg et al. 2003).
(ii) Tracing the evolution of function space occupation
To trace the evolution of function space occupation, nodal values (ancestors) were estimated for the three polynomial coefficients separately using the maximum-likelihood (ML) method of ancestor character estimation (Schluter et al. 1997) available in the APE library (Paradis et al. 2004) in R. PCA was conducted on ancestor estimates and terminal values to visualize the evolution of function space occupation across phylogeny.
3. RESULTS
(a)Biomechanical profiling
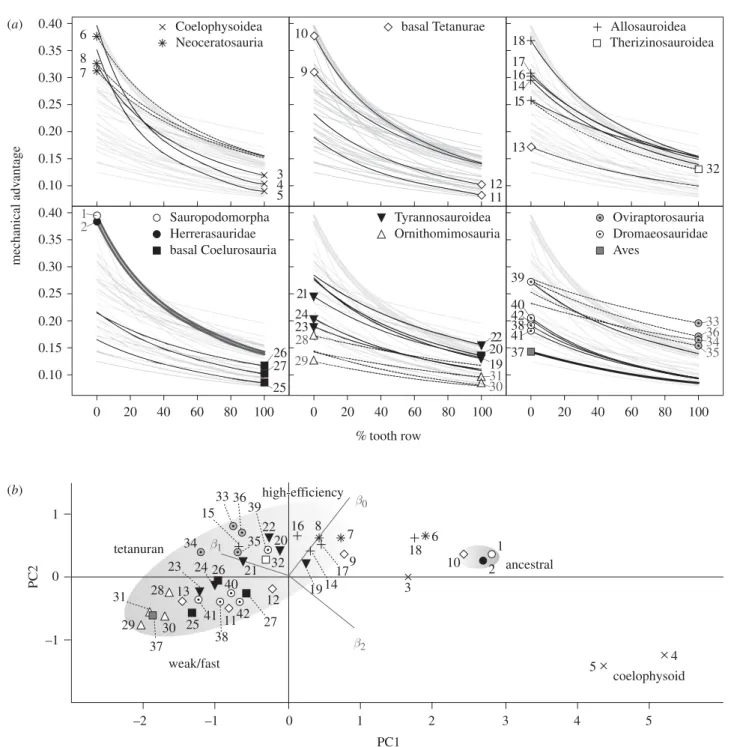
Biomechanical profiling reveals a continuum of various MA profiles along the vertical axis (figure 2a). The basal taxa Plateosaurus and Herrerasaurus are situated at the higher end of the vertical axis. Many taxa share a simi-lar profile, with a gradual parabolic decline in MA values from the 0 – 100% tooth row positions, the only major difference being their vertical positions. However, some taxa exhibit profiles with steeper slopes and parabolic cur-vatures, while some show the opposite with shallower slopes and parabolic curvatures.
PCA of the polynomial coefficients distinguishes these differences (figure 2b); there is a clear distinction between the Tetanurae (but also Carnotaurus and Majungasaurus) and the basal taxa Plateosaurus, Herrerasaurus and coelo-physoids (but also Eustreptospondylus, Ceratosaurus and Carcharodontosaurus). Taxa with steeper slopes and curves score higher along PC1 while taxa with shallower slopes and curves score lower. Separation along PC2 arises mostly from the contrast between vertical positioning and parabolic curvature. Tetanuran taxa are distributed along a major axis inclined at roughly 258 from the PC1 axis (figure 2b) with the ‘high-efficiency’ function types towards the top half and ‘weak/fast’ function types towards the bottom half of the distribution.
(b)Phylogenetic comparative methods (i) Testing for phylogenetic signals
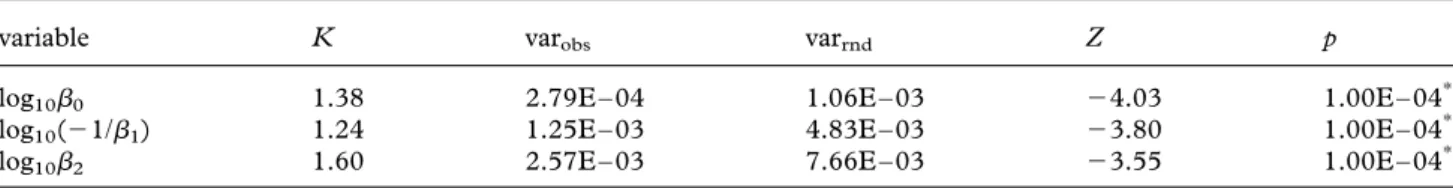
A multivariate PVR test shows a significant correlation between the polynomial coefficients and the first 34 phy-logenetic eigenvectors (tables1and2).Blomberg et al.’s (2003) test also detects significant phylogenetic signals in all three coefficients and results in K. 1 (table 3). (ii) Tracing the evolution of function space occupation PCA of the polynomial coefficients and their ML ancestor node estimates reveals that the common ancestors of Saurischia and Theropoda (figure 3, nodes 43 and 44, respectively) occupied a similar position in function space. While the common ancestor of Neoceratosauria (node 49) retains close to the ancestral function space, there is a shift towards the lower spectrum of the PC1 axis at the common ancestor of Tetanurae (node 51), with subsequent clades within Tetanurae all originating further along this axis. While Allosauroidea (node 57) originate at the high-efficiency end of the tetanuran
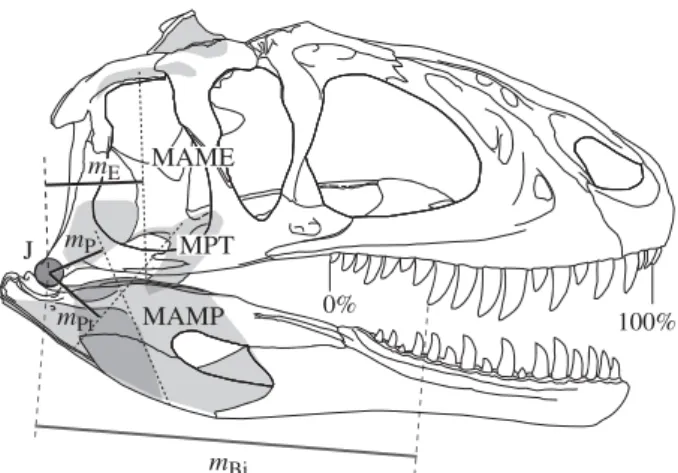
MAME MPT MAMP mPt mE mP mBi 0% 100% J
Figure 1. Biomechanical profiling by application of a simple biomechanical model and standardization of tooth row length. The skull of Sinraptor (modified from Currie & Zhao 1993) is shown with attachments and lines of action of three major muscle groups; M. adductor mandibulae externus group (MAME), M. adductor mandibulae posterior group (MAMP), and M. pterygoideus group (MPT). The distances from the jaw joint ( J ) to these lines of action are the effort arms (mE, mP and mPt for each muscle group,
respectively). Load arms mBi are taken as the distances
between J and bite points along the entirety of the tooth row. Biting positions are represented as percentages of the tooth row, with 0% and 100% being the posterior- and anterior-most positions, respectively.
3328 M. Sakamoto Evolution of theropod biting performance
distribution, Coelurosauria (node 61) and Tyrannosaur-oidea (node 66) originate close to the weak/fast biter end (figure 3). Both Ornithomimosauriaþ Maniraptora clade (node 70) and Maniraptora (node 74) originate at the weak/fast end of the tetanuran distribution, but the common ancestor of Therizinosauroidea and Oviraptoro-sauria (node 75) plots out towards the high-efficiency end.
4. DISCUSSION
(a)Biomechanical profiling and function space occupation
Biomechanical profiling using MA along the entirety of the tooth row allows for investigation of functional disparity patterns across Theropoda (figure 2). Bio-mechanical profiles not only quantify the magnitudes of
mechanical adv antage % tooth row 0.10 0.15 0.20 0.25 0.30 0.35 0.40 0.10 0.15 0.20 0.25 0.30 0.35 0.40 (a) (b) 7 6 8 5 3 4 Coelophysoidea Neoceratosauria 17 16 18 13 14 15 Allosauroidea Therizinosauroidea 32 0 20 40 60 80 100 25 26 27 basal Coelurosauria 2 1 Herrerasauridae Sauropodomorpha basal Tetanurae 11 9 10 12 0 20 40 60 80 100 20 23 19 24 21 22 Tyrannosauroidea 29 28 30 31 Ornithomimosauria 0 20 40 60 80 100 37 41 42 39 38 40 33 35 36 34 Aves Oviraptorosauria Dromaeosauridae –2 –1 1 2 3 4 5 –1 1 0 0 β0 β1 β2 20 22 32 39 41 7 8 9 14 16 17 19 11 12 27 38 40 42 13 23 24 25 28 29 30 31 34 37 26 15 21 33 35 36 1 2 3 6 10 18 4 5 weak/fast ancestral coelophysoid PC1 PC2 high-efficiency tetanuran
Figure 2. Biomechanical profile plots and function space occupation. (a) Best-fit polynomial lines for MA against per cent tooth row in 41 theropod taxa and Plateosaurus represent biomechanical profiles of biting efficiency along the entirety of the tooth rows. Vertical position relates to the magnitude of MA, slope relates to the degree of change in MA along the tooth row and curvature relates to the degree of change in slope along the tooth row. (b) A plot of the first two principal components (PC) scores of the polynomial coefficients visualizes function space occupation. PC1 and PC2 account for 89.9% and 9.9% of the variance, respectively (both axes are to scale). The relationships of the polynomial coefficients with the PC axes are also shown. Tetanuran taxa form a continuous distribution, with a major axis corresponding to the spectrum of biting effi-ciency. Labels: 1, Plateosaurus; 2, Herrerasaurus; 3, Dilophosaurus; 4, Syntarsus; 5, Coelophysis; 6, Ceratosaurus; 7, Carnotaurus; 8, Majungasaurus; 9, Dubreuillosaurus; 10, Eustreptospondylus; 11, baryonichine; 12, Spinosaurus; 13, Monolophosaurus; 14, Sinraptor; 15, Yangchuanosaurus; 16, Allosaurus; 17, Acrocanthosaurus; 18, Carcharodontosaurus; 19, Gorgosaurus; 20, Daspletosaurus; 21, Tarbosaurus; 22, Tyrannosaurus; 23, Dilong; 24, Guanlong; 25, Compsognathus; 26, Ornitholestes; 27, Proceratosaurus; 28, Garudimimus; 29, Gallimimus; 30, Ornithomimus; 31, Struthiomimus; 32, Erlikosaurus; 33, Citipati; 34, Kamyn Khondt oviraptorosaur; 35, Ingenia; 36, Khaan; 37, Archaeopteryx; 38, Sinornithosaurus; 39, Dromaeosaurus, 40, Velociraptor; 41, Bambiraptor; 42, Deinonychus.
MA, but also subtle mechanical characteristics of tooth row morphology in relation to the effort arms. The verti-cal position of the profile (b0) relates to the proximity of
the tooth row to the jaw muscles, while the slope (b1)
relates to the length of the tooth row. The parabolic curvature (b2) relates to a combination of these two
characteristics; steeper curves are associated with long tooth rows that are in close proximity to jaw muscles.
Function space occupation by theropod taxa shows interesting disparity patterns. At the high-efficiency end of the tetanuran function space distribution, tyranno-saurs, allosaurs and ceratosaurs plot out close to each other despite their obviously different cranial morphology. Allosaurs have long been considered to be weak biters (Bakker 1998; Rayfield et al. 2001), but strikingly, their MA profiles are here found to be similar to those of abe-lisaurid ceratosaurs. Although MA does not take into account the magnitude of muscle forces, previous recon-structions of muscles however have also yielded similar bite forces for Allosaurus and Carnotaurus (Rayfield et al. 2001; Mazzetta et al. 2004, 2009), further supporting functional similarities in these two disparate clades. An extreme case of high-efficiency biting and functional convergence with ceratosaurs can be observed in Carcharodontosaurus, which plots beyond the range of distribution of tetanuran theropods and converges with Ceratosaurus towards the ancestral function space.
Derived tyrannosaur profiles, on the other hand, are dis-tinguished from allosaurs and ceratosaurs in having shallower slopes. In particular, Tyrannosaurus exhibits higher consistency in MA along the entirety of its tooth row (figure 2), enabling it to maintain high bite force more ros-trally than in other theropods. Oviraptorosaurs have lower b0values, so were less powerful biters than other
high-effi-ciency biters, but their extremely highb1values make them
the most efficient at the 100 per cent tooth row position. Weak/fast biters exhibit rostrally displaced tooth rows (high mB) along with posteriorly positioned/oriented
muscles (low mM). Their consistently low MA values
throughout their tooth rows indicate they were less effi-cient at delivering forceful crushing bites, but more effective in fast snapping bites. Weak/fast biters are typi-cally small- to medium-sized theropods, with the
exception of spinosaurs; fast biting is suitable for pisciv-ory. Dromaeosaurs are here found to be low-efficiency biters, but this does not preclude the possibility that they were ‘big-game hunters’ (Paul 1988, p. 364) because if they did indeed use their sickle claws, then ‘the jaws were secondary weapons’ (Paul 1988, p. 364). Further, weak-biting Varanus komodoensis (Moreno et al. 2008) is capable of inflicting deep wounds through saw-motion biting (Auffenberg 1981), so it is not difficult to imagine dromaeosaurs similarly delivering saw-motion bites if kicks were not enough to kill their prey.
(b)The evolution of biting performance in theropods
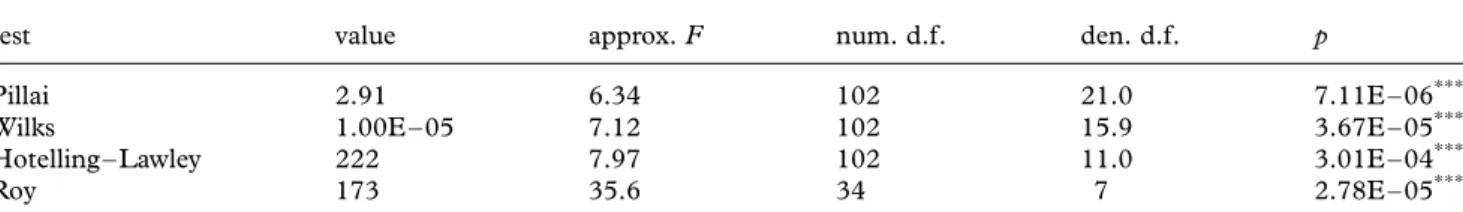
The strong phylogenetic signal in polynomial coefficients (tables1–3) can be observed in phylogenetic reconstruc-tions of ancestral function space occupation (figure 3); with a few exceptions, most theropods plot out in function space relatively consistent with phylogeny or following a phylogenetic trajectory. It is also noteworthy that, while changes close to the terminals are relatively small (except for coelophysoids), there are major shifts at the bases of clades, in particular Neoceratosauria (node 49), Tetanurae (node 51), Allosauroidea (node 57), Tyrannosauridae (node 63) and the Oviraptorosauriaþ Therizinosauroidea clade (node 75). This implies either (i) that these large changes arise from methodological artefacts of ML ancestor estimation, (ii) that taxonomic (and temporal) coverage close to the origins of clades (basal members or sister taxa) are not sufficient, or (iii) that evolution of biting performance across Thero-poda actually occurred more rapidly at the origins of clades. The former two implications are most certainly applicable for the basal nodes (especially node 48) in which ancestor estimates are quite likely affected by com-putational artefacts (figure 3). Similarly, tyrannosauroid sampling suffers from a long temporal gap between the basal and derived taxa, so a major shift in function space occupation at the base of Tyrannosauridae is not at all surprising considering branch duration. On the other hand, there is good support for the suggestion that the origin of the Oviraptorosauriaþ Therizinosauroi-dea clade was associated with a genuine shift in function space occupation; under Brownian motion evolution, this clade would be both phylogenetically and temporally (electronic supplementary material, figure S6) expected to originate in function space proximal to parent and sister nodes but also to basal coelurosaur taxa (figure 3). The same may be true also for Allosauroidea considering its relationship in function space with the common ancestor of Coelurosauria, but the tentative nature of ancestor estimates for Tetanurae and thus Avetheropoda warrants caution in this interpretation. Table 1. Overall significance of the multivariate phylogenetic eigenvector regression. Approximate F-values, degrees of freedom and p-values are shown for each test statistic. ***Significant at 0.001.
test value approx. F num. d.f. den. d.f. p
Pillai 2.91 6.34 102 21.0 7.11E – 06***
Wilks 1.00E – 05 7.12 102 15.9 3.67E – 05***
Hotelling – Lawley 222 7.97 102 11.0 3.01E – 04***
Roy 173 35.6 34 7 2.78E – 05***
Table 2. Univariate significances of the regressions of each response variable. Multiple R2, adjusted R2, F- and p-values are presented for each response variable. **Significant at 0.01; ***significant at 0.001.
response mult. R2 adj. R2 F p
b0 0.968 0.812 6.20 8.87E – 03**
b1 0.978 0.871 9.13 2.69E – 03**
b2 0.985 0.912 13.5 7.60E – 04***
3330 M. Sakamoto Evolution of theropod biting performance
An important observation is that the coelophysoids Coelophysis and Syntarsus do not represent a primitive condition for Theropoda with respect to biting perform-ance, but instead are unique functional specialists; their basal phylogenetic positions are not reflected in their biomechanical profiles.
(c) Phylogenetic structure of variance in biting performance
The presence of a significant and strong phylogenetic signal (tables 1–3) in theropod biomechanical profiles indicates that the evolution of biting performance mirrors phylogeny. Phylogenetic distance is the primary source of
difference in biomechanical profiles, and unique selection pressures that may cause differential rates of change in individual branches are rare (non-departure from Brow-nian motion). This is a striking revelation since it counters the intuition that functional characters would be expected to be under unique selective pressures. How-ever, the underlying mechanism of this phylogenetic signal, whether constraint or inertia (Blomberg et al. 2003;McKitrick 1993), may never be known.
(d)Issues with biomechanical modelling
In reality, musculoskeletal systems are complex, both geo-metrically and physiologically. Any form of biomechanical
−2 0 2 4 6 −1.5 −1.0 −0.5 0 0.5 PC1 PC2 Herrerasauridae Coelophysoidea Neoceratosauria basal Tetanurae Allosauroidea Tyrannosauroidea basal Coelurosauria Ornithomimosauria Therizinosauroidea Aves Oviraptorosauria Sauropodomorpha Dromaeosauridae 51 70 75 57 62 74 44 43 Saurischia Theropoda 49 61 56 48 63 20 22 32 39 41 7 8 9 14 16 17 19 11 12 27 38 40 42 13 23 24 25 28 29 30 31 34 37 26 15 21 33 35 36 1 2 3 6 10 18 4 5
Figure 3. Evolution of function space occupation. The evolution of function space occupation can be traced through ML ances-tor estimation and PCA on the terminal and nodal values. PC1 and PC2 account for 90.6% and 8.9% of the total variance, respectively (axes are not to scale; PC2 is exaggerated for graphical purposes only and should not be read literally). Internal nodes are displayed as grey points and nodes at major clades are indicated by arrows. Internal and terminal branches are shown in solid and dotted lines, respectively. Labels: 43, Saurischia; 44, Theropoda; 48, Neotheropoda; 49, Neoceratosauria; 51, Tetanurae; 56, Avetheropoda; 57, Allosauroidea; 61, Coelurosauria; 62, Tyrannosauroidea; 63, Tyrannosauridae; 70, Maniraptoraþ Ornithomimosauria; 74, Maniraptora; 75, Oviraptorosauria þ Therizinosauroidea; terminal labels as in
figure 2.
Table 3. Strength and significance of phylogenetic signal in biomechanical coefficients using Blomberg et al.’s (2003) method. K-statistic indicating strength of phylogenetic signal, observed variance of the PIC (varobs), mean variance of PIC
from the permutation (varrnd), Z-score of observed versus random variance of PIC and p-value of observed versus random
variance of PIC (Kembel et al. 2009) are shown for each variable (transformed coefficients). ***Significant at 0.001.
variable K varobs varrnd Z p
log10b0 1.38 2.79E – 04 1.06E – 03 24.03 1.00E – 04***
log10(21/b1) 1.24 1.25E – 03 4.83E – 03 23.80 1.00E – 04***
modelling necessitates a certain level of approximation. Different models allow for different degrees of sophisti-cation: for instance, a dynamic versus a static model, two-dimensional versus three-dimensional or inclusion versus exclusion of various parameters. Dynamic models can model in vivo motions with reasonable accuracy (Moazen et al. 2008), and can also estimate static bio-mechanical values such as bite force with relative accuracy (Moazen et al. 2008). However, static models have also been demonstrated to estimate bite force accu-rately (Sinclair & Alexander 1987; Cleuren et al. 1995; Herrel et al. 1998). Differences in two- and three-dimen-sional models are yet to be investigated in detail, but a recent study would indicate that the two models result in comparable bite force estimates (McHenry et al. 2007). Inclusion of additional model parameters can cer-tainly add sophistication but at the same time increase potential error. This is primarily because of the funda-mental uncertainties associated with the estimation of these variables, many of which remain to be validated. Recruitment patterns of muscle activity are difficult to determine in vivo (Busbey 1989) and are approximated using electromyographical data (Cleuren et al. 1995), which are not available in fossil taxa. Nevertheless, inclusion of such information in models for extant taxa did not result in bite force estimates that were significantly different from those estimated by simple models assuming simultaneous muscular action (Cleuren et al. 1995). The effects of muscle pennation can be substantial in estimating physiological cross-sectional areas of muscles (Biewener & Full 1992), but is often complicated and difficult to quantify even in living forms (Busbey 1989; Hieronymus 2006; M. Sakamoto 2005 – 2008, personal observation). Again, there is no means of estimating muscle pennation in fossil forms. On the other hand, it is possible to estimate muscle size from some osteological correlate, but such estimates are simply a matter of scaling (i.e. reflecting size of the bony element). More impor-tantly, size can span several orders of magnitude (compare Compsognathus and Tyrannosaurus), dwarfing any size-independent biomechanical variation; the model would effectively be capturing size and not function. Several authors have sought to eliminate this size-associated variance to isolate the biting function by either post hoc scaling (Wroe et al. 2005; Christiansen & Wroe 2007; Sakamoto et al. 2010) or a priori scaling (Dumont et al. 2009;Slater & van Valkenburgh 2009).
MA by definition quantifies a specific biomechanical performance and has been used extensively in previous studies (Busbey 1989; Westneat 1994, 1995, 2004; Anderson 2009; Sakamoto et al. 2010). The benefits of using a simple two-dimensional biomechanical metric are in its explicitness, limited uncertainties and statistical rigour. By taking a simple but explicit metric, it is possible to isolate important biomechanical properties from var-ious forms of noise and address broad-scale questions such as functional disparity, evolution of biomechanical performance and the role of phylogeny.
The author thanks David Norman, Paul Jeffrey, Paul Barrett, Zhonghe Zhou, Fucheng Zhang, Makoto Manabe, Jean-Yves Sire, Hajime Taru and John Hutchinson for access to collections and specimens. Thanks also to James Rohlf, Fred Bookstein, Norman MacLeod, Joseph Felsenstein, Michel Laurin and Øyvind Hammer for discussions on
multivariate and phylogenetic analyses. Many thanks go to Mark Bell for help with R, Graeme Lloyd for help with R (and especially for R codes: http://www.graemetlloyd.com/ methdpf.html) and comments, and Mike Benton for proof reading this manuscript, but also for continued guidance and support. Thanks also to the two anonymous reviewers who helped refine this manuscript. This research was partly funded by the BBSRC.
REFERENCES
Anderson, P. S. L. 2009 Biomechanics, functional patterns, and disparity in Late Devonian arthrodires. Paleobiology 35, 321 – 342. (doi:10.1666/0094-8373-35.3.321) Auffenberg, W. 1981 The behavioral ecology of the Komodo
monitor, p. 406. Gainesville, FL: University Presses of Florida.
Bakker, R. T. 1986 The dinosaur heresies: new theories unlocking the mystery of the dinosaurs and their extinction, p. 481. New York, NY: Morrow.
Bakker, R. T. 1998 Brontosaur killers: Late Jurassic allosaur-ids as sabre-tooth cat analogues. Gaia 15, 145 – 158. Barrett, P. M. 2005 The diet of ostrich dinosaurs
(Theropoda: Ornithomimosauria). Palaeontology 48, 347 – 358. (doi:10.1111/j.1475-4983.2005.00448.x) Barrett, P. M. & Rayfield, E. J. 2006 Ecological and
evolutionary implications of dinosaur feeding behaviour. Trends Ecol. Evol. 21, 217 – 224. (doi:10.1016/j.tree. 2006.01.002)
Biewener, A. A. & Full, R. J. 1992 Force platform and kinematic analysis. In Biomechanics: structures and systems (ed. A. A. Biewener), pp. 45 – 73. Oxford, UK: Oxford University Press.
Blomberg, S. P., Garland, T. & Ives, A. R. 2003 Testing for phylogenetic signal in comparative data: behavioral traits are more labile. Evolution 57, 717 – 745.
Busbey, A. B. 1989 Form and function of the feeding apparatus of Alligator mississippiensis. J. Morphol. 202, 99 – 127. (doi:10.1002/jmor.1052020108)
Christiansen, P. & Wroe, S. 2007 Bite forces and evolution-ary adaptations to feeding ecology in carnivores. Ecology 88, 347 – 358. (doi:10.1890/0012-9658(2007)88 [347:BFAEAT]2.0.CO;2)
Cleuren, J., Aerts, P. & Devree, F. 1995 Bite and joint force analysis in Caiman crocodilus. Belg. J. Zool. 125, 79 – 94. Currie, P. J. & Zhao, X. J. 1993 A new Carnosaur
(Dinosauria, Theropoda) from the Jurassic of Xinjiang, Peoples Republic of China. Can. J. Earth Sci. 30, 2037 – 2081.
Diniz-Filho, J. A. F., De Sant’ana, C. E. R. & Bini, L. M. 1998 An eigenvector method for estimating phylogenetic inertia. Evolution 52, 1247 – 1262. (doi:10.2307/2411294) Dumont, E. R., Grosse, I. R. & Slater, G. J. 2009 Requirements for comparing the performance of finite element models of biological structures. J. Theor. Biol. 256, 96 – 103. (doi:10.1016/j.jtbi.2008.08.017)
Felsenstein, J. 1985 Phylogenies and the comparative method. Am. Nat. 125, 1 – 15. (doi:10.1086/284325) Hammer, O., Harper, D. A. T. & Ryan, P. D. 2001 PAST:
paleontological statistics software package for education and data analysis. Palaeontol. Electron. 4, 99.
Harvey, P. H. & Pagel, M. D. 1991 The comparative method in evolutionary biology, p. 239. Oxford, UK: Oxford University Press.
Henderson, D. M. 2000 Skull and tooth morphology as indi-cators of niche partitioning in sympatric Morrison Formation theropods. Gaia 15, 219 – 226.
Henderson, D. M. 2002 The eyes have it: the sizes, shapes, and orientations of theropod orbits as indicators of skull strength and bite force. J. Vert. Paleontol. 22, 3332 M. Sakamoto Evolution of theropod biting performance
766 – 778. (doi:10.1671/0272-4634(2002)022[0766: TEHITS]2.0.CO;2)
Herrel, A., Aerts, P. & De Vree, F. 1998 Static biting in lizards: functional morphology of the temporal ligaments. J. Zool. 244, 135 – 143. (doi:10.1111/j.1469-7998.1998. tb00015.x)
Hieronymus, T. L. 2006 Quantitative microanatomy of jaw muscle attachment in extant diapsids. J. Morphol. 267, 954 – 967. (doi:10.1002/jmor.10450)
Holliday, C. M. 2009 New insights into dinosaur jaw muscle anatomy. Anat. Rec. 292, 1246 – 1265. (doi:10.1002/ar. 20982)
Holliday, C. M. & Witmer, L. M. 2007 Archosaur adductor chamber evolution: integration of musculoskeletal and topological criteria in jaw muscle homology. J. Morphol. 268, 457 – 484. (doi:10.1002/jmor.10524)
Hunt, G. 2008 paleoTS: modeling evolution in paleontologi-cal time-series, R package v. 0.3-1.
Kembel, S., Ackerly, D., Blomberg, S., Cowan, P., Helmus, M., Morlon, H. & Webb, C. 2009 Picante: R tools for integrating phylogenies and ecology, R package v. 0.7-2. Seehttp://www.CRAN.R-project.org/package=picante. Laurin, M. 2004 The evolution of body size, Cope’s rule and
the origin of amniotes. Syst. Biol. 53, 594 – 622. (doi:10. 1080/10635150490445706)
Lloyd, G. T., Davis, K. E., Pisani, D., Tarver, J. E., Ruta, M., Sakamoto, M., Hone, D. W. E., Jennings, R. & Benton, M. J. 2008 Dinosaurs and the Cretaceous terrestrial revolution. Proc. R. Soc. B 275, 2483 – 2490. (doi:10. 1098/rspb.2008.0715)
Mazzetta, G. V., Cisilino, A. P. & Blanco, R. E. 2004 Mandible stress distribution during the bite in Carnotaurus sastrei Bonaparte, 1985 (Theropoda: Abelisauridae). Ameghiniana 41, 605 – 617.
Mazzetta, G. V., Cisilino, A. P., Blanco, R. E. & Calvo, N. 2009 Cranial mechanics and functional interpretation of the horned carnivorous dinosaur Carnotaurus sastrei. J. Vert. Paleontol. 29, 822 – 830. (doi:10.1671/039.029. 0313)
McHenry, C. R., Wroe, S., Clausen, P. D., Moreno, K. & Cunningham, E. 2007 Supermodeled sabercat, predatory behavior in Smilodon fatalis revealed by high-resolution 3D computer simulation. Proc. Natl Acad. Sci. USA 104, 16 010 – 16 015. (doi:10.1073/pnas.0706086104) McKitrick, M. C. 1993 Phylogenetic constraint in
evolution-ary theory: has it any explanatory power? Ann. Rev. Ecol. Syst. 24, 307 – 330. (doi:10.1146/annurev.es.24.110193. 001515)
Moazen, M., Curtis, N., Evans, S. E., O’Higgins, P. & Fagan, M. J. 2008 Rigid-body analysis of a lizard skull: modelling the skull of Uromastyx hardwickii. J. Biomech. 41, 1274 – 1280. (doi:10.1016/j.jbiomech. 2008.01.012)
Molnar, R. E. 2000 Mechanical factors in the design of the skull of Tyrannosaurus rex (Osborn, 1905). Gaia 15, 193 – 218.
Moreno, K., Wroe, S., Clausen, P., McHenry, C., D’Amore, D., Rayfield, E. & Cunningham, E. 2008 Cranial per-formance in the Komodo dragon (Varanus komodoensis) as revealed by high-resolution 3D finite element analysis. J. Anat. 212, 736 – 746. (doi:10.1111/j.1469-7580.2008. 00899.x)
Paradis, E., Claude, J. & Strimmer, K. 2004 APE: analyses of phylogenetics and evolution in R language. Bioinfor-matics 20, 289 – 290. (doi:10.1093/bioinformatics/btg412) Paul, G. S. 1988 Predatory dinosaurs of the world, p. 464.
New York, NY: Simon and Schuster.
Rayfield, E. J. 2007 Finite element analysis and understand-ing the biomechanics and evolution of livunderstand-ing and fossil organisms. Ann. Rev. Earth Planet. Sci. 35, 541 – 576. (doi:10.1146/annurev.earth.35.031306.140104)
Rayfield, E. J., Norman, D. B., Horner, C. C., Horner, J. R., Smith, P. M., Thomason, J. J. & Upchurch, P. 2001 Cranial design and function in a large theropod dinosaur. Nature 409, 1033 – 1037. (doi:10.1038/35059070) R Core Development Team. 2009 R: a language and
environment for statistical computing. Vienna, Austria: R Foundation for Statistical Computing.
Sakamoto, M., Lloyd, G. T. & Benton, M. J. 2010 Phylo-genetically structured variance in felid bite force: the role of phylogeny in the evolution of biting performance. J. Evol. Biol. 23, 463 – 478. (doi: 10.1111/j.1420-9101. 2009.01922.x)
Schluter, D., Price, T., Mooers, A. O. & Ludwig, D. 1997 Likelihood of ancestor states in adaptive radiation. Evolution 51, 1699 – 1711. (doi:10.2307/2410994) Sinclair, A. G. & Alexander, R. M. 1987 Estimates of forces
exerted by the jaw muscles of some reptiles. J. Zool. 213, 107 – 115. (doi:10.1111/j.1469-7998.1987.tb03681.x) Slater, G. J. & Van Valkenburgh, B. 2009 Allometry and
performance: the evolution of skull form and function in felids. J. Evol. Biol. 22, 2278 – 2287. (doi:10.1111/ j.1420-9101.2009.01845.x)
Therrien, F., Henderson, D. M. & Ruff, C. B. 2005 Bite me: biomechanical models of theropod mandibles and implications for feeding behaviour. In The carnivorous dinosaurs (ed. K. Carpenter), pp. 179 – 237. Bloomington, IN: Indiana University Press.
Westneat, M. W. 1994 Transmission of force and velocity in the feeding mechanisms of labrid fishes (Teleostei, Perciformes). Zoomorphology 114, 103 – 118. (doi:10. 1007/BF00396643)
Westneat, M. W. 1995 Feeding, function, and phylogeny: analysis of historical biomechanics in labrid fishes using comparative methods. Syst. Biol. 44, 361 – 383.
Westneat, M. W. 2004 Evolution of levers and linkages in the feeding mechanisms of fishes. Integr. Comp. Biol. 44, 378 – 389. (doi:10.1093/icb/44.5.378)
Wroe, S., McHenry, C. & Thomason, J. 2005 Bite club: comparative bite force in big biting mammals and the prediction of predatory behaviour in fossil taxa. Proc. R. Soc. B 272, 619 – 625. (doi:10.1098/rspb.2004.2986)