HAL Id: hal-02364970
https://hal.archives-ouvertes.fr/hal-02364970
Submitted on 15 Nov 2019
HAL is a multi-disciplinary open access
archive for the deposit and dissemination of
sci-entific research documents, whether they are
pub-lished or not. The documents may come from
teaching and research institutions in France or
abroad, or from public or private research centers.
L’archive ouverte pluridisciplinaire HAL, est
destinée au dépôt et à la diffusion de documents
scientifiques de niveau recherche, publiés ou non,
émanant des établissements d’enseignement et de
recherche français ou étrangers, des laboratoires
publics ou privés.
Thermo-fluorescent images of electric and magnetic
near-fields of a High Impedance Surface
Hugo Ragazzo, Stéphane Faure, Daniel Prost, Julian Carrey, François Issac,
Jean-François Bobo
To cite this version:
Hugo Ragazzo, Stéphane Faure, Daniel Prost, Julian Carrey, François Issac, et al.. Thermo-fluorescent
images of electric and magnetic near-fields of a High Impedance Surface. EMC Europe 2019, Sep 2019,
BARCELONE, Spain. �hal-02364970�
XXX-X-XXXX-XXXX-X/XX/$XX.00 ©20XX IEEE
Thermo-fluorescent images of electric and magnetic
near-fields of a High Impedance Surface
Hugo Ragazzo ONERA/ DEMR Université de Toulouse F-31055Toulouse, France hugo.ragazzo@1onera.fr Stephane Faure LPCNO INSA Toulouse, France s-faure@insa-toulouse.fr Daniel Prost ONERA/ DEMR Université de Toulouse F-31055Toulouse, France daniel.prost@onera.fr Julian Carrey LPCNO INSA Toulouse, France julian.carrey@insa-toulouse.fr François Issac ONERA/ DEMR Université de Toulouse F-31055Toulouse, France francois.issac@onera.fr Jean-François Bobo CNRS CEMES Toulouse, France jean.francois.bobo@gmail.fr Abstract—The characterization of the electromagnetic field
emitted by various sources (antenna, radar...) is an important issue, either for civil or defense applications. The measurement of the electromagnetic field may be performed by a local probe, but the infrared thermography imaging is an alternative way. The latter method, called EMIR [1] (ElectroMagnetic InfraRed) has been used for years in particular at ONERA where it had been developed. We have recently successfully implemented this technique in the domain of visible light, named as EMVI [2]. As in the EMIR method, a thin film (sensitive to either electric field or magnetic field) is heated by the emitted field. But here the film is coated with a polymer doped with fluorescent molecules. As the fluorescent emission depends on the temperature of the film, we get a thermofluorescent sensor. The results presented here illustrate that new method: both magnetic and electric field imaging of a High Impedance Surface (HIS) has thus been obtained.
Keywords—Electromagnetism, thermography, magnetic losses, electric losses, fluorescence, High Impedance Surface.
I. INTRODUCTION
Microwave technologies play an important role in many fields from public applications (phone, communications) to more specific domains (radar, civil and military aeronautics, medicine...). In this context of increasing emissions of microwave electromagnetic fields, one of the major issues is to develop methods to diagnose and characterize it in real time.
We present in this paper the measurement of the electromagnetic near field of an High Impedance Surface (HIS) developed at ONERA [3]. We used a new method of measurement based on thermofluorescence. In the section II we enlighten this new concept called EMVI: ElectroMagnetic Visible Imaging. Then in section III we detail the specificity of this HIS. In the last section IV, images of the electric and magnetic near fields of the HIS are presented.
II. EMVITECHNIQUE
The EMVI method uses a thin foil or film heated by the incident field [2, 3]. The foil is covered by fluorescent molecules which fluorescent emission depends on temperature. Hence, depending on the field amplitude, the film is more or less heated and the fluorescence intensity varies. This enables field imaging in the visible light
domain. The interest of this technique is to be able to visualize and eventually to quantify the amplitude of a magnetic or electric field by a relatively non-intrusive way on the surface of a thin film that absorbs one part of the incident wave: a 2D cartography of the field can thus be obtained on a relatively large surface (several dm²), in a few seconds (much faster than a local probe that would be moved step by step to scan the whole surface). We could also get local measurements with the combination of an optical fiber and a thermofluorescent sensor for example for biological applications but this is out the scope of the present paper.
A. Films with electric or magnetic losses
Two types of microwave sensing films are used, either with electric or magnetic losses. These films have initially been developed for EMIR method. EMIR consists in imaging the electromagnetic field through the infrared emission of a thin film located in the field and heated by it. These thin films are polymer foils with small conductivity for electric field imaging or with ferromagnetic losses for magnetic film imaging. For the fluorescent EMVI method, the same films are coated with fluorescent molecules, as presented in the next section.
For electric losses we typically use 50-µ m thick Kapton film doped with carbone, with electrical conductivity σ of about 10 to 100 S.m-1. The conductivity is high enough to allow the formation of induced currents and therefore to heat the film as it is shown on Figure 1, but low enough to avoid electric absorption that would disturb and modify the incoming field.
Figure 1: Schematic drawing of the sensitive film heating [3].
We want to absorb a small part of the electric field. The absorption rate of electric field, A, is given by:
(1) With Z0 = 377 Ω and Zs= 1/(σe); σ is the film electric
conductivity and e1 its thickness.
The density of absorbed power Pabs (W.m-3) is given by:
(2)
If e (film thickness + fluorescence layer thickness) is small compared to the wavelength and penetration depth, the film heating at thermal equilibrium can be evaluated by:
(3) Where h is the heat transfer coefficient (W.m-2. K-1). From (2) and (3) we obtain the electric field amplitude:
(4) with
(5)
Concerning the magnetic field component, the sensing film has to be both nonconductive and composed with high permeability elements (patterned ferromagnetic film as already published [4] or commercial FLEX-TOKIN absorber composed of ferromagnetic micro pellets in a polymer matrix [5]). In the microwave regime, ferromagnetic resonance (FMR) losses, or precession losses take place as we show on Figure 2b. These are related to the effective magnetic losses thickness defined by tL = µ".t
(where µ" is the imaginary part of the permeability and t its effective thickness). For lower frequencies heating is caused by hysteresis losses (Figure 2a).
Figure 2: Sketches of hysteresis loop (a) Sketches of FMR (b)
The density of absorbed power Pabs (W.m-3) is now:
(6) From (3) and (6) we obtain the magnetic field amplitude:
(7) With
(8) Where C is the film heat capacity.
B. Fluorescence loading
A thin film of fluorescence solution is screen printed on a magnetic or electric losses film in clean room. The fluorescence film must be thinner than 100 µm to neglect heat conduction. We have chosen rhodamine B (RhB) as the fluorophore. The absorption peak wavelength of Rhodamine B stirred in ethanol and epoxy is centered at 550 nm and the fluorescence emission peak is centered at 590 nm. Our films are exposed to a 535 nm green light emitted by a LED array with a 450-550 nm band pass filter. To recover the fluorescence signal we have to use a high pass filter with cutoff wavelength at 580 nm, we avoid any overlap between the green light excitation and the fluorescence signal. Absorption quantum yield of RhB in ethanol ranges from 0.69 to 0.97 [6]. We adapt the RhB molar concentration to maximize the fluorescence signal without π-stacking. Finally, the obtained fluorophore layer thickness is roughly 100 µm on this sample (Figure 3).
Figure 3: TOKIN E25 + fluorescence RhB layer.
C. Thermofluorescence setup
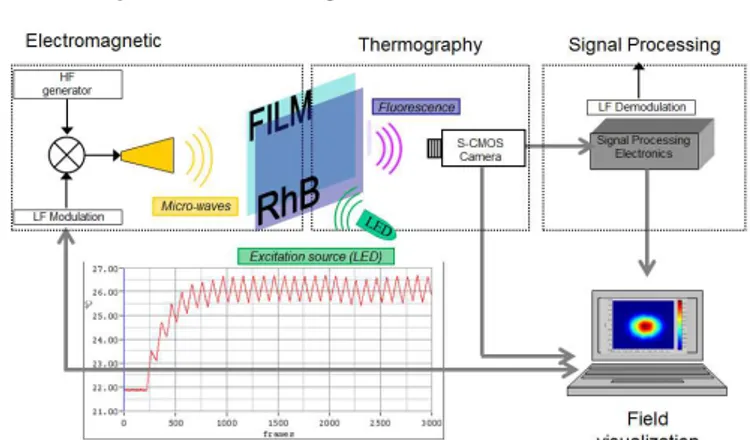
Figure 4: Thermofluorescense setup for measurement of the electromagnetic field
Figure 4 represents the schematics of the EMVI setup [7]. The microwave emitter is modulated (typically at 0.2 Hz). The film is exposed to microwave modulated signal and LED excitation at 535 nm (green LED). Film heating is registered by the S-CMOS camera (Dhyana400D 4 megapixel). The advantage of the low frequency modulation is to cancel out all continuous effects (natural convection, thermal drift). Subsequent Fourier image demodulation allows increasing the signal-to-noise ratio.
III. HIGH IMPEDANCE SURFACE (HIS)
A HIS is a special passive electromagnetic structure (based on metamaterial technology) designed for reducing mutual coupling between patch antennas (for applications where size constraints are crucial: space systems for example).
Figure 5: Simulation setup of the HIS embedded in the transmission line, (b) picture of the realized structure [8]
Figure 5(a) shows how the HIS cells are located between the ground plane and the transmission line [8]. It’s made of periodic elements consisting of two layers dielectric substrate. The first dielectric layer includes a ground plane on the bottom face. The second layer is made of the same material than the first. This layer is printed on its two faces with copper. On the bottom we have hexagon shape and on the top, equilateral triangle shape with metallic via to connect the ground plane. This HIS is therefore composed of periodic capacitive and inductive elements. We can simply model HIS by a LC parallel circuit:
(9) The first resonance frequency is given by:
.
(10)And the bandwidth is:
.
(11)Figure 6 shows S12 parameters, with and without the electric losses film [8]. We conclude from this picture that we have resonance peaks at 1.2 GHz and a second one at about 1.9 GHz (EMVI measurements will therefore be achieved at 2GHz). It can also be noticed that the film is relatively non-intrusive in so far as the resonance peaks are almost not affected.
Figure 6: S12 measurement of the HIS, with and without the thermo-emissive film [7]
IV. IMAGING NEAR FIELD OF HIS
A. Experimentation
We use a green LED-array source made with 180 LEDs (at 535 nm). The light source laid about 20 cm from the sample, and was tilted to avoid specular reflection (Figure 7). It provides an optical power density of 2.5 mW/cm2 on the film surface. The camera is placed at zero-degree incidence with focal distance 20 cm. The acquisition time is 1 ms; 10 images per second are collected for image processing (demodulation). The film is just in front of the HIS at about 1mm (λ/150).
The microwave power (modulated at 0.2 Hz) is of the order of 2 to 3 W. The HIS structure is connected to a 50 Ω load. Measurements have been achieved for the 2 GHz resonance frequency, and also at 2.25 GHz to compare with the non-resonant behavior. Images are obtained in both configurations and given in the next section.
Figure 7: EMVI Setup in H field imaging mode. B. Measurement
First, we observe the time dependence of one pixel intensity during microwave modulation on Figure 8. The signal-to-noise ratio of this signal has significant effect on the quality of the images. We applied the demodulation on all pixels to obtain images of the field.
Figure 8: Black: Signal of one pixel with magnetic sensing film at 2GHz [X=450 Y=170], Red: sine fit of the signal.
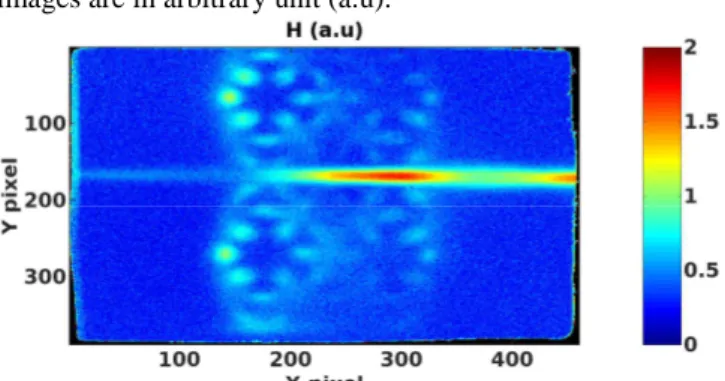
On Figure 8 the signal of one pixel is centered and rectified. As we can see we have a good correlation with sine fit. The fluorescence variation is extracted from the signal by demodulation at the magnetic field modulation frequency deduced from the fit of one pixel. The amplitude of magnetic and electric field is proportional to the square root of the heating according to equations (4) and (7). Figure 9, 10, 11 and 12 are images of the magnetic and electric fields,
for two frequencies. We don’t use kh and ke coefficient so all
images are in arbitrary unit (a.u).
Figure 9: Magnetic near field image of HIS at 2 GHz
Figure 10: Magnetic near field image of HIS at 2.25 GHz
Figure 11: Electric near field image of HIS at 2 GHz
Figure 12: Imaging electric near field of HIS at 2.25 GHz
These images show very different behaviors of the HIS depending on the frequency:
At 2 GHz the HIS cells resonate and we can observe subwavelength details of the magnetic and electric near field (Figures 9 and 11). These details would have been very difficult to visualize using a standard probe, which illustrates the interest of the EMVI method.
At 2.25 GHz the HIS is out of the band gap as we show Figures 10 and 12 therefore show a passing behavior without any resonance. On Figure 12 we see we are not completely out of the resonance.
V. CONCLUSION
The EMVI method gives encouraging results on the HIS structure. It could be difficult to obtain large-scale images of magnetic or electric field with local probes. EMVI allows obtaining those images in a few seconds. Using simulations would cost more time and effort. Compared to the similar EMIR method, the main advantages of EMVI are the low cost of the setup and the spatial resolution of S-CMOS camera, which is better than any IR camera. Improvement of the method is under progress. EMVI is proposed as a new thermo-optic imaging sensor for electromagnetic compatibility.
ACKNOWLEDGMENT
This work was partly supported by NEXT Laboratory of Excellence (Université de Toulouse, CNRS) and CNRS Interdisciplinary Mission DEFINSTRUM.
REFERENCES
[1] P.Levesque, L.Leylekian, “ Capteur vectoriel de champs électromgnétique par thermographie infrarouge ”, French Patent n°9816079, 1998
[2] S. Faure, J.F. Bobo, J. Carrey, F. Issac and D. Prost, “ Composant sensible pour dispositif de mesure de champ électromagnétique par thermofluorescence, procédés de mesure et de fabrication correspondants ”, French Patent, n° 1758907, 2017
[3] N.Capet, “Amélioration du découplage inter élément par surface
haute impédance pour antennes réseaux GNSS compactes », Ph.D.
Report, Universit´e de Toulouse, 2010 [in french]
[4] J.Vernieres, J.F. Bobo, D. Prost, F. Issac, F. Boust, “Ferromagnetic microstructured thin films with high complex permeability for microwave applications”, J. of Appl. Phys. 109, 07A323, 2011. [5] https://www.tokin.com/english/product/pdf_dl/flex.pdf
[6] R.F.Kubin and A.N.Fletcher, “Fluorescence quantum yields of some
Rhodamine dyes”, Journal of Luminescence 27 (1982) 455-462
[7] H.Ragazzo, D.Prost, JF. Bobo, S.Faure, J.Carrey, F.Issac, “Detection and imaging of magnetic field in the microwave regime with a combination of magnetic losses material and thermofluorescent molecules”, IEEE Transactions on Magnetics (Volume: 55, Issue: 2, Feb.2019)
[8] D.Prost, F.Issac, C.Martel, N.Capet, J.Sokoloff, O.Olivier, “Electric field imaging of a high impedance surface for GNSS array decoupling
![Figure 1: Schematic drawing of the sensitive film heating [3].](https://thumb-eu.123doks.com/thumbv2/123doknet/13487064.413825/2.892.460.758.928.1074/figure-schematic-drawing-sensitive-film-heating.webp)
![Figure 5: Simulation setup of the HIS embedded in the transmission line, (b) picture of the realized structure [8]](https://thumb-eu.123doks.com/thumbv2/123doknet/13487064.413825/4.892.75.438.84.244/figure-simulation-setup-embedded-transmission-picture-realized-structure.webp)