HAL Id: cea-02908422
https://hal-cea.archives-ouvertes.fr/cea-02908422
Submitted on 29 Jul 2020
HAL is a multi-disciplinary open access archive for the deposit and dissemination of sci-entific research documents, whether they are pub-lished or not. The documents may come from teaching and research institutions in France or abroad, or from public or private research centers.
L’archive ouverte pluridisciplinaire HAL, est destinée au dépôt et à la diffusion de documents scientifiques de niveau recherche, publiés ou non, émanant des établissements d’enseignement et de recherche français ou étrangers, des laboratoires publics ou privés.
Combining spectroscopy and magnetism with
geochemical tracers to improve the discrimination of
sediment sources in a homogeneous subtropical
catchment
Rafael Ramon, Olivier Evrard, J. Patrick Laceby, Laurent Caner, Alberto
Inda, Cláudia A.P. De Barros, Jean P.G. Minella, Tales Tiecher
To cite this version:
Rafael Ramon, Olivier Evrard, J. Patrick Laceby, Laurent Caner, Alberto Inda, et al.. Combin-ing spectroscopy and magnetism with geochemical tracers to improve the discrimination of sedi-ment sources in a homogeneous subtropical catchsedi-ment. CATENA, Elsevier, 2020, 3535, pp.104800. �10.1016/j.catena.2020.104800�. �cea-02908422�
1
Combining spectroscopy and magnetism with geochemical tracers to improve the
1
discrimination of sediment sources in a homogeneous subtropical catchment
2 3
Rafael Ramon(a,b); Olivier Evrard(b); J. Patrick Laceby(c); Laurent Caner(d), Alberto V. 4
Inda(e), Cláudia A.P. de Barros(e); Jean P.G. Minella(f) and Tales Tiecher(e) 5
6
a Graduate Program in Soil Science, Federal University of Rio Grande do Sul, Bento Gonçalves Ave., 7
91540-000 Porto Alegre, RS, Brazil – Interdisciplinary Research Group On Environmental
8
Biogeochemistry - IRGEB (rafaramon11@gmail.com)
9
b Laboratoire des Sciences et de l'Environnement, UMR 8212 (CEA/CNRS/UVSQ), 91 191 Gif-sur-Yvette 10
Cedex (France), Université Paris-Saclay, France – IRGEB (olivier.evrard@lsce.ipsl.fr)
11
c Alberta Environment and Parks, 3535 Research Rd NW, T2L 2K8, Calgary, Alberta, Canada 12
(patrick.Laceby@gov.ab.ca)
13
d IC2MP-HydrASA UMR, Université de Poitiers, Poitiers, France (laurent.caner@univ-poitiers.fr) 14
e Department of Soil Science, Federal University of Rio Grande do Sul, Bento Gonçalves Ave. 7712, 15
91540-000 Porto Alegre, RS, Brazil – IRGEB (alberto.inda@ufrgs.br; claudia.barros@ufrgs.br;
16
tales.tiecher@gmail.com)
17
f Department of Soil Science, Federal University of Santa Maria, Roraima Ave. 1000, 97105-900 Santa 18
Maria, RS, Brazil – IRGEB (jminella@gmail.com)
19 20 21
2
Abstract
22
An important step in the sediment source fingerprinting approach is the selection of the 23
appropriate tracing parameters to maximize source discrimination. The use of multiple 24
tracing properties may reduce uncertainties and increase discrimination between 25
sources. Accordingly, this study investigates the discrimination and quantifies the 26
contribution of sediment sources delivering sediment to a river draining a 27
homogeneous subtropical agricultural catchment based on the combination of 28
ultraviolet-visible spectra derived parameters (UV), magnetic (M), and geochemical 29
tracers (GEO). The investigated catchment (Conceição River - 804 km²), located in 30
Southern Brazil, has predominantly deep and strongly weathered Ferralsols. The main 31
land-uses found in the area are cropland (89%), pasture (5%) and forest (5%). A total of 32
187 samples were collected to characterise the five main sediment sources, including 33
cropland, pastures, unpaved roads, gullies and stream banks. A total of 53 tracers, 34
including 21 geochemical tracers, two magnetic properties and 30 parameters derived 35
from UV spectra, were analysed. Tracers were selected following a three step 36
procedure, including: (i) an interquartile range test, (ii) a Kruskal–Wallis H test, and (iii) 37
a linear discriminant function analysis (LDA). The LDA was performed using six 38
different sets of variables: (i) GEO only; (ii) UV only; (iii) M+UV (MUV); (iv) GEO+UV 39
(GUV); (v) GEO + M (GM) and (vi) GEO+M+UV (GMUV). The selected tracers were 40
introduced into a mass balance mixing model to estimate the source contributions to in-41
stream sediment by minimizing the sum of square residuals. Most geochemical tracers 42
were considered not conservative by using the interquartile range test in this catchment 43
with highly weathered soils. The GM approach resulted in the highest percentage of 44
samples correctly classified (SCC), with 74%, followed by the approaches with GMUV 45
and GUV, with 73%. Alternative tracers, UV individually or combined with M tracers, 46
3 correctly classified only 59 and 60% of the samples, respectively. Moreover, they did 47
not provide significant additional discrimination power even when combined with the 48
GEO tracers. The apportionment model resulted in similar source contribution results 49
for all approaches, with the absence of significant difference when comparing the mean 50
source contributions obtained for the entire set of sediment samples (Cropland: 17– 51
23%; Pastures: 24–34%; Unpaved Roads: 3–12%; Stream Banks: 26–31%; Gullies: 14– 52
19%). Due to the strong homogeneity of soil types found in the Conceição catchment, 53
these differences in source contributions remained very low and the results of the 54
mixing model were impacted by the high number of potential sources and the relatively 55
limited quality of the sediment source discrimination. According to the model results, 56
the low discrimination between the potential sediment sources illustrates the 57
difficulties for discriminating land-used based sediment sources, with more than three 58
potential sources, in homogeneous catchments with highly weathered soils (e.g. 59
Ferralsols, Nitisols) under tropical conditions. 60
4
Highlights
62
Geochemical tracers were not conservative in a catchment with highly weathered soils. 63
Magnetic and UV tracers had low discriminating potential between land uses. 64
The low discrimination between sources results in great uncertainties in the results. 65
Quantifying sediment contributions from more than three sources remains challenging. 66
Despite limited discrimination, results of all tracers combinations remained consistent. 67
68
Key Words
69Sediment fingerprinting; soil erosion; composite fingerprinting, tracer selection, 70
geochemistry. 71
72 73
5
1 Introduction
74
The sustainable production of food, fiber and fuel remains limited by soil 75
erosion. Despite the vast knowledge accumulated about soil erosion, it remains a 76
significant global environmental issue that is one of the main causes of soil degradation 77
worldwide. In this context, Southern Brazil has one of the highest erosion rates in the 78
world (Borrelli et al., 2017) due to the relief characteristics along with intense and 79
erosive rainfall (Ramon et al. 2017). In particular, rainfall erosivity is expected to 80
increase ~10% in Southern Brazil by 2040 (Almagro et al., 2017). 81
Although field research programs are an essential tool to understand the impacts 82
of human activities and climate changes on natural resources (Poesen, 2017), in Brazil 83
they have been employed only relatively recently compared to other regions of the 84
world such as the United States or Europe (Melo et al., 2020). In this scenario of limited 85
hydrological and geomorphological understanding, it is important to identify the main 86
sediment sources (Collins et.al, 2017) to guide decision-makers in the efficient 87
allocation of limited public resources available to mitigate soil erosion and sediment 88
production. 89
The sediment fingerprinting technique has been increasingly used in catchments 90
worldwide to quantify the relative source contributions to river sediment (Walling, 91
2013). The method offers an effective way to calculate the contribution of diffuse 92
sources of sediment and contaminants, providing useful information to focus efforts on 93
controlling major soil erosion problems (Niu et al., 2019; Nosrati and Collins, 2019; 94
Torres Astorga et al., 2018; Uber et al., 2019). However, many challenges require 95
further research with sediment source fingerprinting such as the selection of tracers to 96
6 analyse and the grouping of the main sediment sources (Pulley et al., 2017b; Smith et al., 97
2015). 98
Sediment tracer properties need to be conservative and their signature from 99
source to the river network must remain constant or vary predictably (Belmont et al., 100
2014; Laceby et al., 2017). Although it is known that the conservativeness of potential 101
inorganic tracers is dependent on their chemical nature (e.g., alkali metals, transition 102
metals, rare earth elements) and how they are bound to the sediment (e.g., sorbed onto 103
sediment particles or matrix-bounded elements), there is still no consensus on the best 104
approach to assess conservativeness. 105
Most studies typically evaluate conservativeness empirically through 106
comparisons of concentration between sources and sediments, which in turns depend 107
on the conservativeness test applied (Smith et al., 2018; Lizaga et al., 2020). Moreover, 108
tracer conservativeness can also be dependent on the characteristics of the studied 109
catchment and the sediment sources evaluated. Studying land use sources in 110
homogeneous catchments may be much more challenging as any enrichment or 111
depletion of a particular element during the erosion process can result in sediment 112
concentrations varying outside the range of source values (Smith and Blake, 2014). To 113
overcome conservativeness issues and increase the number of conservative tracers, 114
physical characteristics such as colour, or related to mineralogical constitution, such as 115
magnetism and parameters related to Fe oxides, that can be easily measured, may 116
potentially maintain their conservativeness in these homogeneous catchments and be 117
combined with other tracing parameters (Pulley et al., 2018). 118
In addition, tracer properties should ideally be low-cost, quick and easy to 119
analyse, as characterizing a large number of samples is needed in order to be 120
representative of the within-source variability, especially in large catchments. 121
7 Furthermore, analyses that require a low sample mass and are non-destructive are 122
preferable, as in several environmental contexts, it can be difficult to collect large 123
quantities of suspended sediment during fieldwork (Guzmán et al., 2013). 124
Geochemical composition of source and sediment samples is among the most 125
used tracers for sediment fingerprinting worldwide (Koiter et al., 2013). Multiple 126
geochemical analyses such as inductively coupled plasma (ICP) or X-ray fluorescence 127
analyses result in high number of potential tracers, however they are not an option for 128
research groups that do not have access to sophisticated equipment (e.g. ICP-OES or 129
ICP-MS, microwave oven) or sufficient resources to afford such analysis. 130
Another option for tracing sediment sources are magnetic properties which have 131
been widely used since the original sediment fingerprinting studies (Walling et al., 132
1979; Yu and Oldfield, 1989). Some measures like magnetic susceptibility can be easily 133
measured with relatively basic equipment (Rowntree et al., 2017), increasing the 134
number of tracers available for multiple sources contribution apportionment. 135
Moreover, spectroscopy data have been intensively investigated in the last 136
decade as a low-cost, non-destructive and straightforward alternative method to 137
provide tracer properties (Poulenard et al, 2009; Pulley et al., 2018). A variety of 138
approaches have been used to incorporate spectroscopy analysis into sediment 139
fingerprinting research (Legout et al., 2013; Martínez-Carreras et al., 2010b; Poulenard 140
et al., 2012; Tiecher et al., 2017). Among them, the use of colour parameters and 141
spectral features derived from ultraviolet-visible (UV) has shown to be promising 142
because it can be used alone or incorporated into mathematical models together with 143
geochemical tracers, radionuclides and others (Brosinsky et al., 2014a, 2014b, Tiecher 144
et al., 2015). Ultra-violet derived parameters may therefore offer a strong potential for 145
8 sediment tracing, although the proper classification of sources and the use of effective 146
modelling strategies are required to obtain reliable results (Pulley et al., 2018). 147
An important question in sediment fingerprinting surrounds the proper 148
identification of the potential sources of sediment to be incorporated into end-member 149
mixing models. Reducing the number of sources considered based on their relevance in 150
the study sites, or regrouping similar sources is a common practice in sediment 151
fingerprinting studies. For instance, Pulley et al. (2015b) did not consider grassland as a 152
source, since it occupied only a very low proportion of the catchment area and because 153
it was not possible to discriminate between cultivated and grassland areas with the 154
tracers used. A similar decision was taken by Minella et al. (2004), where fallow areas 155
could not be distinguished from pasture by the geochemical tracers used, and then they 156
were combined, while channel banks and new fields were removed because there was 157
not enough data to discriminate them, reducing the previous six sources to three. 158
In a previous study conducted in the Conceição River catchment in Southern 159
Brazil, pastures were not considered as potential sources, since the geochemical tracers 160
were not able to discriminate pastures from croplands and because they occupy only a 161
low percentage of the total catchment surface area (Tiecher et al., 2018). Gullies were 162
also not considered, as they are not commonly observed in the Conceição catchment, 163
where rill erosion is much more widespread (Didoné et al., 2015). In this catchment, 164
which consists of relatively homogeneous soil and geology, geochemical tracers were 165
only able to correctly classify only 84% of the samples in their respective source groups 166
(ie., cultivated sources, unpaved roads and streambanks) (Tiecher et al., 2018). The 167
small difference in the elemental concentrations observed between the sources, because 168
of intense weathering and leaching of most elements except Al and Fe, complicated their 169
9 discrimination, requiring further studies and alternative tracers to increase the 170
robustness of the results. 171
Here, the use of low-cost alternative parameters, including spectroscopy 172
derivatives in the ultraviolet-visible range and magnetic parameters, in combination 173
with geochemical tracers are investigated to provide an alternative approach that 174
increases the discrimination between multiple land use sources. This research 175
investigates the potential of six different sets of tracing parameters combing low cost 176
and geochemical element traces to calculate the respective contributions of five 177
potential sediment sources in a homogeneous catchment (Conceição River) in southern 178
Brazil. This research contributes to the ongoing development of low-cost tracers, 179
examining their efficacy in a complicated homogeneous tracing environment, that is 180
representative of regions with extensive agricultural activities that contribute 181
deleterious sediment loads degrading waterways worldwide. 182 183
2 Methodology
1842.1 Study site
185The Conceição River catchment is located on a basaltic plateau in the southern 186
part of the Paraná Basin in the state of Rio Grande do Sul, and it covers an area of 187
approximately 804 km² (Figure 1). According to Köppen’s classification, the climate is 188
classified as of Cfa type, humid subtropical without a defined dry season, with an 189
average annual precipitation ranging between 1750 to 2000 mm per year and an 190
average temperature of 18.6°C. This catchment is representative of the basaltic plateau 191
region of the Serra Geral Formation (92%), where the soil classes found are Ferralsols 192
(80%), Nitisols (18%) and Acrisols (2%), with a mineralogy dominated by iron oxides 193
10 and kaolinite (Figure 2). These soils are very rich in clays, typically, the Ferralsols that 194
predominate in this catchment have less than 10% of sand and clay content as high as 195
85% (Ramos et al., 2017). Small areas from the Tupanciretã Formation (6%), which are 196
outcrops of the Botucatu Formation enclosed by volcanic spills of the Serra Geral 197
Formation, are also found. The relief of the catchment is characterized by gentle slopes 198
(6-9%) at the higher positions of the landscape and steeper slopes (10-14%) near the 199
drainage channels, with altitudes ranging from 270 to 480 m a.s.l. The catchment outlet 200
is located next to the monitoring point number 75200000 of the National Water Agency 201
(ANA) (28°27'22" S, 53°58'24" O) in the municipality of Ijuí. 202
The main land use is cropland (89%) mainly cultivated with soybean (Glycine 203
max) under no tillage system in the summer and with wheat (Triticum aestivum) for
204
grain production, oat (Avena sativa and Avena strigosa) and ryegrass (Lolium 205
multiflorum) for dairy cattle feed or used as cover crops for protecting the soils during
206
winter. However, inadequate soil management in these areas, without crop rotation, 207
cover crops during the autumn and winter, and mechanical practices to control surface 208
runoff, has resulted in high erosion rates during the last 60 years, even with the no-209
tillage system implemented during the last 30 years (Didoné et al., 2019, 2015). 210
Grasslands and pasture, mainly used for cattle raising, cover 5% of the total surface 211
area, whereas forest is found on only 5% of the surface. Approximately 1 to 2% of the 212
area is occupied by non-vegetated areas, urban infrastructure and water bodies. 213
2.2 Source and sediment sampling
214
Soil composite samples (n=187) were collected in areas representative of the 215
potential sediment sources, which include cropland (n=77), pasture (which include 216
grasslands and permanent pastures, n=24), unpaved road (n=38), stream bank (n=34) 217
and gullies (n=14) (Figure 2). The source samples were taken from the surface layer (0 218
11 – 5 cm) of cropland and pasture (surface sources). In gully sites and stream bank 219
samples were taken from the exposed sidewall avoiding the material of the most 220
superficial layer (0-5 cm). The height exposed in the gullies sites and stream banks 221
varies greatly, but as the soil below the surface layer is quite homogeneous in the 222
Ferralsols of this catchment, the samples were collected in a representative manner 223
throughout the exposed subsurface area. To characterize unpaved roads, samples were 224
taken mainly in the roadsides where erosion is more evident, which in all cases 225
correspond to the subsurface of the soil, always avoiding collecting transient materials 226
from other potential sources. Care was taken to avoid those sites that have accumulated 227
sediment originating from other sources. Around ten sub-samples were collected within 228
a radius of approximately 50 m and mixed to prepare a composite sample, in order to 229
obtain representative source material. Samples were taken at sites sensitive to erosion 230
and connected to the stream network, and attention was paid to cover all the range of 231
soil types found in the catchment. 232
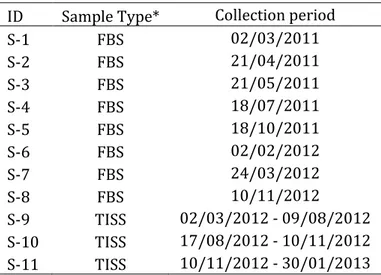
Eleven sediment samples were collected at the catchment outlet during the 233
monitoring period (Appendix A). From these, eight samples are fine-bed sediment (FBS) 234
collected in the bottom of the river with a suction device and three samples were 235
collected with a time-integrated sediment sampler (TISS) designed according to Phillips 236
et al. (2000). The period during which the TISS was sampled and the collection date of 237
each FBS sample are detailed in Table 1. 238
2.3 Source and sediment analyses
239
All samples were oven-dried (50°C), gently disaggregated using a pestle and 240
mortar and dry-sieved to 63 µm to avoid particle size effects prior to further analysis 241
(Koiter et al., 2013; Laceby et al., 2017). 242
12 2.3.1 Geochemical properties
243
A total of 20 geochemical elements were evaluated as potential tracers. The total 244
concentration of Al, Ba, Be, Ca, Co, Cr, Cu, Fe, K, La, Li, Mg, Mn, Na, Ni, P, Sr, Ti, V, and Zn 245
was determined using inductively coupled plasma optical emission spectrometry (ICP-246
OES) after microwave-assisted digestion with concentrated HCl and HNO3 (ratio 3:1) for 247
9.5 min at 182 °C. This method was adapted from U.S. EPA (2007), as it was reported to 248
provide satisfactory recovery for quantifying metal concentrations in soils (Chen and 249
Ma, 2001; Da Silva et al., 2014). Total organic carbon (TOC), which was estimated by 250
wet oxidation (K2Cr2O7 + H2SO4 - Walkley and Black, 1934), was included in the set of 251
geochemical tracers. 252
2.3.2 Magnetic properties 253
Two grams of each sample were used to measure the magnetic susceptibility in a 254
Bartington MS2B Dual Frequency sensor, with three readings for each sample at high 255
(4.7 kHz) and low frequencies (0.47 kHz) to obtain the mass specific magnetic 256
susceptibility for high (ꭓHF – m³ kg-1) and low frequencies (ꭓLF – m³ kg-1) (Mullins, 257
1977). 258
2.3.3 Ultraviolet-visible analysis and parameters calculation 259
The diffuse reflectance spectra in the ultraviolet-visible (UV) wavelengths (200 260
to 800 nm, with 1 nm step) were measured for each powdered sample using a Cary 261
5000 UV-NIR spectrophotometer (Varian, Palo Alto, CA, USA) at room temperature, 262
using BaSO4 as 100% reflectance standard. Twenty-two colour parameters were 263
derived from the UV spectra following the colorimetric models described in details by 264
Viscarra Rossel et al. (2006), which are based on the Munsell HVC, RGB, the 265
decorrelation of RGB data, CIELAB and CIELUV Cartesian coordinate systems, three 266
parameters from the HunterLab colour space model (HunterLab, 2015) and two indices 267
13 (coloration – CI and saturation index – SI) (Pulley et al., 2018). In total, 27 colour metric 268
parameters were derived from the spectra of source and sediment samples (L, L*, a, a*, 269
b, b*, C*, h, RI, x, y, z, u*, v*, u’, v’, Hvc, hVc, hvC, R, G, B, HRGB, IRGB, SRGB, CI and SI). 270
Three other parameters were calculated from the second derivative curves of remission 271
functions in the visible range of soil and sediment samples, which displayed three major 272
absorption bands at short wavelengths commonly assigned to Fe-oxides (Caner et al., 273
2011; Fritsch et al., 2005; Kosmas et al., 1984; Scheinost et al., 1998) (Appendix B). 274
2.4 Sediment source discrimination and apportionment
275
The selection of the discriminant tracers followed the classical three-step 276
procedure, including: i) a range test; ii) the Kruskal-Wallis H test (KW H test); and iii) a 277
linear discriminant function analysis (LDA) (Collins et al., 2010a). In the range test, 278
variables with median ± the interquartile range (IQR, 25th and 75th percentiles) values 279
of sediment samples lying outside the range of the sources were excluded (Batista et al., 280
2018). The KW H test was performed to test the null hypothesis (p < 0.05) that the 281
sources belong to the same population. The variables that provided significant 282
discrimination between sources were analysed with a forward stepwise LDA (p < 0.1) in 283
order to reduce the number of variables to a minimum that maximizes source 284
discrimination (Collins et al., 2010b). The statistical analyses were performed with R 285
software (R Development Core Team, 2017) and more details can be found in Batista et 286
al. (2018). 287
The source contributions were estimated by minimizing the sum of squared 288
residuals (SSR) of the mass balance un-mixing model. Optimization constraints were set 289
to ensure that source contributions were non-negative and that their sum equalled 1. 290
The un-mixing model was solved by a Monte Carlo simulation with 2500 iterations. 291
More information about model settings and compilation can be found in Batista et al. 292
14 (2018). Model uncertainties were evaluated based on the interquartile variation range 293
of the predictions from the multiple interactions of the Monte Carlo simulation. The 294
standard deviation (SD) of the Monte Carlo simulation results is calculated for each 295
sediment sample and source. 296
In order to test the ability of magnetic (M) and ultraviolet-visible derived 297
variables (UV) to discriminate between sediment sources, six approaches were tested to 298
verify the contribution of each variable dataset. A first approach was carried out 299
considering only geochemical variables (GEO) as potential tracers and the LDA and 300
apportionment model results were compared to those obtained with geochemical 301
tracers combined with M variables (GM), GEO plus UV (GUV), all variables together 302
(GMUV) and UV variables alone. Finally, an approach was carried out considering only 303
those “alternative” variables, involving M plus UV derived parameters (MUV). 304
3 Results
3053.1 Selection of sediment tracers
306
All parameters were analysed individually to check their conservative behaviour 307
and the property distribution in each group was evaluated using box plots. The 308
interquartile range was more restrictive than the classical range test based on 309
maximum and minimum values measured in the sources, resulting in a high number of 310
tracers (70 %) removed by the range test (Table 2). From the 21 geochemical elements, 311
only five behave conservatively (TOC, Be, Fe, K and P) . The set of 30 UV parameters 312
included nine conservative properties (L*, x, L, a, b, v*, v’, hVc, and B). Magnetic 313
parameters, ꭓHF and ꭓLF were both conservative. It means that about 24, 30 and 100% 314
of geochemical, UV parameters and magnetism tracers, respectively, behaved 315
conservatively when applied the IQR range test. If applied the classical range test, about 316
15 72, 97 and 100% of geochemical, UV parameters and magnetic tracers, respectively, 317
behaved conservatively. 318
The KW H test was applied to all tracers, even to those that were not retained by 319
the conservativity test. Only five tracers did not hold potential to discriminate between 320
at least two potential sources (Cu, Ni, Fe, Na and A2 had p > 0.1) (Table 4). Among the 321
parameters that were conservative and passed the KW H test, the combination of 322
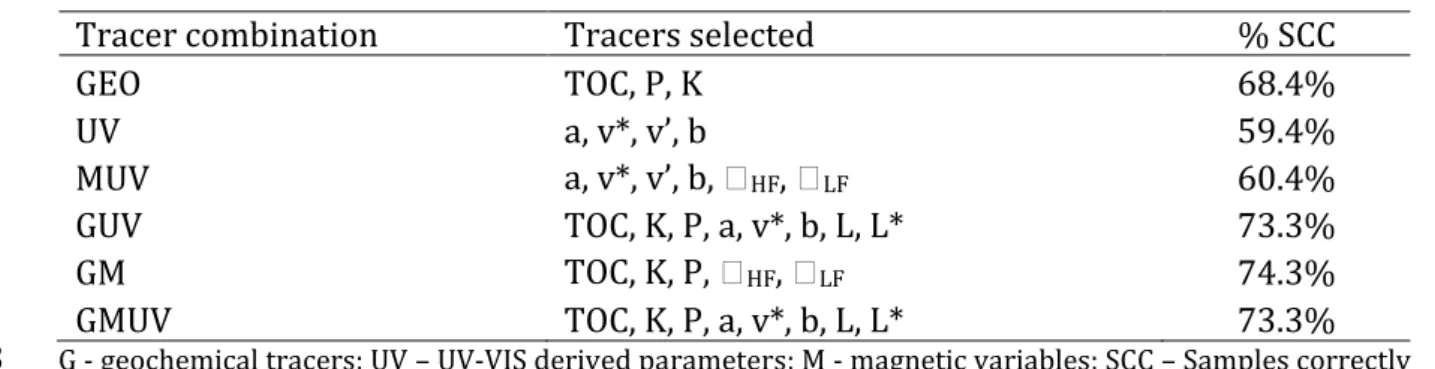
tracers that best discriminated between the sources was selected by the LDA, which are 323
presented in Table 3. 324
When geochemical data were used as potential tracers, P, K and TOC were 325
always selected as tracers. TOC and P are well correlated (Figure 3) and they have a 326
higher concentration in the surface samples (24 g kg-1 and 445 mg kg-1) than in the 327
subsurface samples (11 g kg-1 and 300 mg kg-1). The mean concentration of TOC and P 328
found in the sediment (22 g kg-1 and 468 mg kg-1) was close to that observed in the 329
surface sources. K had no correlation with P and TOC, besides having higher 330
concentrations in the surface sources (875 mg kg-1). The K concentration in the 331
sediments varied widely, with a standard deviation closer to the mean (397 ± 362 mg 332
kg-1), which makes this value similar to that found in subsurface sources (565 mg kg-1). 333
Potassium and P presented higher concentrations in the cropland samples due to the 334
addition of fertilizers for crop production. TOC presents higher concentrations in the 335
pastures, which can be attributed to the permanent soil cover and the increase of 336
below-ground biomass induced by well managed animal grazing (López-Mársico et al., 337
2015; Schuman et al., 1999; Tornquist et al., 2009). Iron was considered as conservative 338
although it did not provide discrimination between sediment sources. This was 339
somehow expected, since highly weathered soils have a high content of Fe oxides across 340
the entire soil profile, making comparison of surface and subsurface sources very 341
16 difficult. Beryllium was conservative, but its variation between sources was very low, 342
presenting low potential for discrimination between sources (KW H test p > 0.01). 343
Finally, the LDA selected only P, K and TOC as tracers for the GEO approach, which did 344
not comply with the universal rule of the discriminant analysis for multiple groups, 345
stating that the number of tracers must be at least equivalent to the number of groups 346
(n) minus one (n-1) (Rencher, 2005). For this reason, the use of geochemical tracers 347
alone was not modelled. 348
In the approach using GEO and M parameters (GM), the LDA selected two 349
magnetic parameters (ꭓLF, ꭓHF) and the three previously selected geochemical
350
elements. The two M parameters were highly correlated (Figure 3) and they remained 351
in the same cluster group of tracers, although they differed completely from the group 352
of the other three geochemical elements (Figure 4). Therefore, the LDA kept the two M 353
parameters, which improved the discrimination of the sources, resulting in 74.3% of 354
SCC. The differences of magnetic susceptibility values between sources for the two 355
magnetic parameters, ꭓLF and ꭓHF, are similar, where unpaved roads presented higher
356
values (22 x 10-6 and 19 x 10-6 m³ kg-1, respectively), followed by croplands, pastures, 357
gullies and stream banks (Table 4). Sediment samples have magnetic susceptibility 358
values (14 x 10-6 and 13 x 10-6 m³ kg-1, respectively) closer to those observed for 359
pastures (15 x 10-6 and 14 x 10-6 m³ kg-1, respectively) and stream banks (11 x 10-6 and 360
10 x 10-6 m³ kg-1, respectively). 361
The same parameters were selected for the combination of GEO and UV 362
parameters (GUV) and the combination of GEO, UV and M parameters (GMUV). For the 363
UV parameters, a, v*, b, L and L* were selected by the LDA, increasing the SCC to 73.3%, 364
an increase of 4.9% compared to the use of GEO tracers alone. The parameter L and L* 365
are related to the variation between white and black colours, also considered as the 366
17 luminosity index from HunterLab and CIELAB, respectively. Stream banks, gullies and 367
unpaved roads, which are subsurface sources (mean of 34 and 41 for L and L*, 368
respectively), had the highest values, which means that they have lighter colours than 369
the surface sources (mean of 32 and 39 for L and L*, respectively). L and L* mean values 370
for sediment samples (31 and 37, respectively) were lower than for all sources and 371
closer to those found in surface sources. More positive values for a and b means that the 372
colour is more red and yellow, respectively. Subsurface sources tend to be more red and 373
yellow, as a and b values are higher in this material (13.9 and 13.5, respectively) than in 374
surface sources (11.7 and 12.0, respectively). The mean values for sediments (9.0 and 375
11.4, respectively) were very close to those of the surface sources. The same behaviour 376
was observed for the parameter v* (21.3 and 23.9 for surface and subsurface sources, 377
respectively), which is the CIELUV colour space model derived parameter equivalent to 378
the a from CIELAB. 379
When UV parameters were used individually, the percentage of SCC was the 380
lowest among all the tested tracer combinations, with 59.4% of SCC. The UV parameters 381
selected in this approach were a, v*, v’ and b. Besides the other parameters selected in 382
the other approaches, the parameter v’ was selected in the UV approach, which is 383
related to the chromacity coordinates u* and v* from the CIELUV model. When the UV 384
and M parameters were combined, two M parameters were selected, but it did not 385
improve the source classification by the DFA, increasing only by 1% the proportion of 386
SCC. The reclassification of source samples by the LDA using the tracers selected in each 387
approach is illustrated in the bi-plot graphs (Figure 5a, 6a, 7a and 8a). 388
18
3.2 Model results for each approach
390
According to the five approaches modelled (UV, MUV, GUV, GM and GMUV), not 391
including the GEO only model as it had insufficient tracers for the number of sources, 392
pasture had the highest sediment contribution for most approaches, except when 393
geochemical tracers were combined with magnetic tracers, supplying sediment 394
proportions ranging from 24 to 33%. Stream bank and cropland were the second and 395
third sources in increasing order of contribution, with contributions ranging from 26 to 396
31% and 17 to 23%, respectively. Gullies were the fourth contributing source, with a 397
sediment delivery proportion varying between 16 and 19%. Unpaved roads provided 398
the lowest contribution to the river sediment, ranging from 2.6 to 12.2%. The mean 399
relative contributions of each source did not vary significantly between approaches 400
when the mean contributions for all sediment samples are compared, with the 401
exception of unpaved roads, for which the UV approach led to different results (Table 402
5). 403
When sediment samples were separated according to the sampling strategy, 404
significant differences between approaches were observed for cropland and unpaved 405
roads for both sampling strategies (Table 5). Comparing the type of sediment samples, 406
cropland had a higher contribution to TISS samples (16 to 39%) compared to FBS 407
samples (15 to 25%). The contribution of pastures to TISS samples was even higher, 408
ranging from 32 to 40%. Unpaved roads had a larger contribution to FBS samples 409
(~10.5%) and contributed less to the TISS samples (~3.5%). For pasture and stream 410
bank, significant differences between approaches were observed for FBS (19.9 to 411
33.2%) and TISS (16.8 to 31.8%) samples, respectively, while for gullies no difference 412
was observed for any sampling strategy. 413
19 The differences in sediment source contributions are mainly observed between 414
the approaches with only alternative tracers (UV and MUV) to those with geochemical 415
parameters included. Figure 5b to 8b provide box plots demonstrating the variation in 416
mean source contributions for all sediment samples when taking into account the 2500 417
Monte Carlo interactions results obtained for each approach. The large variations in 418
source contributions obtained for each set of simulations resulted in a standard 419
deviation (SD) that varied between 19 and 34% depending on the source considered 420
(Table 5). 421
The sediment source contributions predicted by the five approaches were 422
similar for the samples collected following the FBS sampling strategy, while the 423
variation between approaches was higher for the TISS samples (Figure 9). Pasture 424
provided the main source of TISS samples according to all approaches, contributing 425
more than 32% of sediment, followed by cropland with more than 24%, with the 426
exception of the approaches based on UV and MUV parameters, according to which 427
cropland contributed only 16 and 18% of sediment, respectively. For the FBS samples, 428
stream bank provided the main source of sediment, contributing more than 25% of the 429
material delivered to the river, with the exception of the approaches based on UV and 430
MUV parameters, according to which pasture was the main source of sediment, with 33 431 and 31%, respectively. 432 433
4 Discussion
4344.1 Tracer selection and discrimination between sources
435
The conservative behaviour of a sediment property may vary according to 436
different factors (e.g. physical, biochemical and geochemical), requiring an appropriate 437
20 selection of those that do not suffer modifications from their sources to the sediment 438
sampling site, avoiding uncertainties in the sediment fingerprinting technique (Koiter et 439
al., 2013; Sherriff et al., 2015). There are different strategies to verify that a certain 440
tracer is conservative or not, such as the commonly used range test (Navratil et al., 441
2012; Palazón and Navas, 2017a; Smith and Blake, 2014), where the value of a given 442
tracer measured in sediment must lie within the range of values observed in the 443
sources. However, the statistical test chosen can select different tracers and, 444
consequently, lead the final mixing model to provide different results (Gaspar et al., 445
2019). In addition, the conservatism test based on mathematical and statistical tests 446
only cannot confirm that the tracer behaves conservatively (Collins et al., 2017b). 447
In the current research, the classical range test based on the maximum and 448
minimum values found in the source samples indicated that 87% of the total variables 449
were conservative, while with the IQR test, only 30% were considered to be 450
conservative. The range test based on maximum and minimum values observed in the 451
sources is less restrictive because, with this test, having only one extreme value for a 452
source sample is sufficient to make the range wider. At the same time, if only one 453
sediment sample has a value outside of the range, it is sufficient to remove the 454
parameter from further analysis. This situation was observed for K and TOC, which 455
were not retained after applying the minimum/maximum range test, because K was not 456
detected in two sediment samples and TOC had a higher concentration in one sediment 457
sample than in the sources, removing two of the three commonly best geochemical 458
tracers used to discriminate potential sediment sources in agricultural catchments. The 459
range test based on IQR proposed by Batista et al. (2018) provided more reasonable 460
results, as it kept only those tracers for which the values measured in the target samples 461
lied within the range found in the sources. Accordingly, it allowed keeping parameters 462
21 that would have been removed otherwise because only one sediment sample was 463
outside of the range of values measured in the sources. Future research considering the 464
application of alternative conservativeness tests for this homogeneous catchment, such 465
as bi-plots or more complex methods considering organic carbon and particle size 466
dependency, may help to select the most appropriate tracers (Smith et al., 2018; Lizaga 467
et al., 2020). 468
The potential of multiple sets of tracers to improve the discrimination between 469
potential sources is clearly shown by the LDA biplot analysis. However, in none of the 470
combinations tested, there was a clear distinction between potential source groups. 471
According to the distribution of dots and ellipses, there is an overlap of groups, 472
especially for the approaches UV and MUV. The combination of GEO with the other sets 473
of tracers, M and UV, improved the discrimination between two groups: surface 474
(pasture and cropland) and subsurface sources (stream bank, unpaved road and gully). 475
The lack of clear discrimination evident in the LDA biplots likely adds uncertainty to the 476
model results. 477
The soils of the catchment are naturally poor in K and P, two of the main 478
macronutrients essential for crop growth and productivity. The addition of fertilizers in 479
croplands and pastures explains the higher concentration of these elements in surface 480
sources, which differed significantly from those found in subsurface sources. The TOC 481
concentration in the Ferralsols of the region is usually higher in the upper layer of the 482
soil, due to the addition of carbon by the plant residues and roots, as observed in a study 483
of Bortolon et al. (2011), where soil analyses had a mean concentration 1.5 times higher 484
in the uppermost 10 cm of the soil compared to the 10-20 cm layer. Indeed, these three 485
tracers (P, K and TOC) have great potential for tracing agricultural land uses. However, 486
the three geochemical tracers selected in the current research (P, TOC and K) are 487
22 usually removed from analysis in most sediment fingerprinting studies, as they are 488
generally considered to be easily enriched or depleted during the erosion process 489
(Palazón and Navas, 2017b; Smith and Blake, 2014). Even though, most studies end up 490
discarding these elements without performing any range tests to assess their 491
conservativeness. For example, in an evaluation of 60 studies that evaluated P as a 492
potential tracer, only 27 of them applied a range test, and of these, P was conservative in 493
85% of cases (Tiecher et al., 2019). Moreover, this parameter was selected to model 494
source contributions in 43% of the 60 sediment fingerprinting studies that were 495
reviewed in Tiecher et al. (2019). 496
The transformation of the sediment composition during the erosion and river 497
transport processes is variable depending on the study site considered. The TOC levels 498
found in sediment samples collected in a previous study conducted in the Conceição 499
River catchment (Tiecher et al., 2018) had a lower concentration in the target material 500
compared to that found in the sources, while in the study of Pulley et al. (2015a) 501
sediment was found to be enriched in TOC compared to potential sources. In 502
catchments with strongly weathered soils rich in iron oxides, P is known to be mainly 503
transported in particulate form in the rivers (Bender et al., 2018). This strong chemical 504
adsorption to soil and sediment particles may preserve the P source signature during 505
their transfer in river systems. The no-tillage farming that is main soil management 506
system in the Conceição catchment in soils with a high content of clay and iron oxides 507
may have induced the physico-chemical protection of C and P into micro aggregates (Six 508
et al., 2002; Snyder and Vázquez, 2005). TOC and P are highly correlated as shown in 509
Figure 3, and the strong physical-chemical protection of these elements may support 510
their conservative behaviour. Furthermore, the conservative behaviour of Fe 511
demonstrates that the reduction from its solid state (oxides with Fe3+) to the aqueous 512
23 one (Fe2+) is not an important process during sediment transport in this catchment, 513
allowing the conservation of the source characteristics. 514
Soil organic carbon, water content, iron oxides and chemical composition are the 515
main parameters responsible for the soil colour (Ben-dor et al., 1998). Although the TOC 516
content had a low correlation with the colour parameters, this parameter can create a 517
source of error in the colour indices, especially when there is a small colour difference 518
between the potential sources (Pulley and Rowntree, 2016a). The soils of the Conceição 519
River catchment are rich in iron oxides, mainly found as goethite and hematite, and 520
colour parameters are closely linked to their respective content in the soils (Schaefer et 521
al., 2008). The A3 index, which is related to the electron pair transition of hematite, have 522
a strong correlation with most colour parameters (data not presented), highlighting the 523
importance of iron oxides in defining the soils and sediment colours in this catchment. 524
Hematite is responsible for the red colour of Ferralsols, while goethite is responsible for 525
the brownish-reddish yellow colour of soils (Cornell and Schwertmann, 2003). The Hr 526
index, which cannot be used in the mixing model because it is not linearly additive, 527
represents the proportion of hematite in the pool of iron oxides (goethite + hematite). 528
Although the soils in the region are predominantly red in colour, their content in 529
goethite is higher than in hematite (Ramos et al., 2020). The Hr index had lower values 530
in the stream banks compared to the other sources, since there is a greater tendency to 531
form goethite in relief positions characterised by the accumulation of water, where 532
ferrihydrite tends to dissolve and form goethite in its place (Schaefer et al., 2008). 533
Owing to the homogeneity of the soil types due to their intense chemical 534
weathering found in the Conceição catchment, the difference in colour and iron oxide 535
parameters between land uses (pastures and croplands) is very low. Differences 536
between surface and subsurface sources tend to be more evident, since a difference in 537
24 TOC and clay content is usually observed in this type of soils (Table 4) (Testoni et al., 538
2017). A similar observation is valid for magnetic parameters, which are closely related 539
to the ferromagnetic properties of the soil, which are in turn mainly controlled by 540
particle size and the nature of parent material (Pulley and Rowntree, 2016b). As the 541
potential sources evaluated are originated from very similar soil types and parent 542
material in our catchment, M and UV parameters did not improve significantly the 543
discrimination between land use-based sources. 544
In the same way as with the GEO parameters selected, UV and M likely provided 545
stronger discrimination between surface and subsurface sources. When UV parameters 546
were used in isolation, they were able to classify correctly almost 60% of the samples in 547
their respective groups, which is not so different from the %SCC obtained with GEO 548
tracers alone (68%), according to the LDA. This demonstrates the potential of UV and M 549
tracers to provide a low-cost alternative to GEO tracers. Although UV parameters were 550
not very effective alone in the current research, they have already been used 551
successfully in other case studies (Evrard et al., 2019; Pulley et al., 2018). 552
The low conservativeness of the tracers tested may also be associated with 553
particle size issues (Laceby et al., 2017). Owing to time and financial constraints it was 554
not possible to conduct particle size analyses. Future studies should also consider 555
assessing how particle size may affect conservativeness during erosion, transport and 556
deposition processes in large river catchments. Furthermore, clay soils with high levels 557
of iron oxides, as observed in the present catchment, often form strong stable 558
microaggregates, during erosion process and transport processes, which may behave 559
similarly to coarse particles (silt and sand) (Droppo et al, 2005). Future research should 560
therefore investigate how microaggregates may also affect tracer conservativeness in 561
sediment fingerprinting research in large scale catchments. 562
25
4.2 Mixing model results
563
The results of the mixing model are impacted by the relatively bad quality of the 564
sediment source discrimination. The small difference in tracer signature observed 565
within a given group (surface or subsurface) introduces high uncertainties in the mixing 566
model (Pulley et al., 2017a). The mixing model results in a large IQR, which means that 567
the uncertainty in the model predictions is high. However, the mean results are similar 568
to those observed by Tiecher et al. (2018), who showed that surface sources provided 569
the main source of suspended sediment collected following the TISS strategy, and 570
subsurface sources, mainly stream bank, supplied the main source for FBS samples. The 571
model results according to the different sets of tracers were consistent and there were 572
no major differences between them. Although there is some correlation between the 573
selected parameters in each approach (Figure 3), the potential effect of this collinearity 574
cannot be tested without artificial mixtures, which should be recommended for future 575
research. 576
Pasture and cropland were poorly distinguished by the discriminant analysis. As 577
a consequence, the mixing model predicted a larger contribution of pastures, which is 578
not consistent with the situation observed in the catchment, where the percentage of 579
land use occupied by pasture is much lower (maximum of 11.9%) and where soil 580
erosion remains limited under this land use. Unpaved roads provided the source that 581
contributed the least to sediment, as observed by Tiecher et al. (2018). Considering the 582
mean source contributions obtained in the current research, they remained consistent 583
with our overall understanding of the hydro-sedimentary behaviour of the catchment, 584
although the high uncertainties associated with the model predictions limited the 585
potential use that could be made of these calculated contributions (e.g. for catchment 586
and river management). In that, the results of the current research strongly differed 587
26 from those of Chen et al. (2019), who obtained a good discrimination between land uses 588
using the geochemical composition in a catchment with similar geological conditions in 589
the Three Gorges Dam Region, China. However, this study was conducted in two small 590
catchments (0.78 and 0.46 km²) with shallow (< 50 cm depth) and poorly developed 591
soils with rock fragments, and land use management was also very different. 592
Accordingly, this shows that considering the homogeneity of geological conditions is not 593
sufficient to derive the tracer list as different pedogenic processes and land use 594
mangement may impact the tracing properties. 595
The selection of tracers to be used in each study is generally defined by the 596
constraints of financial resources and access to the analytical facilities (Collins et al., 597
2017a). However, the priority should be given to the physico-chemical basis supporting 598
the potential sediment source. UV or M properties are often suggested as low cost 599
tracers, but in a catchment with limited geological variability and intense chemical 600
weathering such as under tropical conditions, their use is not straightforward. Indeed, 601
soils had almost homogeneous chemical compositions and a reddish colour through the 602
whole soil profile. Under these conditions, UV had low variability and does not provide a 603
good tracer for discriminating land use-based sources. The need to add a set of different 604
tracers in sediment fingerprinting studies is expected to increase as geological and soil 605
type variability increases in the catchment, as well as the number of sources of interest 606
increases. 607
As a consequence, the discrimination between the sources achieved in the 608
current research remained low, and the modelling results uncertain. Furthermore, as 609
observed by Haddadchi et al. (2013), mixing models may lead to different results 610
depending on the input data. To avoid this problem, the use of tracers with >90% of SCC 611
or the preparation of artificial mixtures for model validation should be systematically 612
27 recommended in future sediment fingerprinting approaches. Indeed, there may simply 613
be limitations to the efficacy of the sediment fingerprinting technique in catchments 614
with homogeneous geology or soil types that can be found in many regions of the world, 615
mainly under tropical climates where soils are highly weathered. 616
A significant proportion of the most productive soils around the world are found 617
under these conditions, and this situation strengthens the need to develop new 618
approaches to discriminate between these land use-based sources. Alternative tracers 619
such as environmental DNA (Foucher et al., 2020) and compound specific stable 620
isotopes (CSSI) (Blake et al., 2012) may provide a powerful alternative to trace the 621
contribution of specific land use sources to sediment. However, technical solutions 622
allowing for the global application of these methods still need to be developed (Brandt 623
et al., 2018; Evrard et al., 2019). Moreover, the application of these vegetation specific 624
related tracers maybe even more challenging in large tropical catchments, characterised 625
by transient and heterogeneous land uses which are often scarcely documented. 626
Accordingly, their use in combination with more conventional tracers may provide a 627
solution to provide consistent and reliable estimations of sediment source contributions 628
to help achieving sustainable agricultural development goals in these regions. 629
5 Conclusions
630The use of alternative tracers based on ultraviolet-visible spectra combined with 631
geochemical parameters improved the sediment source discrimination in the Conceição 632
River catchment. However, the low differences in source signatures observed in this 633
study site resulted in high uncertainties associated with the model predictions, which is 634
mainly due to the homogeneous soil types occurring in the catchment, which are highly 635
weathered and which have a low variability between land uses, as well as between 636
28 surface and subsurface sources. Furthermore, in such a homogeneous catchment, the 637
low differences between sources observed for almost all the tested parameters 638
increased the probability of sediments to lie outside of the range observed in the 639
sources and to be removed by the range/conservative tests, which further reduced the 640
number of tracer options. 641
Magnetic, geochemical and ultraviolet-visible derived parameters have proven to 642
be relatively ineffective for tracing land use-based sources in the Conceição River 643
catchment. When using only one set of tracers, which does not provide a robust 644
discrimination between the sources leading to low percentages of correctly classified 645
samples by the LDA, the results of the model should be used with caution, since they are 646
associated with large uncertainties. This study presents results that differ from those 647
commonly observed in the literature, where additional tracers generally have positive 648
results, showing that the sediment fingerprinting technique may not provide 649
meaningful results in all situations. Tracers with a greater potential for land use 650
discrimination, such as environmental DNA or CSSI, could provide an alternative for 651
better understanding soil erosion processes in the Conceição River catchment and other 652
similar homogeneous catchments worldwide. As such, future research should 653
investigate the efficacy of these next generation tracers in increasingly difficult tracing 654
environments with more attention to the potential impact of particle size on them. 655
656
6 Acknowledgments
657The authors would like to thank to Conselho Nacional de Pesquisa - CNPq, 658
Coordenação de Aperfeiçoamento de Pessoal de Nível Superior - CAPES, Financiadora
659
de Estudos e Projetos – FINEP for providing financial support. Furthermore, the authors 660
29 are grateful to the “Mais Água” and FAPERGS PRONEX n° 008/2009 projects for their 661
support. The authors are also grateful to CAPES for founding the PhD scholarship of the 662
first author Rafael Ramon in the framework of the CAPES-COFECUB Project No. 663 88887.196234/2018-00. 664 665
7 References
666Almagro, Andre, Almagro, André, Oliveira, P.T.S., Nearing, M.A., Hagemann, S., 2017. 667
Projected climate change impacts in rainfall erosivity over Brazil Projected climate 668
change impacts in rainfall erosivity over Brazil 0–12. 669
https://doi.org/10.1038/s41598-017-08298-y 670
Anache, J.A.A., Wendland, E.C., Oliveira, P.T.S., Flanagan, D.C., Nearing, M.A., 2017. Runoff 671
and soil erosion plot-scale studies under natural rainfall: A meta-analysis of the 672
Brazilian experience. CATENA 152, 29–39.
673
https://doi.org/10.1016/j.catena.2017.01.003 674
Batista, P.V.G., Laceby, J.P., Silva, M.L.N., Tassinari, D., Bispo, D.F.A., Curi, N., Davies, J., 675
Quinton, J.N., 2018. Using pedological knowledge to improve sediment source 676
apportionment in tropical environments. J. Soils Sediments. 677
https://doi.org/10.1007/s11368-018-2199-5
678
Belmont, P., Willenbring, J.K., Schottler, S.P., Marquard, J., Kumarasamy, K., Hemmis, J.M., 679
2014. Toward generalizable sediment fingerprinting with tracers that are 680
conservative and nonconservative over sediment routing timescales. J. Soils 681
Sediments 14, 1479–1492. https://doi.org/10.1007/s11368-014-0913-5 682
Ben-dor, E., Irons, J., Epema, G.F., 1998. Soil Reflectance, in: Rencz, A.N. (Ed.), Remote 683
Sensing for the Earth Sciences. Manual of Remote Sensing. John Wiley & Sons, Ltd, 684
30 New York, pp. 111–188.
685
Bender, M.A., dos Santos, D.R., Tiecher, T., Minella, J.P.G., de Barros, C.A.P., Ramon, R., 686
2018. Phosphorus dynamics during storm events in a subtropical rural catchment 687
in southern Brazil. Agric. Ecosyst. Environ. 261. 688
https://doi.org/10.1016/j.agee.2018.04.004
689
Blake, W.H., Ficken, K.J., Taylor, P., Russell, M.A., Walling, D.E., 2012. Tracing crop-690
specific sediment sources in agricultural catchments. Geomorphology 139–140, 691
322–329. https://doi.org/10.1016/j.geomorph.2011.10.036Boardman, J., 692
Vandaele, K., Evans, R., Foster, I.D.L., 2019. Off-site impacts of soil erosion and 693
runoff: Why connectivity is more important than erosion rates. Soil Use Manag. 35, 694
245–256. https://doi.org/10.1111/sum.12496 695
Bortolon, E.S.O., Mielniczuk, J., Tornquist, C.G., Lopes, F., Bergamaschi, H., 2011. 696
Validation of the Century model to estimate the impact of agriculture on soil 697
organic carbon in Southern Brazil. Geoderma 167–168, 156–166. 698
https://doi.org/10.1016/j.geoderma.2011.08.008
699
Borrelli, P., Robinson, D.A., Fleischer, L.R., Lugato, E., Ballabio, C., Alewell, C., 700
Meusburger, K., Modugno, S., Schütt, B., Ferro, V., Bagarello, V., Oost, K. Van, 701
Montanarella, L., Panagos, P., 2017. An assessment of the global impact of 21st 702
century land use change on soil erosion. Nat. Commun. 8, 2013. 703
https://doi.org/10.1038/s41467-017-02142-7
704
Brandt, C., Dercon, G., Cadisch, G., Nguyen, L.T., Schuller, P., Linares, C.B., Santana, A.C., 705
Golosov, V., Benmansour, M., Amenzou, N., Xinbao, Z., Rasche, F., 2018. Towards 706
global applicability? Erosion source discrimination across catchments using 707
compound-specific δ13C isotopes. Agric. Ecosyst. Environ. 256, 114–122. 708
https://doi.org/10.1016/j.agee.2018.01.010 709
Brosinsky, A., Foerster, S., Segl, K., Kaufmann, H., 2014a. Spectral fingerprinting: 710
31 sediment source discrimination and contribution modelling of artificial mixtures 711
based on VNIR-SWIR spectral properties. J. Soils Sediments 14, 1949–1964. 712
https://doi.org/10.1007/s11368-014-0925-1 713
Brosinsky, A., Foerster, S., Segl, K., López-Tarazón, J.A., Piqué, G., Bronstert, A., 2014b. 714
Spectral fingerprinting: characterizing suspended sediment sources by the use of 715
VNIR-SWIR spectral information. J. Soils Sediments 14, 1965–1981. 716
https://doi.org/10.1007/s11368-014-0927-z 717
Caner, L., Petit, S., Joussein, E., Fritsch, E., Herbillon, A.J., 2011. Accumulation of organo-718
metallic complexes in laterites and the formation of Aluandic Andosols in the 719
Nilgiri Hills (southern India): similarities and differences with Umbric Podzols. Eur. 720
J. Soil Sci. 62, 754–764. https://doi.org/10.1111/j.1365-2389.2011.01389.x 721
Chen, F., Wang, X., Li, X., Wang, J., Xie, D., Ni, J., Liu, Y., 2019. Using the sediment 722
fingerprinting method to identify the sediment sources in small catchments with 723
similar geological conditions. Agric. Ecosyst. Environ. 286, 106655. 724
https://doi.org/10.1016/j.agee.2019.106655
725
Chen, M., Ma, L.Q., 2001. Comparison of Three Aqua Regia Digestion Methods for Twenty 726
Florida Soils. Soil Sci. Soc. Am. J. 65, 491–499. 727
https://doi.org/10.2136/sssaj2001.652491x 728
CIE, 1978. Commission Internationale d’Eclairage. Recommendations on Uniform 729
Colour Spaces, Colour Difference Equations, Psychometrice Colour Terms. J. Oral 730
Rehabil. 731
CIE, C.I. de l’Eclairage, 1931. Commission Internationale de l’Eclairage (CIE), in: CIE 732
Proceedings. Cambridge University Press, Cambridge, UK. 733
Collins, A.L., Foster, I.D.L., Gellis, A.C., Porto, P., Horowitz, A.J., 2017a. Sediment source 734
fingerprinting for informing catchment management: Methodological approaches, 735
32 problems and uncertainty. J. Environ. Manage. 194, 1–3. 736
https://doi.org/10.1016/j.jenvman.2017.03.026 737
Collins, A.L., Pulley, S., Foster, I.D.L., Gellis, A., Porto, P., Horowitz, A.J., 2017b. Sediment 738
source fingerprinting as an aid to catchment management: A review of the current 739
state of knowledge and a methodological decision-tree for end-users. J. Environ. 740
Manage. 194, 86–108. https://doi.org/10.1016/j.jenvman.2016.09.075 741
Collins, A.L., Walling, D.E., Webb, L., King, P., 2010a. Apportioning catchment scale 742
sediment sources using a modified composite fingerprinting technique 743
incorporating property weightings and prior information. Geoderma 155, 249–261. 744
https://doi.org/10.1016/j.geoderma.2009.12.008 745
Collins, A.L., Zhang, Y., Walling, D.E., 2010b. Apportioning sediment sources in a 746
grassland dominated agricultural catchment in the UK using a new tracing 747
framework. Sediment Dyn. a Chang. Futur. 337, 68–75. 748
Cornell, R.M., Schwertmann, U., 2003. The iron oxides. Structure, properties, reactions, 749
occurences and uses, Second. ed. WILEY-VCH Verlag GmbH & Co. KGaA, Weinheim. 750
Da Silva, Y.J.A.B., Do Nascimento, C.W.A., Biondi, C.M., 2014. Comparison of USEPA 751
digestion methods to heavy metals in soil samples. Environ. Monit. Assess. 186, 47– 752
53. https://doi.org/10.1007/s10661-013-3354-5 753
Didoné, E.J., Gomes Minella, J.P., Andres Schneider, F.J., Londero, A.L., Lefèvre, I., Evrard, 754
O., 2019. Quantifying the impact of no-tillage on soil redistribution in a cultivated 755
catchment of Southern Brazil (1964–2016) with 137Cs inventory measurements. 756
Agric. Ecosyst. Environ. 284, 106588. https://doi.org/10.1016/j.agee.2019.106588 757
Didoné, E.J., Minella, J.P.G., Merten, G.H., 2015. Quantifying soil erosion and sediment 758
yield in a catchment in southern Brazil and implications for land conservation. J. 759
Soils Sediments 15, 2334–2346. https://doi.org/10.1007/s11368-015-1160-0 760
Droppo, I.G., Nackaerts, K., Walling, D.E., Williams, N., 2005. Can flocs and water stable 761