Publisher’s version / Version de l'éditeur:
Proceedings of the 7th International Conference on the Application of Physical
Modelling in Coastal and Port Engineering and Science (Coastlab18), 2018
READ THESE TERMS AND CONDITIONS CAREFULLY BEFORE USING THIS WEBSITE. https://nrc-publications.canada.ca/eng/copyright
Vous avez des questions? Nous pouvons vous aider. Pour communiquer directement avec un auteur, consultez la première page de la revue dans laquelle son article a été publié afin de trouver ses coordonnées. Si vous n’arrivez pas à les repérer, communiquez avec nous à [email protected].
Questions? Contact the NRC Publications Archive team at
[email protected]. If you wish to email the authors directly, please see the first page of the publication for their contact information.
NRC Publications Archive
Archives des publications du CNRC
This publication could be one of several versions: author’s original, accepted manuscript or the publisher’s version. / La version de cette publication peut être l’une des suivantes : la version prépublication de l’auteur, la version acceptée du manuscrit ou la version de l’éditeur.
Access and use of this website and the material on it are subject to the Terms and Conditions set forth at
Evaluation of a numerical wave modelling tool for studying the
overtopping of rubblemound breakwaters
Pilechi, Abolghasem; Baker, Scott; Cornett, Andrew
https://publications-cnrc.canada.ca/fra/droits
L’accès à ce site Web et l’utilisation de son contenu sont assujettis aux conditions présentées dans le site LISEZ CES CONDITIONS ATTENTIVEMENT AVANT D’UTILISER CE SITE WEB.
NRC Publications Record / Notice d'Archives des publications de CNRC:
https://nrc-publications.canada.ca/eng/view/object/?id=94ba2dba-798a-49ad-adae-8da16d881b9c https://publications-cnrc.canada.ca/fra/voir/objet/?id=94ba2dba-798a-49ad-adae-8da16d881b9cProceedings of the 7
thInternational Conference on the
Application of Physical Modelling in Coastal and Port
Engineering and Science (Coastlab18)
Santander, Spain, May 22-26, 2018
EVALUATION OF A NUMERICAL WAVE MODELLING TOOL FOR STUDYING THE
OVERTOPPING OF RUBBLEMOUND BREAKWATERS
ABOLGHASEM PILECHI1, SCOTT BAKER2, ANDREW CORNETT3
1 National Research Council, Canada, [email protected] 2 National Research Council, Canada, [email protected] 3 National Research Council, Canada, [email protected]
ABSTRACT
Wave overtopping of rubblemound breakwaters is a complex physical process which influences the functional efficiency and structural stability of the structure. The mean overtopping discharge resulting from design wave and water level conditions is often an important consideration affecting the selection of breakwater profile and crest height. The volume of water which passes over the crest of a breakwater depends on the structure geometry and composition, the nearshore bathymetry, the water level, and the seastate conditions.
Physical modelling at large scale has traditionally provided a robust and reliable means to support the design of rubblemound breakwaters. Recent advancements in computational fluid dynamics and computing power have led to increasing efforts to use numerical modelling as a complementary tool to physical modelling for breakwater design applications.
This paper compares measurements from a physical model study of rubblemound breakwaters conducted by the National Research Council of Canada (NRC) with numerical simulations produced by the numerical model IH2VOF. The skill of the IH2VOF model in predicting free-surface elevations and mean wave overtopping discharges is assessed. The comparisons are conducted for a range of seastate conditions, water levels, and breakwater geometries. The findings demonstrate that IH2VOF offers a viable tool to complement physical model testing for rubblemound breakwater design applications.
KEYWORDS: IH2VOF, overtopping, VOF, CFD, physical modelling, numerical modelling.
1 INTRODUCTION
Wave overtopping is one of the principle concerns in designing sea defences and related structures. The phenomenon occurs when wave run-up levels are above the highest elevation (crest) of the structure. Selection of the profile and crest height of rubblemound breakwaters are two of the major stages of the design process. Earth-filling operations use a significant portion of the total construction cost of these structures. This fact, in addition to different design considerations such as the required operational level, failure risk, and aesthetic aspects, plays an important role in the selection of the optimum cross-section design.
Overtopping discharge is closely related to the stability of the structure and safety of the people it serves. EurOtop 2016 provides guidance for classifying the severity of the impact according to the average overtopping discharge (see Table 1). The number of processes involved such as wave run-up, wave breaking, wave penetration and transmission in porous media, together with their complexity, make the prediction of wave overtopping challenging and complicated. According to Losada et al. (2007), the wave overtopping rate of a structure depends on structure topology, geometry, material characteristics, incident wave conditions, and foreshore bathymetry. Besides the structure profile, the average volume of water that passes over a rubblemound breakwater depends on environmental conditions such as the nearshore bathymetry, the seastate conditions and the water levels. A wave overtopping process is generally described by the volume of maximum overtopping events and the mean overtopping discharge over an event period. However, the mean overtopping discharge is more popular as it is easier to measure and classify.
Table 1. Classification of the mean overtopping discharge based on the impact factor.
q < 0.1 l/s/m Insignificant with respect to strength of crest and rear of a structure.
q = 1 l/s/m On crest and landward slopes, bad grass covers or clay may start to erode. It will not give erosion to
rubblemound structures.
q = 10 l/s/m Significant overtopping for dikes, embankments. For large wave heights it may lead to severe erosion on
the harbour side of rubblemound breakwaters.
q = 100 l/s/m Crest and inner slopes of dikes have to be protected by asphalt or concrete; for rubblemound breakwaters
Various studies have been conducted to provide guidelines to estimate overtopping discharge for coastal structures. A majority of the studies use 2D physical models to investigate the hydraulic response of different breakwater profiles and compositions to incident waves. Jensen and Juhl (1987), Aminti and Franco (1988), Bradbury and Allsop (1988), de Waal (1994) are some of the earliest such physical model studies. Goda (1985) has been historically used as one of the main references for designing vertical and composite structures. Franco (1994) and Hebsgaard et al. (2001) are two other examples of physical model studies on overtopping of rubblemound breakwaters. EurOtop (2016) gathers and summarizes most of the wave overtopping-related formulas and provides guidance on predicting and analyzing wave overtopping for coastal structures. The empirical formulations have been successfully used as the primary design tools for decades. However, these formulas are based on experiments conducted in controlled laboratory conditions, and on a limited number of structure geometries, topologies, and incident wave conditions. Therefore, using numerical approaches for modelling wave-structure interaction, including wave overtopping, has become more popular, particularly over the last decade due the advances in computational technology.
In recent years numerical modelling approaches for coastal engineering applications have become increasingly popular. This is due to advancements in computational technologies resulting in flexible and faster numerical models, and an increasing number of available open-source models. Although numerical models have limitations in capturing the complete physics of many phenomena, comparison of their outputs with physical modelling results has proved that they can be used as a complementary solution to physical modelling for different problems. However, these models have to be assessed in order to identify their accuracy and sensitivity to different effective parameters before being used as a solution for a specific problem. Losada et al. (2007) reviews the available numerical models for modelling wave-structure interaction problems and uses the COBRAS-UC model, which is an improved version of the COBRAS model developed by Hsu et al. (2002) to investigate the interaction of random waves with a rubblemound breakwater. The COBRAS-UC model has been further developed at IH Cantabria. The model has been enhanced with a GUI, providing abilities of pre-processing, mesh generation, and post-processing, as well as the capability to generate various wave types, and is currently available under the commercial name of IH2VOF.
The model has been previously validated for waves breaking over porous and impermeable slopes applications such as submerged permeable sea dikes (Lara et al., 2006), low-crested permeable sea dikes (Garcia et al., 2004), and rubblemound breakwaters (Guanche et al., 2009). Furthermore, Van den Bos et al. (2014) compare the performance of two numerical models SWASH and IH2VOF, and an analytical model based on the work of Madsen and White (1976) in modelling a porous flow inside a rubblemound structure. The modelling results were verified by a Mellink (2012) physical modelling study. They reported that despite both numerical models performing fairly well in reflection reproduction and SWASH being more computationally efficient, IH2VOF performed slightly better in the estimation of the transmitted waves. They also stated that IH2VOF is versatile in modelling complex structures.
NRC has extensive experience in conducting physical modelling studies on rubblemound breakwaters aimed to evaluate and optimize various design alternatives to best serve the identified requirements for the structure. In one previous physical model study, NRC evaluated the performance of a revetment protection scheme designed to help protect a causeway embankment linking Qatar to Bahrain. A number of tests were conducted to investigate the performance of various alternative revetment cross-sections intended for protecting the embankment. The performance of the sections was determined by observing stability of the various rock armour layers and also measuring the volume of water that overtopped the crest. The revetments were tested under the influence of design storms varying 1-year to 10,000-year return period.
This present study evaluates the performance of the IH2VOF model in modelling the overtopping of rubblemound breakwaters by comparing the numerical model and the physical model results for water surface elevations and average overtopping discharges. In this regard, two revetment cross-sections with different geometries and compositions were chosen from the previously tested cases in the Qatar-Bahrain causeway physical modelling study. For each cross-section, the numerical model was used to simulate the 10,000-year storm condition (which had the maximum measured average overtopping discharge). Setup for the numerical model is discussed in more detail in Section 3.
2 PHYSICAL MODEL
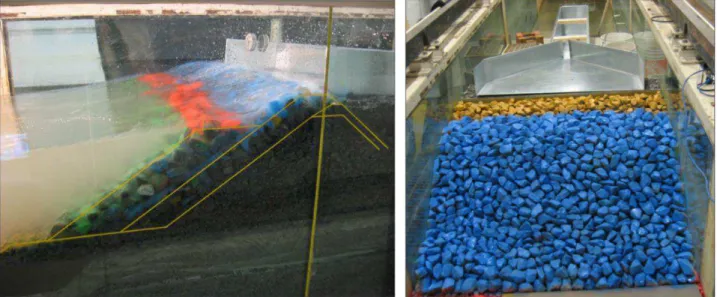
A program of physical hydraulic model tests was conducted to assist in designing a 40km long causeway to withstand the extreme waves forecast for the deployment site (see Figure 1). The model tests were conducted at a scale of 1:20 in NRC’s 64m long by 1.2m wide by 1.2m deep Steel Wave Flume located in Ottawa, Canada. This scale represents a compromise between the minimization of scale effects, and the maximization of the size of waves and constructible revetment within the facility. Froude scaling was used to convert quantities measured in the model to full scale or prototype values.
The flume is equipped with a pair of computer-controlled wave generators, one located at either end of the flume. These wave machines can produce a range of regular waves and irregular seastates, and are equipped with a high-performance active wave absorption (AWA) system that is capable of generating outgoing waves while simultaneously absorbing incoming waves reflected from a test structure. The flume is outfitted with large windows at the test section which allowed for detailed observation of wave-structure interactions as well as interstitial flows.
Figure 1. Wave interaction with a rubblemound revetment (left); Revetment after construction showing the overtopping tray and catchment (right).
The model revetment was constructed on a concrete bathymetry designed to represent the relatively shallow sloping bathymetry fronting much of the causeway. The model bathymetry was flat in the centralized viewing portion of the flume where the revetment was constructed (roughly 80m offshore of the structure toe). The elevation of the flat floor here was either -4m or -5m depending on which revetment section was being modelled (some sections were in slightly deeper water). Travelling offshore from the revetment towards the wave generator, the concrete bathymetry sloped gently down at a 1:280 slope for ~170m, continued at a 1:33.5 slope for 135m, and a 1:10 slope for 38m. Beyond this point the bottom of the flume was flat at a depth of either -12.6m or -13.6m (again depending on the depth of water selected for the structure) for approximately 475m. In the nearshore area beneath the structure, the bathymetry was comprised of fine sand to investigate (qualitatively) the possibility of toe scour and cross-shore movement of sediments. The revetment structures were faithfully constructed replicas of the prototype designs using carefully selected rock materials, and the concrete wave wall was modelled using an impervious obstruction for the first test series, and later faithfully replicated out of concrete for all subsequent tests. With the wave flume floor set to -12.6 or -13.6m, the wave machine produced (approximately) up to a 3.75m (full scale) maximum wave height at the paddle (depending on the wave period). The storm waves transformed (and sometimes broke) over the model bathymetry and provided a good representation of the prototype waves acting on the structure. A return flow conduit was provided through the concrete bathymetry to prevent overtopping flows from creating a permanent set-up on the leeside of the revetment (that would correspond with a permanent set-down on the offshore side).
Wave conditions were measured at 10 locations using capacitance wave gauges. Probes 1-6 were located on the flat flume floor (in deep water), and probes 7-10 were positioned in transitional waters approaching the structure (with WP10 located ~80m offshore of the revetment toe). Wave probe 11 was placed leeward of the revetment inside a catchment used to measure overtopping (see the next section for more detail).
A simple, accurate and reliable overtopping measurement system was used to collect and measure the time-averaged overtopping discharge passing over the model structure. For a given time period, usually 1 or 2 hours, wave run-up that proceeded beyond the structure crest and over the wave wall was conveyed by a metal tray to a catchment where the overtopping flows were collected (see Figure 1). During storms with little or very minor amounts of overtopping, the flows were conveyed to a smaller container that was weighed, thus providing a very accurate measurement of the time-averaged overtopping rate. When the overtopping was persistent enough to exceed the size of the smaller container, a large (2.2m by 0.3m, model scale) catchment was used to collect the overtopping, and a wave probe was used to measure the rise in water level in the catchment. This data was analyzed to determine the time-averaged overtopping rate.
2.1 Test Program Summary
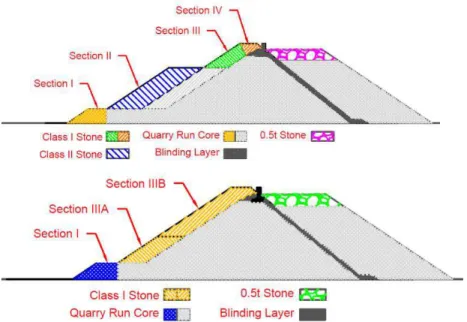
Three representative locations along the causeway were selected for model testing. Since the main focus of the model study was to investigate the overtopping and stability of the revetment during large storms events, waves and water levels near the upper range of the tidal scale were of most interest. The revetment cross-sections were tested for a range of increasingly severe seastates up to a return period of 10,000-years. The 10,000-year storm condition featured a significant wave height of 2.13m, a peak wave period of 14.1s, and a water level of +2.4m. A number of test series were conducted to study the stability of the several variants of the revetment cross-sections under the design storms. Schematic views of the cross-sections modelled in this study (T2B and T3A) are illustrated in Figure 2.
Figure 2. Schematic view of the studied revetment cross-sections: (top) T2B, (bottom) T3A.
3 NUMERICAL MODEL
The numerical model used in the study is the IH2VOF model, which is a two-dimensional model describing water particle movement by solving the Navier-Stokes-type equations on a structured grid. The model is hybrid domain based and solves the Reynolds Averaged Navier-Stokes (RANS) equations in the fluid domain, and the Volume-Averaged Reynolds Averaged Navier-Stokes (VARANS) in the porous media. It uses the Volume Of Fluid technique (Hirt and Nichols, 1981) for tracking the free surface. The model manages turbulence closure using the k-ε model. More information about the governing equations and numerical schemes can be found in the IH2VOF user manual and in Lara et al. (2010). In this section, the set up process and the related influential factors are presented. It should be noted that the numerical model in this study was developed at the prototype scale. For the purpose of this study, two of the tested cross-sections in the physical model (2B and 3A) with similar rock size classes and different geometry and composition of the layers were modelled by the numerical model.
3.1 Mesh generation
Mesh generation is an important step in any numerical model. Significant reliance of the numerical models on the quality and resolution of the grids enhances the importance of this process. The suggestions and findings of previous modelling studies with IH2VOF such as Lara and Maza (2016), van der Neut (2015), and Dogan (2016) were taken into account for setting up the model in this study. Factors taken into account for the mesh generation include providing at least 10 cells per wave height and 100 cells per wave length of the incident waves, an aspect ratio (ΔX/ΔY) to be smaller than 5 within the offshore boundary and the structure toe, an aspect ratio to be equal to 2 within the structure region, and including at least two to three cells across the width of the breakwater crest. The geometry of the crown wall was also considered in defining the mesh resolution and layout in the vicinity of the breakwater crest. The final grid was chosen from a sensitivity analysis on the grid resolution in order to provide the maximum required accuracy in the minimum computational time. The generated mesh includes three sub-zones in the horizontal (X) and two sub-zones in the vertical (Y) directions. The cell sizes shrink in the x-direction from 0.4m at the seaward boundary to 0.2m at the toe of the breakwater. The grid size remains constant across the breakwater region and expands towards the end of the
Xmax. In the y-direction, the grid sizes shrink from dy=0.3m at Ymin to dy=0.1m at Y=5m. It remains constant (dy=0.1m)
between Ymax and Y=5m. The grid has a total number nx=1704 cells in the x-direction and ny=122 cells in the y-direction.
3.2 Boundary conditions
The wave overtopping process is a random process with respect to time, space, and volume and is generated by the larger waves. However, as each single wave has its own contribution to the total overtopping discharge, for the purpose of comparing a numerical model and a physical model, it is essential that the numerical model is tested by the exact same wave signal as generated in the physical model. The test case in this study is 914m long in the prototype scale with a distance from the boundary to the beginning of the shallow water region of 475m. In order to reduce the computational cost and follow the recommended cell aspect ratio for the grid, the boundary of the computational domain was moved to the location of WG4 (see Figure 3) in the physical model. The wave characteristic parameters obtained from the measured free-surface elevations at WG4 were used to generate waves at the numerical boundary.
Figure 3. Wave gauges located in the numerical model domain.
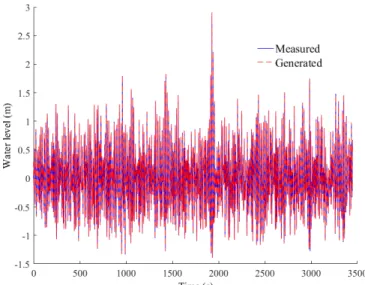
IH2VOF allows generating solitary, irregular, and regular waves at the boundary. The model provides two options for generating wave series: the user can import the time series of the free surface elevation; or specify intended wave characteristics, and the model regenerates the time series of velocity (horizontal and vertical) and free surface based on the given input. The first method was used to simulate the exact same wave signals that were used in the physical model as for the numerical model (see Figure 4). In order to reconstruct the wave series for the boundary, the user specifies the number of components to be used for the Fast Fourier Transform operation. Choosing the appropriate value for this parameter is essential for reproducing a signal that closely conforms to the physical model conditions.
Figure 4. Generated water surface elevation by the model at WG4.
Two paddle types (static and dynamic) are available in the model. The static wave-paddle applies a Dirichlet boundary condition from time series of free-surface elevation and velocity. In the dynamic paddle type, the actual moving paddle is simulated. In this study, static wave-paddle was used as it showed better performance than the dynamic wave-paddle in Van der Neut (2015).
3.3 Defining geometry
The topology and permeability of the structure are defined by combining different layers of obstacles and porous media components. Each component is built as a polygon by specifying the coordinates of its vertices. The porous property of each component is determined by the average size (D50) of the construction material and the associated
porosity. For the D50, the same values as in the physical model were used. Three classes of stones were used in
construction of the structures in this study. For each class, the porosities were estimated based on the D50 and the
suggested corresponding values in IH2VOF user manual. In the VARANS equations, the interfacial forces between the fluid and solids are incorporated from the Forchheimer relationship (see Eq.1) accounting for the linear and nonlinear drag forces.
� = � �� −� � � +
−�
� �� �|�| (1)
In Eq.1, α and β are the empirical parameters used in the calibration of the numerical model, n is the porosity, ν is the kinematic viscosity and u stands for the velocity. The significance of α and β is not precisely known for oscillatory flows. However, Lara et al. (2008) suggests the Reynolds number, the shape of the stones, the grade of the porous material, the permeability, and the flow characteristics as the factors influencing the value of α and β. According to Lara (2002) for wave-breakwater interaction problems, the value of α does not have a strong impact on the results. However, the value of β is more consequential as it is multiplied by the squared velocity. The added mass coefficient (cA) is an
additional parameter affecting the inertia term and is used in IH2VOF for defining characteristics of the porous media (Lara et al. 2008). Some of the available formulas and suggestions in the literature for choosing the appropriate value for cA, α and β are gathered in Table 2).
Table 2. Suggested values for linear (α), non-linear (β) and added mass (cA) coefficients. Study cA α β 1 Hsu et al. (2002) n n 1 34 . 0 200 1.1 2 Lara (2011) 0.34 0.43 50 22 . 4409 D 0.1075 50 5 . 1 3 ) 1 ( 27 . 12 D n n 3 Guanch (2007) Vertical breakwaters 0.34 200 0.8 (External layer) 1.1 (Core) 4 Guanch (2007) Composite breakwaters 0.34 200 0.7 (External layer) 0.8 (Core) 1.1 (Internal layer)
From consultation with IH2VOF developers, and after conducting sensitivity analysis on cA, α, and β, the
suggested values in Guanch (2007) for composite breakwaters were used for defining porous layers in this study. A summary of the stone sizes used in each test case and the corresponding permeability characteristics is provided in Table 3.
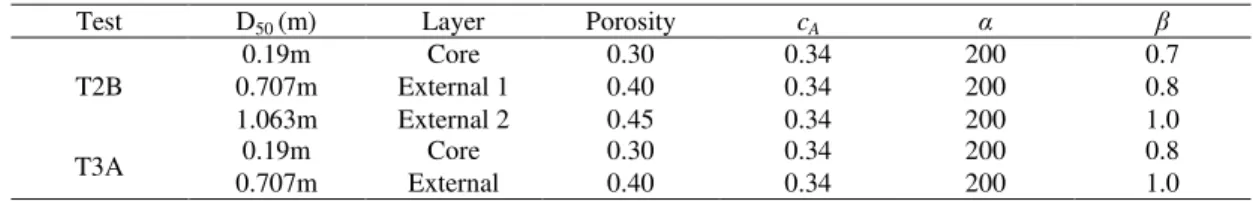
Table 3. Characteristics of the materials used in different layers of the structure.
Test D50 (m) Layer Porosity cA α β
T2B 0.19m Core 0.30 0.34 200 0.7 0.707m External 1 0.40 0.34 200 0.8 1.063m External 2 0.45 0.34 200 1.0 T3A 0.19m Core 0.30 0.34 200 0.8 0.707m External 0.40 0.34 200 1.0
4 RESULT AND DISCUSSION
In this section, the performance of the model in predicting the wave propagation from deep to shallow water, and the average overtopping discharge of a rubblemound structure is investigated for test cases T2B and T3A. Through the modelling process, sensitivity analysis and calibration was first performed on the T2B case, and the optimal configuration was examined for the T3A case. For each case, the measured and modelled values for free-surface elevations and the overtopping discharge were compared. Various configurations of the numerical model are discussed and the factors that significantly influence the model performance are identified.
4.1 Free-surface elevation
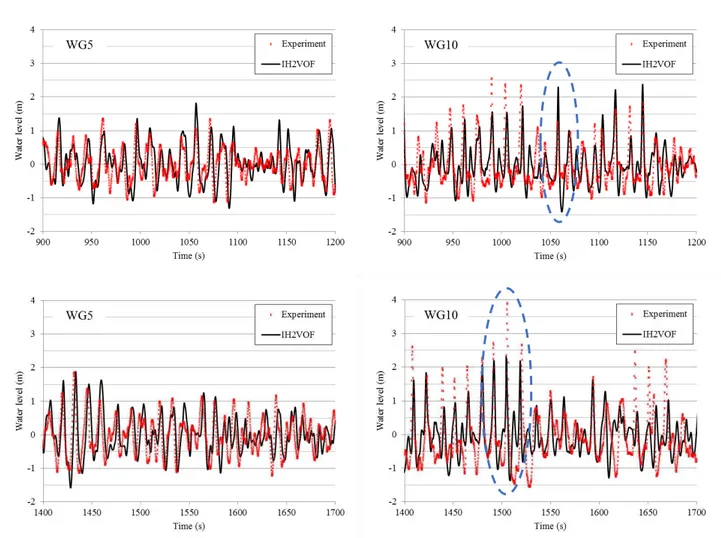
Every individual large wave in a wave series is important and should be accounted for in any realistic estimation of the total overtopping discharge volume. Therefore, the waves predicted by the numerical model have to be as close as possible to the measured ones in the physical model for a realistic simulation of overtopping. This also requires that all of the overtopping process be described in a time-domain rather than in the frequency-domain, even for irregular wave cases. Figure 5 compares the simulated water levels with the wave record measured at WG5 and WG10 (see Figure 3) for test T2B. The presented time period is a 300s segment of the 3600s simulation that includes a few of the highest waves of the entire incident wave.
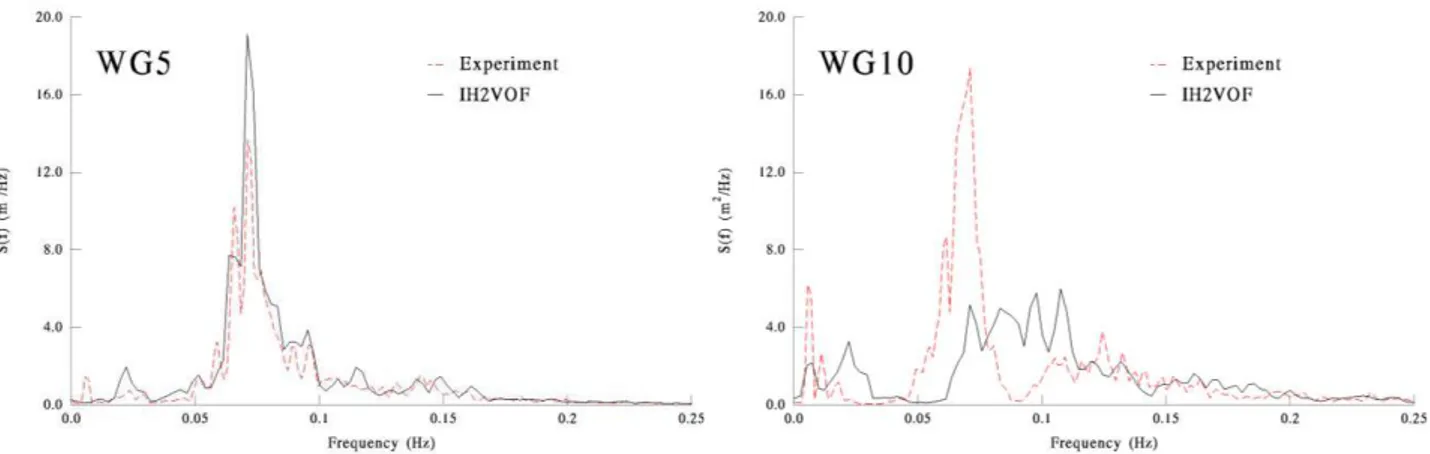
The model shows a reasonable performance in predicting the majority of wave heights, as well as the shape of the free surface elevation time history. Discrepancies are observed in the measured and modelled wave heights especially in the higher waves in the region close to the structure (e.g. WG10). Better agreement was observed between the measured and modelled free-surface elevations in an undisturbed calibration case (without the structure). Therefore, two reasons can be mentioned for the difference in the modelled and measured water levels. The first is inaccuracy in capturing the phase change in the reflected waves from the structure that can also be associated with unrealistic selection of the porous media properties such as porosity, and non-linear and linear friction coefficients. The other is failure in modelling higher-order non-linearity of the incident waves in shallow water. For example, see test case T2B wave signal between 1050s and 1100s (the wave spectrum at WG10 is also provided in Figure 6 for further analysis). Both the numerical and the physical models show transmission of the wave energy from the peak frequency to lower frequencies in shallow water. For test T2B, comparison of the measured and modelled wave spectrum at WG10 indicates that the model predicts about 50 percent lower wave energy around the peak frequency than the experiment. A greater concentration of the wave energy is also observed within the lower frequencies in the modelled wave spectrum. This suggests that the waves have been transformed from shorter waves to longer ones over their propagation in the shallow water in the model. Simulating more numerical waves with long periods can consequently result in greater predicted overtopping discharge by the numerical model. In test T3A, the modeled wave spectrum at WG10 shows a higher concentration of the wave energy for the higher frequencies. This is unlike the model prediction at WG10 in test T2B. Therefore for test T3A, smaller numerical estimation of the overtopping discharge is expected compared with that of the physical model.
Figure 5. Water surface elevation at WG5 and WG10; (top) test T2B, (bottom) test T3A.
According to the sensitivity analysis, the grid resolution and the aspect ratio had the greatest impact on the model results. In contrast to the β value which moderately impacted the model performance, the model did not show significant sensitivity to the values of cA and α. The effect of β on nonlinearity of the incident wave and phase change of
the reflected wave was not investigated in this study.
The measured spectra at WG5 and WG10 are quite similar between T2B and T3A with respect to the shape and the peak values. However, a significant difference is observed between the model behaviour especially at WG10, the closest gauge to the structure. Considering the identical values used for defining characteristics of the construction material in both cases (see Table 3), the great change in the model behaviour is attributed to the different interaction of the waves with the structures in the test cases. This is mainly due to the specific geometry and layout of the structure in each case.
Figure 6. Wave spectra at WG5 and WG10; (top) test T2B, (bottom) test T3A.
4.2 Overtopping
The incident wave height is the primary parameter that affects the overtopping process. For test T2B, comparison of the measured and modelled water level at WG10 implies that the model over-predicts the overtopping discharge between 1100s and 1200s. This is also confirmed by the cumulative overtopping graphs provided in Figure 7 that show a significant overtopping discharge between 1000s and 1200s in the numerical model. From, the wave spectrum at WG10 (see Figure 6) it can be inferred that the observed discrepancies may have been caused by the enclosure of more energy within lower frequencies of the incident wave signal. In other words, over-prediction of the overtopping discharge by the model can be attributed to an unrealistic increase in period of some incident wave modes throughout their propagation. For T3A, the IH2VOF predicted a significant smaller over-topping discharge compared with the physical model between 1500s and 1700s. Comparison of the wave heights at WG10 for the mentioned period also shows smaller waves calculated by the IH2VOF than the observations in the physical model.
The overtopping discharge value was found significantly influenced by the core porosity value. For instance, increasing the core porosity from 0.2 to 0.3 in test T2B decreased the overtopping discharge over-prediction from 40% to 20%. This implies that a better agreement between the measured and modelled overtopping discharge can be achieved by increasing the core porosity. For example, Losada et al. (2007) uses porosity value of 0.48 for a core with D50=0.01 m.
Figure 7. Cumulative overtopping volume per unit width; (left) T2B, (right) T3A.
In order to investigate the effect of turbulence models on the model performance, simulations were carried out using the k-ε turbulence models for the test case T2B. Less than a 5% difference in predicted average overtopping discharge was observed when the turbulence model was used, compared with the laminar case. The numerical simulations in this study were carried out with a laminar turbulence model.
The average overtopping discharge and the main wave characteristic parameters from the physical and the numerical models are provided in Table 4. Contrary behaviour of the model in predicting the over-topping process for two test cases in spite of its under-prediction for the Hm0, suggest that transformation of waves frequency have caused inconsistent prediction of the overtopping volume in the numerical model.
Table 4. Cumulative overtopping discharge per unit width and free surface elevation (Note: wave parameters @ WG10).
Test case Experiment IH2VOF
Hm0 (m) H1/3 (m) Tp (s) Qavg (m3/m/s) Hm0 (m) H1/3 Tp (s) Qavg (m3/m/s)
TS2B-4 2.53 2.73 14.5 0.037 2.42 2.34 14.7 0.046
TS3A-8 2.64 2.84 14.6 0.075 2.36 2.83 27.9 0.062
5 CONCLUSIONS
In this study, the skill of the IH2VOF CFD tool in predicting overtopping of rubblemound structures with complex geometries was investigated. The evaluation was conducted through modelling two different cross-section designs of a causeway revetment that were previously tested by NRC. For each case, the free-surface elevation was measured by a wave gauge located in deep water and was prescribed as the boundary condition for the numerical model. Sensitivity analysis was conducted through comparison between the measured and modelled free-surface elevation and overtopping discharge for various parameters such as the grid resolution, the core porosity, and the linear and non-linear friction coefficients in the porous media. The model showed reasonable performance in predicting the height and shape of the free-surface oscillations, especially in deep water. The predicted free-surface elevations by the model were negatively impacted by the reflected waves from the structure and the non-linearity imposed by the wave propagation in shallow water.
For both modelled cross-sections in this study, the average overtopping discharges predicted by the numerical model with 20% of accuracy compared to those measured in the physical model. Considering the complex geometry of the simulated cases and the high nonlinearity introduced into the waves over their propagation in the shallow water, the consistent results of the numerical model indicate that the tool had acceptable performance in simulating the overtopping process.
The structure geometry and the porosity value of the layers, particularly the core layer, played a significant role in simulating wave interaction within the structure, and consequently the overtopping prediction by the model. Further investigation is recommended to improve the available guidelines for choosing the appropriate porosity values for different layers. Understanding the impact of scaling on the model behavior and quantifying the accuracy of simulations at different model scales can greatly help modellers using the IH2VOF for different applications. This is suggested as a subject for future studies.
ACKNOWLEDGEMENTS
The authors would like to gratefully acknowledge an anonymous source for funding the physical model study, and the financial support of NRC’s Marine Infrastructure, Energy, and Water Resources research program. The authors also thank Paul Knox and Dan Pelletier with the National Research Council for their support.
REFERENCES
Aminti, P. & Franco, L. Wave overtopping on rubble mound breakwaters. XXI ICCE, 1988 Malaga.
Bradbury, A., P, & Allsop, N., W, H,. Hydraulic effects of breakwater crownwalls. ICE Conference BREAKWATERS'88, 1988 Eastbourne, T. Telford, London.
De Waal, J., P 1994. Wave overtopping of vertical coastal structures. Inlfluence of wave breaking and wind.: Delft Hydraulics Dogan, G., Guney,. 2016. Study of rubble mound and caisson type breakwaters by experimental and numerical modelling under
extreme waves. MASTER OF SCIENCE, Middle East Technical University.
Franco, L. 1994. Further results of hydraulic model tests on wave overtopping. MAST2-MCS, 2'workshop. Milano.
Garcia, N., Lara, J. L. & Losada, I. J. 2004. 2-D numerical analysis of near-field flow at low-crested permeable breakwaters. Coastal
Engineering, 51, 991-1020.
Goda, Y. 1985. Random seas and design of maritime structures. University of Tokyo Press.
Guanche, R., Losada, I. J. & Lara, J. L. 2009. Numerical analysis of wave loads for coastal structure stability. Coastal Engineering, 56, 543-558.
Hebsgaard, M., Sloth, P. & Juhl, J. 2001. WAVE OVERTOPPING OF RUBBLE MOUND BREAKWATERS. Coastal Engineering
Proceedings.
Hirt, C. W. & Nichols, B. D. 1981. Volume of fluid (VOF) method for the dynamics of free boundaries. Journal of Computational
Physics, 39, 201-225.
Hsu, T.-J., Sakakiyama, T. & LIU, P. L. F. 2002. A numerical model for wave motions and turbulence flows in front of a composite breakwater. Coastal Engineering, 46, 25-50.
Jensen, O., J, & Juhl, J. Wave overtopping on breakwaters and sea dikes. Second COPEDEC Conference, 1987 Beijing. Lara, J. & Maza, M. 2016. IH-2VOF Course Lecture Notes. In: IH-CANTABRIA (ed.). Cantabria, Spain.
Lara, J. L., Garcia, N. & Losada, I. J. 2006. RANS modelling applied to random wave interaction with submerged permeable structures. Coastal Engineering, 53, 395-417.
Losada, I. J., Lara, J. L., Guanche, R. & Gonzalez-Ondina, J. M. 2007. Numerical analysis of wave overtopping of rubble mound breakwaters. Coastal Engineering, 55, 47-62.
Madsen, O. & White, S. 1976. Reflection and transmission characteristics of porous rubble-mound breakwaters US Army Corps of Engineers.
Mellink, B. 2012. Numerical and experimental research of wave interaction with a porous breakwater. MSc, Delft University of Technology.
Van Den Bos, J., P, Verhagen, H., J, Zijlema, M. & Mellink, B. Towards a practical application of numerical models to predict wave-structure interaction: an initial velidation. Proceedings of 34th International Conference on Coastal Engineering, 2014 Seoul, Korea
Van Der Neut, E., M. 2015. Analysis of the notional permeability of rubble mound breakwaters by means of a VOFmodel. Master of Science, Delft