(will be inserted by the editor)
Studies of the performance of the ATLAS detector using
cosmic-ray muons
The ATLAS Collaboration
September 10, 2018
Abstract. Muons from cosmic-ray interactions in the atmosphere provide a high-statistics source of particles that can be used to study the performance and calibration of the ATLAS detector. Cosmic-ray muons can penetrate to the cavern and deposit energy in all detector subsystems. Such events have played an important role in the commissioning of the detector since the start of the installation phase in 2005 and were particularly important for understanding the detector performance in the time prior to the arrival of the first LHC beams. Global cosmic-ray runs were undertaken in both 2008 and 2009 and these data have been used through to the early phases of collision data-taking as a tool for calibration, alignment and detector monitoring. These large datasets have also been used for detector performance studies, including investigations that rely on the combined performance of different subsystems. This paper presents the results of performance studies related to combined tracking, lepton identification and the reconstruction of jets and missing transverse energy. Results are compared to expectations based on a cosmic-ray event generator and a full simulation of the detector response.
1 Introduction
The ATLAS detector [1] was constructed to provide excellent physics performance in the difficult environment of the Large Hadron Collider (LHC) at CERN [2], which will collide pro-tons at center-of-mass energies up to 14 TeV, with unprece-dented luminosity. It is designed to be sensitive to any ex-perimental signature that might be associated with physics at this new high-energy frontier. This includes precision measure-ments of high pTleptons and jets, as well as large
transverse-energy imbalances attributable to the production of massive weakly interacting particles. Such particles are predicted in nu-merous theories of physics beyond the Standard Model, for ex-ample those invoking weak-scale supersymmetry or the exis-tence of large extra dimensions.
Prior to the start of data-taking, understanding of the ex-pected performance of individual subsystems relied on beam test results and on detailed GEANT4 [3, 4] simulations [5], in-cluding the modeling of inactive material both in the detector components and in the detector services and support structure. While extensive beam testing provided a great deal of informa-tion about the performance of the individual detector subsys-tems, a detailed understanding of the full detector could only be achieved after the system was in place and physics signals could be used for performance studies and for validation or tun-ing of the simulation.
In both 2008 and 2009 the ATLAS detector collected large samples of cosmic-ray events. These extended periods of op-eration allowed for the training of shift crews, the exercising of the trigger and data acquisition systems as well as of other infrastructure such as the data-handling system, reconstruction software, and tools for hardware and data-quality monitoring. The large data samples accumulated have also been used for a
number of commissioning studies. Because cosmic-ray muons interact with the detector mainly as minimum-ionizing parti-cles (MIPs), most traverse all of the subdetectors along their flight path. So, in addition to subdetector-specific cosmic-ray studies, these cosmic-ray data samples provide the first oppor-tunity to study the combined performance of different detec-tor components. Subsystem-specific cosmic-ray commission-ing results have been documented in a series of separate pub-lications [6–9]. This paper presents the results of studies rel-evant to combined tracking performance, lepton identification and calorimeter performance for the reconstruction of jets and missing transverse energy. Where simulation results are avail-able, results are compared to expectations based on a dedicated cosmic-ray event generator, implemented in the detector simu-lation.
2 The ATLAS detector
The ATLAS detector is described in detail elsewhere [1] and illustrated in Figure 1. ATLAS uses a right-handed coordinate system with its origin at the nominal interaction point (IP). The beam direction defines the z-axis, the positive x-axis points from the IP towards the center of the LHC ring and the positive y-axis points upwards. Cylindrical coordinates (r,φ ) are used in the transverse plane and the pseudorapidity η is defined in terms of the polar angle θ as η = −ln tan(θ /2).
The ATLAS detector is made up of a barrel region and two endcaps, with each region consisting of several detector sub-systems. Closest to the interaction point is the Inner Detec-tor (ID), which performs charged particle tracking out to |η| of 2.5. It consists of two silicon detectors – the Pixel Detec-tor and the SemiConducDetec-tor Tracker (SCT) – and the Transition
Fig. 1. The ATLAS detector and subsystems.
Radiation Tracker (TRT), all immersed in a 2T axial magnetic field provided by a superconducting solenoid magnet. The TRT is based on individual drift tubes with radiators, which pro-vide for electron identification. The ID is surrounded by bar-rel and endcap liquid argon electromagnetic (EM) calorime-ters which provide coverage out to |η| of 3.1. These, in turn, are surrounded by hadronic calorimeters. In the barrel region, the Tile Calorimeter is composed of steel and scintillating tiles, with a central barrel and two extended-barrel regions providing coverage out to |η| of 1.7. In the endcap region the Hadronic Endcap Calorimeter (HEC) is based on liquid argon and cov-ers the region 1.5 < |η| < 3.2. The calorimetric coverage is extended into the region 3.2 < |η| < 4.9 by a liquid argon For-ward Calorimeter (FCal) which occupies the same cryostat as the endcap EM calorimeter and the HEC. Beyond the calorime-ter system is the Muon Spectromecalorime-ter (MS), which relies on a set of massive superconducting air-core toroid magnets to pro-duce a toroidal magnetic field in the barrel and endcap regions. In both regions, planes of interleaved muon detectors provide tracking coverage out to |η| of 2.7 and triggering to |η| of 2.4. The tracking studies presented in this paper are restricted to the barrel region of the detector, where precision measurements of the (r, z) hit coordinates are provided by the Monitored Drift Tube (MDT) system. The remaining φ coordinate is measured by the Resistive Plate Chambers, or RPCs, which are primarily used for triggering.
ATLAS employs a three-level trigger system, with the Level-1 (L1) trigger relying primarily on information from the Muon and Calorimeter systems. For cosmic-ray running there was additionally a TRT-based trigger at L1 [10]. There is also a trigger based on signals from scintillators mounted in the end-cap region, which are intended for triggering of collision events during the initial low-luminosity data-taking. This, however, plays no significant role in the triggering of cosmic-ray events. For the MS, the triggering in the barrel region of the detector is based on hits in the RPCs; in the endcap region, the Thin Gap Chambers (TGCs) are used. The L1 Calorimeter trigger (L1Calo) is based on analog sums provided directly from the calorimeter front-end readout, from collections of calorimeter cells forming roughly projective trigger towers. In each case, the L1 trigger identifies a region of interest (ROI) and informa-tion from this ROI is transmitted to L2. In normal operainforma-tion, events accepted by the L2 trigger are sent to the Event Filter which performs the L3 triggering, based on full event recon-struction with algorithms similar to those used offline. The L2 and L3 trigger systems are jointly referred to as the High Level Trigger, or HLT. For the cosmic-ray data taking, events were triggered only at L1. Information from the HLT was used only to split the data into different samples.
Fig. 2. The ATLAS detector in the experimental cavern. Above the cavern are the two access shafts used for the detector installation.
2.1 Tracking in ATLAS
The two tracking systems, the ID and the MS, provide preci-sion measurements of charged particle tracks. Reconstructed tracks are characterized by a set of parameters (d0, z0, φ0, θ0,
q/p) defined at the perigee, the point of closest approach of the track to the z-axis. The parameters d0and z0are the transverse
and longitudinal coordinates of the perigee, φ0and θ0are the
azimuthal and polar angles of the track at this point, and q/p is the inverse momentum signed by the track charge. Analyses typically employ track quality cuts on the number of hits in a given tracking subsystem. The track reconstruction algorithms account for the possibility of energy loss and multiple scatter-ing both in the material of the trackscatter-ing detector itself, and in the material located between the tracking system and the particle production point. For the combined tracking of muons, which reconstructs the particle trajectories through both the ID and the MS, this requires an accurate modeling of the energy losses in the calorimeter. This will be discussed in section 4.2.
3 Cosmic-ray events in ATLAS
Cosmic rays in ATLAS come mostly from above, and arrive mainly via two large access shafts used for the detector instal-lation, as illustrated in Figure 2.
In proton-proton collisions, the actual beam-spot position varies from the nominal IP by distances that are of order mm in the transverse plane and cm along the beam direction. Tracks produced in proton-proton collisions at the IP are said to be projective, that is, emanating from (or near, in the case of particles arising from secondary vertices) the IP. Cosmic-ray muons passing through the volume of the detector do not nor-mally mimic such a trajectory. However, in a large sample of events, some do pass close to the center of the detector. By placing requirements on track impact parameters with respect to the nominal IP, it is possible to select a sample of approx-imately projective muons from those passing through the bar-rel region of the detector. Such cosmic-ray muons are referred
to below as pseudo-projective. Due to the typical downward trajectory of the incoming cosmic-ray muons this cannot be done for those passing through the endcap region. For that reason, for those analyses presented here that rely on track-ing, there is a requirement that the muons pass through the Inner Detector, which occupies a volume extending to about 1.15 m in radius and ±2.7 m in z. The rate of such cosmic-ray muons is of order several Hz. Most analyses further re-strict the acceptance to the barrel region of the ID, which has a smaller extent, in z, of ±71.2 cm. Some analyses addition-ally place requirements on the presence of hits in the SCT or Pixel detectors, further restricting the volume around the nom-inal IP through which the cosmic-ray muons are required to pass. Track-based event selection criteria are not applied in the case of the jet and missing transverse energy studies presented in section 5, which focus on the identification of fake missing transverse energy due to cosmic-ray events or to cosmic-ray in-teractions that overlap with triggered events. While calorime-ter cells are approximately projective towards the IP1, energy deposits in the calorimeter can come from muons that pass through the calorimeter at any angle, including, for example, the highly non-projective up-down trajectory typical of cos-mic muons passing through the endcap. While muons usually traverse the detector as MIPs, leaving only small energy de-posits along their paths, in rare events they leave a larger frac-tion of energy in the detector, particularly in the case of energy losses via bremsstrahlung. These can be particularly important in the case of high-energy muons, which can lose a significant amount of energy between the two tracking detectors. Such events have been previously exploited for pulse shape studies of the LAr calorimeter and as a source of photons used to val-idate the photon-identification capabilities of the ATLAS EM calorimeter [7, 11].
The reconstruction of cosmic-ray events is also compli-cated by the fact that they occur at random times with respect to the 40 MHz readout clock, which is synchronized to the LHC clock during normal operation. For each subsystem, re-construction of these events therefore first requires some mea-sure of the event time with respect to the readout clock. An added complication, particularly for tracking, is that in the up-per half of the detector, cosmic-ray muons travel from the out-side in, rather than from the inout-side out, as would be the case for collisions. These differences can be addressed in the event re-construction and data analysis. The modifications required for reconstruction of these events in the different detector compo-nents are discussed in the subsystem-specific cosmic-ray com-missioning papers [6–9].
3.1 Data samples
ATLAS recorded data from global cosmic-ray runs during two extended periods, one in the fall of 2008 and another in the summer and fall of 2009. The analyses presented in this paper are each based on particular subsets of the available data.
For studies involving only the calorimeter, events triggered by L1Calo are used. Studies relying on tracking require that
1 This is not the case for the FCal, which covers 3.2 < |η| < 4.9,
both the MS and ID were operational, and that the associated toroidal and solenoid fields both were at nominal strength. All L1-triggered events taken under those conditions were checked for the presence of a track in the ID. Events with at least one such track were streamed by the HLT to what is referred to here as the Pseudo-projective Cosmic-ray Muon (PCM) dataset, which forms the basic event sample for all of the studies pre-sented in section 4. These events are mainly triggered at L1 by the RPCs. Hundreds of millions of cosmic-ray events were recorded during the 2008 and 2009 cosmic-ray runs. How-ever, the requirement of a track in the Inner Detector reduces the available statistics dramatically, as does the requirement of nominal magnetic field strengths for the MS and ID, which is necessary for studies of the nominal tracking performance.
3.2 Cosmic-ray event simulation
Cosmic-ray events in ATLAS are simulated using a dedicated event generator and the standard GEANT4 detector simulation, with the modeling of the readout electronics adapted to ac-count for the difference in timing. The simulation includes the cavern overburden, the layout of the access shafts and an ap-proximation of the material of the surface buildings. The event generator is based on flux calculations in reference [12] and uses a standard cosmic-muon momentum spectrum [13]. Sin-gle muons are generated near ground level, above the cavern in a 600 m × 600 m region centered above the detector, with angles up to 70◦from vertical. Muons pointing to the cavern volume are propagated through up to 100 m of rock overbur-den, using GEANT4. Measurements of the cosmic-ray flux at different positions in the cavern were used to validate the pre-dictions of this simulation. Once a muon has been propagated to the cavern, additional filters are applied; only events with at least one hit in a given volume of the detector are retained, depending on the desired event sample. Note that only single-muon cosmic-ray events are simulated. No attempt is made to model events in which cosmic-ray interactions produce an air shower that can deposit large amounts of energy in the detector. However, the rate of such events (in data) has been shown to be sufficiently low that they do not produce significant discrepan-cies in, for example, the agreement between data and Monte Carlo (MC) for the distribution of the summed transverse en-ergy in cosmic-ray events [14].
4 Lepton identification and reconstruction
studies using cosmic-ray events
Cosmic-ray muons are an important tool for the commissioning of the muon spectrometer, which is the largest ATLAS subsys-tem, occupying over 95% of the total detector volume. As the rate of production of high-pTmuons in collision events is rather
low, the cosmic-ray data will continue to be relevant to the MS commissioning for some time to come. ATLAS continues to record data from cosmic-ray interactions when LHC beams are not present.
While the cosmic rays are primarily a source of muons, analysis of these data also allows for checks of the algorithms
used to identify other leptons. The cosmic-ray muons serve as a source of electrons, mainly δ -electrons but with smaller contri-butions from the conversion of muon bremsstrahlung photons and muon decays in flight. The identification of a sample of electrons allowed for an examination of the performance of the electron identification algorithms, prior to first collisions. Simi-larly, although no τ-leptons are expected in the cosmic-ray data sample, the tools designed for τ-identification have been exer-cised using these data and checked against the simulation.
The analyses discussed in this section rely on the PCM dataset described earlier, which contains cosmic-ray muon events with tracks reconstructed in the ID. Most analyses also require the presence of hits in the Pixel Detector. These differ slightly for different analyses, as will be described below.
4.1 Combined muon tracking performance
This section describes studies of the performance of the com-bined tracking for muons, using cosmic-ray data recorded in 2009. The investigation uses the PCM dataset in order to have tracks that resemble, as much as possible, tracks from collision data. Selected events are required to have a topology consistent with that expected for the passage of cosmic-ray muon through the detector, which is illustrated by a typical event in Figure 3. The requirements are:
– exactly 1 track reconstructed in the ID
Fig. 3. Event display of a cosmic-ray muon crossing the entire ATLAS detector, close to the nominal IP, leaving hits in all tracking subsys-tems and significant energy deposits in the calorimeter. The upper left view shows the projection into the rφ plane. The lower plot shows the projection in the rz plane. The upper right projection is a longitudinal slice through the central part of the Muon Spectrometer at the φ value of the MDT planes in which the muon hits were recorded.
– 1 or 2 tracks reconstructed in the MS
– exactly 1 combined track crossing both subdetectors A special ID pattern recognition algorithm was used to recon-struct cosmic-ray muons as a single tracks. Because of the topology of these events, the analysis is restricted to the bar-rel region of the detector. Good quality ID and MS tracks are ensured using requirements on the number of hits in the dif-ferent subsystems. Events are required to have been triggered by the RPC chambers, since these also provide measurements along the φ coordinate (φ hits), which is not measured by the MDTs. Following the procedure used in the ID commissioning with cosmic-ray muons [6], a requirement is also placed on the timing from the TRT, to ensure that the event was triggered in a good ID time window.
The track parameter resolutions for Combined Muon (CM) tracks have been investigated in the same manner as used for similar studies of the ID [6] and MS [9] performance, by com-paring the two reconstructed tracks left by a single cosmic-ray muon passing through the upper and then the lower half of the detector. In the case of the ID and combined tracks, this in-volves separately fitting the hits in these two regions, to form what are referred to below as “split tracks” from the track cre-ated by the passage of a single muon.
Prior to a study of combined tracking, it is necessary to establish that the relative alignment of the two tracking sys-tems is adequate. Checks were performed by comparing the track parameters for standalone tracks reconstructed by the two separate tracking systems, in the upper and lower halves of ATLAS. Tracks in the MS were reconstructed using a least-squares method that directly incorporates the effects of the ma-terial that sits between the MS detector planes and the point at which the track parameters are defined [15]. ID tracking was also performed by standard tracking algorithms [16, 17].
The alignment check relies on the study of three different classes of tracks: split ID tracks, MS standalone tracks, and split CM tracks. In what follows these will be referred to sim-ply as ID, MS and CM tracks, respectively. Different quality cuts are placed on the three track types. For ID and CM tracks |d0| and |z0| are required to be less than 400 mm and 500 mm
re-spectively. For MS tracks, for which these parameters must be extrapolated from the MS back to the perigee, the requirements are |d0| < 1000 mm and |z0| < 2000 mm. ID and CM tracks are
required to have at least 1, 6 and 20 hits in the Pixel, SCT and TRT detectors, respectively. MS and CM tracks are required to have hits in all three MS layers, with more than four RPC hits, at least two of which are φ hits, and a χ2per degree of freedom less than 3. All tracks are required to have momentum larger than 5 GeV.
Figure 4 shows the correlation between the φ0and θ0
pa-rameters determined from MS and ID tracks in the bottom half of ATLAS. Very good consistency is evident and similar results are obtained in the other hemisphere. The level of agreement between the two systems is better quantified by distributions of the difference between the track parameters obtained from the two systems. These are shown in Figure 5 for d0, z0, φ0and θ0,
separately for tracks in the upper and lower halves of the de-tector. The somewhat narrower distributions obtained from the upper half of the detector are attributed to the higher average momentum of the cosmic-ray muons in this part of the
detec-Parameter Mean Resolution
φ0(mrad) -0.053 ± 0.005 0.164± 0.004
θ0(mrad) 0.27 ± 0.03 0.80 ± 0.02
d0(µm) -0.9 ±0.7 26.8 ± 0.8
z0(µm) 2.0 ± 3.7 116.6 ± 2.9
Table 1. Overview of the track parameter bias and resolution for CM tracks obtained with the track-splitting method for 2009 cosmic-ray data, for tracks with pT> 30 GeV.
tor, since those in the bottom have lost energy passing through the lower half of the calorimeter before reaching the MS. Small biases are observed for the d0 and φ0 parameters. These are
consistent with a slight translational misalignment between the MS and ID that is of order 1 mm. However, the combined track-ing study presented below was performed without any relative ID-MS alignment corrections.
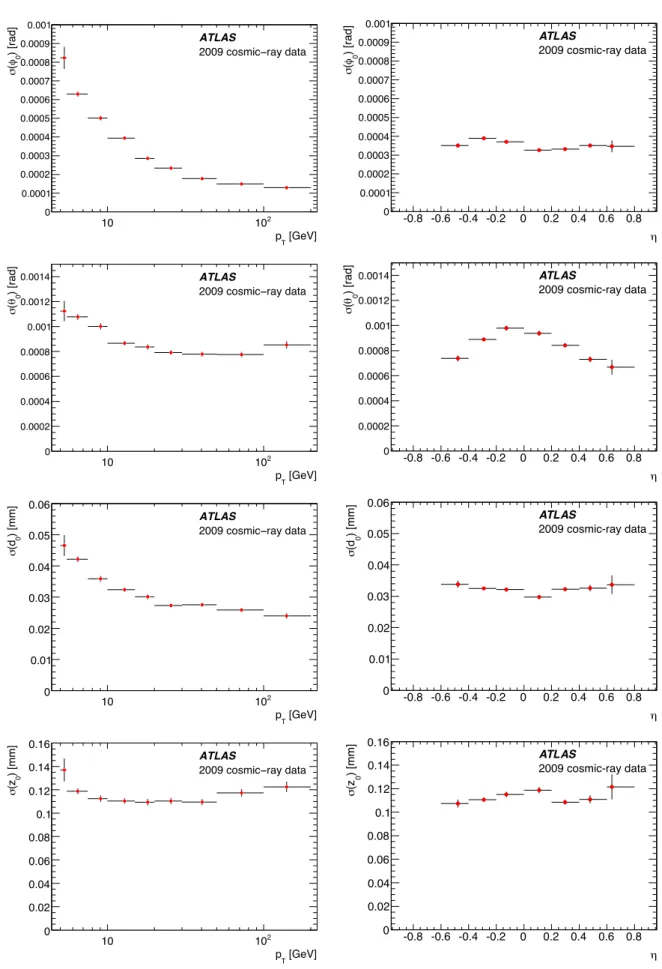
The track parameter resolutions for combined tracking have been investigated in the manner discussed above, using CM tracks passing through the barrel part of the detector, which are split into separate tracks in the upper and lower halves. The two resulting tracks are then fitted using the same combined track fit procedure. For studies of the angular and impact parameter resolution, the track quality cuts are tightened somewhat, with the requirements of at least two pixel hits, |d0| < 100 mm and
|z0| < 400 mm. An estimate of the resolution on each track
pa-rameter, λ , is obtained from the corresponding distribution of the difference in the track parameters obtained from the two split tracks, ∆ λ = λup− λlow. Each such distribution has an
expectation value of 0 and a variance equal to two times the square of the parameter resolution: var(∆ λ ) = 2σ2(λ ). For each parameter, the mean and resolution of this difference dis-tribution have been studied in bins of pT and η. Since the
cosmic-ray muon momentum distribution is a steeply falling function, the pT value for each bin is taken as the mean of
the pTdistribution in that bin. For the resolutions, the results
are shown in Figure 6. The means are roughly independent of pTand η and show no significant bias, with the exception of
the z0distribution. That shows a small bias that varies with η,
but with a magnitude that is less than about 60 µm over the η-range investigated. This is negligible relative to the MS-ID bias already discussed. The means and resolutions obtained from tracks with pT> 30 GeV are shown in Table 1.
A similar study of the track momentum reconstructed in the upper and lower halves of the detector shows that the mean of the momentum-difference distribution (pup− plow) is
consis-tent with zero and flat as a function of pTand η. For studies
of the pTresolution, slightly looser cuts are employed in order
to increase the statistics, particularly in the high-momentum region. For tracks having momenta above 50 GeV the require-ment of a pixel hit is removed and the cuts on |d0| and |z0| are
loosened to 1000 mm. Figure 7 shows the relative pTresolution
for ID, MS and CM tracks as a function of pT. For each pair
of upper / lower tracks, the value of the transverse momentum was evaluated at the perigee. The difference between the values obtained from the upper and lower parts of the detector, divided
(Inner detector) [rad]
0
q
-3 -2.5 -2 -1.5 -1 -0.5 0
(Muon spectrometer) [rad] 0
q -3 -2.5 -2 -1.5 -1 -0.5 0 2009 cosmic-ray data ATLAS
(Inner detector) [rad]
0
e
0 0.5 1 1.5 2 2.5
(Muon spectrometer) [rad]0
e 0 0.5 1 1.5 2 2.5 2009 cosmic-ray data ATLAS
Fig. 4. Correlations between the track parameters φ0and θ0obtained from standalone ID and MS tracks, in the bottom half of ATLAS.
(ID) [mm] 0 (MS) - d 0 d -400 -300 -200 -100 0 100 200 300 400 normalized rate 0.02 0.04 0.06 0.08 0.1 0.12 0.14 0.16 0.18 Top MS-ID Bottom MS-ID 2009 cosmic-ray data ATLAS (ID) [mm] 0 (MS) - z 0 z -200 -150 -100 -50 0 50 100 150 200 normalized rate 0.01 0.02 0.03 0.04 0.05 0.06 0.07 0.08 0.09 0.1 Top MS-ID Bottom MS-ID 2009 cosmic-ray data ATLAS (ID) [rad] 0 q (MS) - 0 q -0.05 -0.04 -0.03 -0.02 -0.01 0 0.01 0.02 0.03 0.04 0.05 normalized rate 0.01 0.02 0.03 0.04 0.05 0.06 0.07 0.08 0.09 0.1 Top MS-ID Bottom MS-ID 2009 cosmic-ray data ATLAS (ID) [rad] 0 e (MS) - 0 e -0.05 -0.04 -0.03 -0.02 -0.01 0 0.01 0.02 0.03 0.04 0.05 normalized rate 0.02 0.04 0.06 0.08 0.1 0.12 0.14 0.16 Top MS-ID Bottom MS-ID 2009 cosmic-ray data ATLAS
Fig. 5. Difference distributions of the track parameters, d0, z0, φ0and θ0obtained from standalone ID and MS tracks, for the top and bottom
[GeV] T p 10 102 ) [rad] 0 q( m 0 0.0001 0.0002 0.0003 0.0004 0.0005 0.0006 0.0007 0.0008 0.0009 0.001 2009 cosmicïray data ATLAS d -0.8 -0.6 -0.4 -0.2 0 0.2 0.4 0.6 0.8 ) [rad] 0 q( m 0 0.0001 0.0002 0.0003 0.0004 0.0005 0.0006 0.0007 0.0008 0.0009 0.001 2009 cosmic-ray data ATLAS [GeV] T p 10 102 ) [rad] 0 e( m 0 0.0002 0.0004 0.0006 0.0008 0.001 0.0012 0.0014 2009 cosmicïray data ATLAS d -0.8 -0.6 -0.4 -0.2 0 0.2 0.4 0.6 0.8 ) [rad] 0 e( m 0 0.0002 0.0004 0.0006 0.0008 0.001 0.0012 0.0014 2009 cosmic-ray data ATLAS [GeV] T p 10 102 ) [mm] 0 (d m 0 0.01 0.02 0.03 0.04 0.05 0.06 2009 cosmicïray data ATLAS d -0.8 -0.6 -0.4 -0.2 0 0.2 0.4 0.6 0.8 ) [mm] 0 (d m 0 0.01 0.02 0.03 0.04 0.05 0.06 2009 cosmic-ray data ATLAS [GeV] T p 10 102 ) [mm] 0 (z m 0 0.02 0.04 0.06 0.08 0.1 0.12 0.14 0.16 2009 cosmicïray data ATLAS d -0.8 -0.6 -0.4 -0.2 0 0.2 0.4 0.6 0.8 ) [mm] 0 (z m 0 0.02 0.04 0.06 0.08 0.1 0.12 0.14 0.16 2009 cosmic-ray data ATLAS
Fitted Resolution P1 P2
Inner Detector 1.6 ± 0.1 % (53 ± 2) × 10−5GeV−1 Muon Spectrometer 3.8 ± 0.1 % (20 ± 3) × 10−5GeV−1 Combined Muon 1.6 ± 0.1 % (23 ± 3) × 10−5GeV−1 Table 2. Fitted values of the multiple scattering and intrinsic momen-tum resolution terms (as described in the text) for ID, MS and CM tracks. by their average ∆ pT pT = 2 pTup− pT down pTup+ pT down
was measured and plotted in eleven bins of pT. As above, the
plotted pTvalue is the mean of the pTdistribution in that bin.
The results of this procedure have been fitted to parametriza-tions appropriate to each particular track class. For the ID the fit function was:
σpT pT
= P1 ⊕ P2× pT
where P1is related to the multiple scattering term and P2to the
ID intrinsic resolution. For the MS tracks, the same function is used but with an additional term (coefficient P0) related to
uncertainties on the energy loss corrections associated with the extrapolation of the MS track parameters to the perigee:
σpT pT
= P0 pT
⊕ P1 ⊕ P2× pT.
For the combined resolution a more complex function is needed: σpT pT = P1 ⊕ P0× pT p 1 + ( P3× pT)2 ⊕ P2× pT
where P1 is related to the multiple scattering term, P2 to the
intrinsic resolution at very high momentum and the P3 term
describes the intermediate region where ID and MS resolutions are comparable.
Table 2 compares the fitted sizes of the multiple scattering and intrinsic resolution terms for the ID, MS and CM tracks. For the CM tracks the multiple scattering term is determined mainly by the ID contribution while the intrinsic high-energy resolution comes mainly from the MS measurement.
Extrapolation of the fit result yields an ID momentum res-olution of about 1.6% at low momenta and of about 50% at 1 TeV. The MS standalone results are improved over those previ-ously obtained [9]: the resolution extrapolated to 1 TeV is about 20%. As expected the ID and MS systems dominate the resolu-tion at low and high pT, respectively. However, at intermediate
momenta from about 50 to 150 GeV both systems are required for the best resolution. The ±1σ region returned by the fit to the resolution for the CM tracks is shown as the shaded region in Figure 7.
4.2 Muon energy loss in the ATLAS calorimeters Muons traverse more than 100 radiation lengths between the two tracking systems. Interactions with the calorimeter mate-rial result in energy losses. These losses are typically around
[GeV] T p 10 102 103 T )/p T (p m 0 0.02 0.04 0.06 0.08 0.1 0.12 0.14 0.16 0.18 0.2 Muon Spectrometer Inner Detector Combined Muon area m Combined Muon fit 1
ATLAS
2009 cosmic-ray data
Fig. 7. Resolution on relative pT as a function of pTfor ID and MS
standalone tracks, and for CM tracks. The shaded region shows the ±1σ region of the fit to the resolution curve for the CM tracks.
3 GeV, mainly due to ionization, but are subject to fluctuations, especially for high momentum muons which can deposit a large fraction of their energy via bremsstrahlung. Muon reconstruc-tion in collision events depends on a correct accounting for these losses, as does determination of the missing transverse energy in the event. A parametrization of these losses is nor-mally used for extrapolating the track parameters measured by the MS to the perigee where they are defined. However, since 80% of the material between the trackers is instrumented by the calorimeters, studies of the associated energy deposits in the calorimeter should allow improvements to the resolution in the case of large losses.
This possibility has been investigated using cosmic-ray muons traversing the barrel part of ATLAS. The analysis is based on the PCM sample from a single 2009 cosmic-ray run, consisting of about one million events. Strict criteria were ap-plied to ensure pseudo-projective trajectories that are well mea-sured in the relevant tracking subsystems: the SCT and the TRT in the Inner Detector, and the MDT and RPC systems in the Muon Spectrometer. The analysis was restricted to tracks crossing the bottom part of the Tile Calorimeter, in the region |η| < 0.65. A track-based algorithm [18–20] was used to col-lect the muon energy deposits in the calorimeters. The trajec-tory of the particle was followed using the ATLAS extrapola-tor [21], which, using the ATLAS tracking geometry [22], takes into account the magnetic field, as well as material effects, to define the position at which the muon crossed each calorimeter layer. The cells within a predefined ‘core’ region around these points were used for the measurement of the energy loss. This region was optimized according to the granularity and the ge-ometry of each calorimeter layer. Only cells with |E| > 2σnoise
were considered. Here σnoise is the electronics noise for the
channel and |E| is used instead of E to avoid biases. As a check that this procedure properly reconstructs the muon energy de-posits, the total transverse energies reconstructed in calorime-ter cells within cones of ∆ R =p(∆η)2+ (∆ φ )2 of 0.2, 0.3
and 0.4, around the particle trajectory, were determined. From these, the sum of the transverse energy inside the core region
(ETcore) was subtracted. In collision events these quantities can be used to define the muon isolation, while in this analysis they indicate how much energy is deposited outside the core. The distributions of these quantities, shown in the top plot of Fig-ure 8, are reasonably centered around zero with widths that in-crease with the cone size, as expected due to the inclusion of a larger number of cells. Small energy losses outside the Ecore
T
region shift the distributions to slightly positive values, due to either uncertainties in the extrapolation process or to radiative losses.
As a measure of the energy deposited by the muon, Ecore T
is used with no additional correction. Monte Carlo simulations of single muons in the barrel region show that this method pro-vides a nearly unbiased energy determination, with 2% scale uncertainty and 11% resolution for the energy deposited by 100 GeV muons. To allow comparison of these losses with the difference between the momenta reconstructed in the two tracking systems, a parametrization of the losses in the dead (uninstrumented) material, Edead, is added to the calorimeter
measurement. The tracking geometry provides this information in combination with the extrapolator. The energy measured in the calorimeter, corrected for the dead material, is compared with the momentum difference between Inner Detector and Muon Spectrometer tracks in the middle plot of Figure 8. The mean values of the momentum-difference and energy-sum dis-tributions are 3.043 GeV and 3.044 GeV respectively. The typi-cal momentum of the selected tracks is 16 (13) GeV in the Inner Detector (Muon Spectrometer), measured (see Figure 7) with a resolution of about 2% (4%), while the energy collected in the calorimeters, Ecalo, is on average 2.4 GeV, with a precision of about 10-20%. The RMS values of the two distributions are 1.081 GeV and 0.850 GeV respectively. In simulation the two distributions have means of 3.10 GeV and 3.12 GeV compared to a true energy loss distribution with a mean of 3.11 GeV and an RMS of 0.750 GeV. The resolutions were 0.950 GeV and 0.820 GeV, respectively, roughly consistent with the measured values. The bottom plot in figure 8 shows the distribution of (PID− PMS) − (Ecalo+ Edead), which has a mean of -0.012 GeV
and an RMS of 1.4 GeV. This distribution is dominated by contributions from rather low-momentum tracks. Restricting to the momentum region of 10-25 GeV retains about 40% of the statistics and yields a distribution with mean and RMS of -0.004 GeV and 1.0 GeV respectively.
Although the tracking systems are relatively more precise than the calorimeters, in both data and Monte Carlo simulation, the RMS of the energy-sum distribution from the calorimeter is smaller than that of the momentum-difference distribution from the tracking systems. Use of the calorimeter information may therefore allow future improvements to the combined tracking for muons.
4.3 Identification of electrons
The identification of electrons is performed by algorithms re-lying on information from both the EM calorimeter and the ID. Two methods are used, one seeded by tracks and the other by EM calorimeter clusters. The cluster-based algorithm is the standard identification tool, with clusters seeded using a sliding-window algorithm [23]. This algorithm, used only for
(GeV) T Sum E -3 -2 -1 0 1 2 3 Entries / (0.2 GeV) 0 200 400 600 800 1000 R < 0.2 6 R < 0.3 6 R < 0.4 6 ATLAS 2009 cosmic-ray data E (GeV) -2 0 2 4 6 8 10 Entries / (0.2 GeV) 0 200 400 600 800 MS - P ID P dead + E calo E ATLAS 2009 cosmic-ray data (GeV) calo + dead - E ID - MS P 6 -5 -4 -3 -2 -1 0 1 2 3 4 5 Entries / (0.2 GeV) 200 400 600 800 1000 ATLAS 2009 cosmic-ray data
Fig. 8. The upper plot shows the sum of the transverse energy around muon tracks, outside the core region, for cones of ∆ R = 0.2, 0.3 and 0.4. The middle plot compares the momentum difference between Inner Detector and Muon Spectrometer tracks (PID− PMS) with the
sum of the energy loss measured in the calorimeters, Ecalo, and the
parametrized energy loss in the inert material, Edead. The lower plot
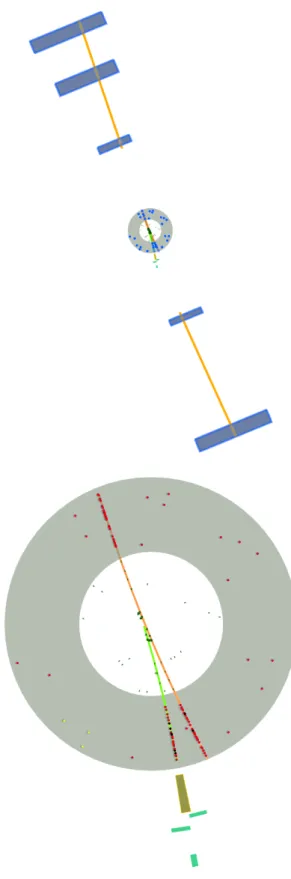
Fig. 9. Event display of a typical δ -electron candidate event. The up-per figure shows a view that includes the three layers of muon detec-tors on either side, while the lower plot shows a close-up view of the Inner Detector. The shaded region represents the volume of the TRT, while the inner region is occupied by the SCT and Pixel detectors. The two ID tracks, and associated hits, are clearly visible. High- and low-threshold TRT hits are displayed with the dark and light mark-ers, respectively. The calorimeter cluster associated with the electron candidate is also shown.
the identification of electromagnetic (e/γ ) objects in the EM calorimeter, uses a fixed grid of calorimeter cells in η × φ , cen-tered on a seed cell having a signal-to-noise ratio exceeding a set threshold. For a cluster to form an electron candidate, there must normally be an ID track nearby in η and φ . However, in cosmic-ray events many tracks have only barrel TRT (r − φ ) hit information, in which case the association is done only in φ . The threshold for the reconstruction of an e/γ object with the standard selection is about 3 GeV. To improve the identifica-tion of electrons with lower pT, a track-seeded algorithm is
em-ployed. This first searches for tracks in the ID with pT> 2 GeV
and hits in both the SCT and Pixel Detectors. These tracks are extrapolated to the second layer of the EM calorimeter and a 3 × 7 (η × φ ) cell cluster is formed about this point; the cell size in this layer varies with η but is 0.025 × 0.025 in η × φ over the acceptance for this analysis. In both algorithms, the track momentum and the energy of the associated calorimeter cluster are required to satisfy E/p < 10. This section describes the use of these standard techniques for the selection of a sam-ple of δ -electrons, which are used to investigate the calorime-ter response to electrons with energies in the 5 GeV range. Sec-tion 4.4 will describe an alternative low-pTselection which can
identify electrons down to pTof about 500 MeV, using a more
sophisticated clustering algorithm for determination of the en-ergy of the associated electromagnetic calorimeter cluster.
Electron identification relies in part on the particle identifi-cation abilities of the TRT. Transition radiation (TR) is pro-duced by a charged particle crossing the boundary between two materials having different dielectric constants. The prob-ability of producing TR photons depends on the Lorentz tor (γ = E/m) of the particle. The effect commences at γ fac-tors around 1000 which makes it particularly useful for electron identification, since this value is reached for electrons with en-ergies above about 500 MeV. For muons, these large γ factors occur only for energies above about 100 GeV. The TR pho-tons are detected by absorption in the chamber gas which is a xenon mixture characterized by a short absorption length for photons in the relevant energy range. The absorption leads to high electronic pulses; pulses due to energy deposits from par-ticles which do not produce transition radiation are normally much lower. A distinction between the two classes of particles can therefore be made by comparing the pulse heights against high and low thresholds, and looking at the fraction of high-threshold hits for a given track. This fraction is referred to be-low as the TR ratio.
The production of electrons in cosmic-ray events is ex-pected to be dominated by knock-on or δ -electrons produced by ionization caused by cosmic-ray muons. The energy distri-bution of such electrons is typically rather soft, but has a tail extending out into the GeV region, where the standard electron identification tools can be employed. The experimental signa-ture of such an event consists of a muon track traversing the muon chambers at the top and bottom of the detector, having corresponding MIP-like energy deposits in the calorimeters, accompanied by a second lower-momentum track in the ID as-sociated with a cluster in the EM calorimeter, as illustrated by the event displayed in Figure 9. In the upper view, the incom-ing and outgoincom-ing muon tracks, are seen to leave hits in three muon layers on the top of ATLAS and in two layers below, as
well as in the Inner Detector. In the lower, expanded view of the ID region the muon track and the electron candidate track are shown with the associated hits in the silicon detectors as well and those in the TRT, which are illustrated by either light or dark markers, depending on whether they are low- or high-threshold. The candidate electron track clearly displays a larger number of high-threshold TRT hits, as expected for an electron, as well as an association to a cluster of energy in calorimeter (at the bottom).
The search was performed using data from the PCM sample obtained from cosmic-ray running in the fall of 2008. Based on the expected topology, events were selected if they satisfied the following requirements:
– 2 or more ID tracks
– 1 electron in the bottom of the detector (since the muons come from above).
– 1 or more muon tracks: if there is more than one there must be at least one track in the top and bottom halves of the detector, consistent with coming from a muon of the same charge.
The events so selected are referred to below as the signal sam-ple, or the ionization sample.
There is one important background for which this selec-tion can lead to the identificaselec-tion of fake electron candidates. A highly energetic muon can emit a bremsstrahlung photon that does not convert within the ID. This photon will produce a cluster in the EM Calorimeter that can be incorrectly asso-ciated with the muon track if the track and cluster are nearby, creating a fake electron candidate. The signature for this pro-cess is one incoming and one outgoing muon track in the MS, one track in the ID and a cluster in the lower part of the EM Calorimeter. This signature can be clearly distinguished from the true electron production processes by the number of tracks in the ID (except for muon decays in flight which are expected to contribute only a very small fraction of the electrons of in-terest in this analysis). Nevertheless, for muon bremsstrahlung events, an additional (fake) track may be reconstructed leading to an event with the same signature as the signal process. For these fakes, equal numbers of electron and positron candidates are expected, in contrast to true δ -electrons, where only neg-atively charged electrons are produced. To study this, a ground sample depleted in δ -electrons and enriched in back-ground events due to muon bremsstrahlung, was selected using the requirements:
– exactly 1 ID track
– 1 electron in the bottom of the detector – 1 or more muon tracks
In the analysis of the signal and background samples, slightly modified versions of standard algorithms were used to iden-tify electrons. The standard selection [1] defines three classes of candidates: loose, medium and tight, according to increas-ingly stringent cuts on the typical properties of electron tracks and their associated EM showers, particularly quantities re-lated to the longitudinal and transverse shower development. For the analysis discussed here, a “modified medium” selection is adopted, which is a combination of selection criteria applied in the standard medium and tight selections, with slight mod-ifications to allow for the different topology of the cosmic-ray
muon events. In particular, since most of the muons do not pass through the SCT or Pixel Detector, requirements on the num-ber of hits in the silicon detectors are replaced with quality cuts based on the number of TRT barrel hits and the φ matching of the electron track to the EM cluster. A cut on |z0| is made to
ensure that tracks are in the barrel part of the TRT.
In addition to this modified medium selection, a tight selec-tion is defined by two addiselec-tional requirements:
– 0.8 < E/p < 2.5 – TR ratio > 0.08
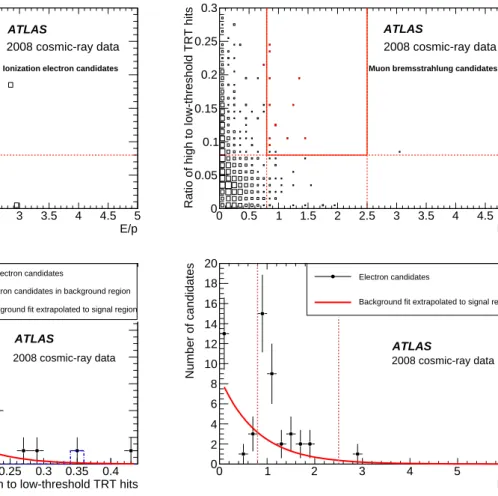
Note that both of these cuts are actually slightly η-dependent, following the standard tight selection. The values quoted above are those applied over most of the acceptance. After application of the modified medium selection, there are 81 events in the sig-nal sample and 1147 in the background sample. Since the back-ground candidates arise dominantly from the case where the EM cluster is associated to the cosmic-ray muon, this sample can be used to model the properties of the corresponding back-ground events in the signal sample, in which the requirement of an additional ID track greatly reduces the number of events. Because E/p and the TR ratio are correlated, these quantities are shown plotted against one another in the upper plots of Fig-ure 10, separately for the signal and background samples. The open (black) boxes show the distribution of candidates passing the modified medium selection. For candidates that also sur-vive the tight selection the distribution is shown using solid (red) boxes. In each plot, the dotted lines show the cuts applied (as quoted above) on each quantity, for the majority of the can-didates. These define the signal region which is enclosed by the overlaid solid lines. The open markers in the signal region and solid markers in the background region arise due to the slight η -dependence of the cuts. There are 34 events from the signal sample passing all cuts, compared to 13 from the background sample. Of the 34 events in the signal region, 4 are positively charged.
The sample of 34 candidates was investigated further in or-der to confirm the identification of these as electrons and to determine the number of δ -electrons by estimating the back-ground in the signal sample. This was done by performing a three-parameter, binned maximum-likelihood fit to the two-dimensional TR ratio vs. E/p distribution for the background sample and then fitting the resulting background shape to the ionization sample in the regions outside the signal acceptance. The results of this procedure are displayed in the lower plots of Figure 10. Note that the fit uses finer binning than is used for these projections. The plot on the left shows the distribution of the TR ratio for the 81 candidates passing the modified medium cuts (points with error bars) while the dashed histogram shows the 47 events in the background region and the solid curve shows the projection of the two-dimensional binned maximum likelihood fit, which provides a good description of the distri-bution from candidates in the background region (dashed his-togram). The right-hand plot shows the distribution of E/p for all candidates remaining after the additional application of the tight-selection cut on the TR ratio. The solid curve again shows the projection of the two-dimensional background fit leading to an estimate for the background contribution in the signal region (indicated by the dotted vertical lines) of (8.3 ± 3.0) events. This is consistent with the hypothesis that the dominant
back-E/p
0 0.5 1 1.5 2 2.5 3 3.5 4 4.5 5
Ratio of high to low-threshold TRT hits 0
0.05 0.1 0.15 0.2 0.25 0.3 ATLAS 2008 cosmic-ray data
Ionization electron candidates
E/p
0 0.5 1 1.5 2 2.5 3 3.5 4 4.5 5
Ratio of high to low-threshold TRT hits 0
0.05 0.1 0.15 0.2 0.25 0.3 ATLAS 2008 cosmic-ray data
Muon bremsstrahlung candidates
Ratio of high to low-threshold TRT hits
0 0.05 0.1 0.15 0.2 0.25 0.3 0.35 0.4 Number of candidates 0 2 4 6 8 10 12
14 All electron candidates
Electron candidates in background region Background fit extrapolated to signal region
ATLAS 2008 cosmic-ray data E/p 0 1 2 3 4 5 6 Number of candidates 0 2 4 6 8 10 12 14 16 18 20 Electron candidates
Background fit extrapolated to signal region
ATLAS
2008 cosmic-ray data
Fig. 10. The upper plots show the two-dimensional distributions of the TR ratio vs. E/p for the ionization sample (left) and the background sample (right). The open (black) boxes show the distribution of electron candidates passing the modified medium cuts. The solid (red) boxes indicate the electron candidates which also survive the tight selection. The dotted lines show the cuts applied to most of the events having η ≈ 0 and low transverse energy: 0.8 < E/ p < 2.5 and TR ratio > 0.08. The solid lines indicate the signal region. Two outliers at high TR ratio (1 in signal, 1 in background region), and two outliers at high E/p are not shown. The lower plots show projections of the fit result for the ionization sample. The left plot shows the distribution of the TR ratio for all 81 electron and positron candidates after the modified medium cuts (points with error bars). The dashed histogram shows the 47 events in the background region and the curve shows the projection of the two-dimensional binned maximum likelihood fit. The dotted vertical line indicates the lower selection cut applied to the bulk of events. The right plot shows the distribution of E/p for all modified medium electron candidates after the additional application of the tight-selection cut on the TR ratio. The curve shows the projection of the two-dimensional background fit from which the number of background events under the signal region is estimated. The dotted vertical lines represents the upper and lower selection cuts on E/p, applied to the bulk of the data.
ground is muon bremsstrahlung, which should produce equal numbers of positive and negative candidates, and the observa-tion of 4 positively charged candidates in the signal sample.
As a final check on the candidate events, several distribu-tions related to shower profiles were compared to expectadistribu-tions based on a Monte Carlo simulation of projective electrons (pro-duced at the nominal IP) with transverse energy of 5 GeV, in the region |η| < 0.8 which is appropriate for comparison with the cosmic-ray electron sample obtained with this selection. These comparisons are shown in Figure 11. The upper left plot shows the lateral containment, in the φ direction, of energy in the cells of the second layer of the EM calorimeter, as defined by the ra-tio E3×3/E3×7where Ei×jrepresents the energy deposited in a
collection of cells of size i × j in η × φ . A large mean value is observed for both data and Monte Carlo, as expected since electrons tend to have a small lateral shower width. The upper
right plot shows the lateral extent of the shower in η, in the first layer of the EM calorimeter, as measured by the sum of the cell-cluster η separations, weighted by the cell energy. This also shows good agreement between data and Monte Carlo. The other quantities plotted are related to the longitudinal shower shape: the lower left plot shows the fraction of the total clus-ter energy deposited in the first layer of the EM calorimeclus-ter while the lower right plot shows the fraction of energy in the second layer. In both cases the average value should be about 40% for electrons, as these tend to start showering early in the calorimeter. There is reasonable agreement between data and Monte Carlo, but both show some small discrepancies. These arise from the fact that several of the data events have much larger energies than were used for the Monte Carlo sample, which consists entirely of electrons with a transverse energy of 5 GeV. The deviations are consistent with what would be
of 2nd EM layer
φ
x
η
Ratio of energies in 3x3 to 3x7 cells in
0 0.2 0.4 0.6 0.8 1 1.2 1.4 Number of candidates 0 2 4 6 8 10 12
Electron candidates after all cuts Simulation
ATLAS
2008 cosmic-ray data
direction)
η
Shower width in first EM layer (
0 0.002 0.004 0.006 0.008 0.01 0.012 0.014 Number of candidates 0 2 4 6 8 10 ATLAS 2008 cosmic-ray data
Fraction of energy in first EM layer
0 0.1 0.2 0.3 0.4 0.5 0.6 0.7 0.8 0.9 1 Number of candidates 0 1 2 3 4 5 6 7 8 ATLAS 2008 cosmic-ray data
Fraction of energy in second EM layer
0 0.1 0.2 0.3 0.4 0.5 0.6 0.7 0.8 0.9 1 Number of candidates 0 1 2 3 4 5 6 7 ATLAS 2008 cosmic-ray data
Fig. 11. Comparison of shower profiles for all 34 e±candidates to those from simulated projective electrons with a transverse energy of 5 GeV and |η| < 0.8. The data points indicate the electrons from the cosmic-ray data, while the histograms indicate distributions obtained from the simulated electrons. The upper left plot shows the ratio of energies in 3 × 3 over 3 × 7 cells in η × φ in the second layer of the EM calorimeter. The upper right plot shows the energy-weighted shower width in η, in the first layer of the EM calorimeter. The lower left (right) plot shows the distribution of the fraction of energy in the first (second) layer of the EM calorimeter. The Monte Carlo distributions are normalized to the number of data events.
expected from the bremsstrahlung background in the sample. Those events can be of higher energy than the electron events, affecting the energy distributions of the showers, particularly the longitudinal energy profiles. Distributions of the fractions of energy deposited in the presampler and in layer 3 of the EM calorimeter show a similar level of agreement with the distri-butions from the projective-electron Monte Carlo sample.
4.4 Identification of low momentum electrons
The majority of the electrons in the cosmic-ray data are ex-pected to be of low energy, of the order of a few hundred MeV. The probability of producing an electron with sufficiently high momentum to produce a standard e/γ cluster in the EM calorimeter is rather small, as reflected in the relatively low statistics available using the selection described in the previous section.
In addition to the sliding-window cluster used for the stan-dard electron identification, ATLAS employs a topological clustering algorithm [24] which groups adjacent cells with
en-ergies above certain thresholds into clusters which are thus composed of varying number of cells, providing for better noise suppression. Each topological cluster is seeded by a cell having a signal-to-noise ratio (|E|/σnoise) above a threshold tseed, and
is then expanded by iteratively adding neighboring cells hav-ing |E|/σnoise> tneighbor. Following the iterative step, the
clus-ter is completed by adding all direct neighbor cells along the perimeter having signal-to-noise above |E|/σnoise> tcell.
Sev-eral types of topological clusters (differing in tseed, tneighborand
tcell) are used by ATLAS, for the reconstruction of calorimeter
energy deposits from hadrons, electrons and photons, over the full range of η.
A selection based on the matching of an ID track to an EM topological cluster was applied to the cosmic-ray data. This analysis, run on data from both the 2008 and 2009 cosmic-ray data-taking periods, is similar to the one described in the previous section, also focusing on events in the barrel part of the detector. The topological signature of the electron events is the same as described in section 4.3 and the data sample is separated into signal and background samples in a similar way, based on the number of tracks; electrons are again searched
for in events with at least 2 ID tracks, while events with only one reconstructed track are used as a background sample. Can-didate tracks must match an EM cluster from the topological clustering algorithm with tseed= 4, tneighbor = 3 and tcell= 0.
This allows the reconstruction of electromagnetic clusters with energies down to about 500 MeV.
Electron candidate tracks are required to be in the barrel re-gion of the TRT and to have at least 25 TRT hits to ensure good quality tracks. There is no requirement of silicon hits. The TR ratio is required to exceed 0.1. Further suppression of back-grounds is achieved using various moments of the calorimeter cluster designed to select the compact clusters typical of elec-tromagnetic objects. For example, Figure 12 shows data and Monte Carlo distributions for the topological cluster moment
λcenter, defined as the distance from the calorimeter front face
to the shower center, along the shower axis. The two plots show distributions for signal and background events accepted by the low-pTelectron selection, before (left) and after (right)
appli-cation of the cluster-moment-based selection criteria. The left-hand plot shows the distribution obtained with the signal se-lection applied to the cosmic-ray data and Monte Carlo along with the expected distribution for true electrons from the Monte Carlo. The MC distribution has been normalized to the data. The cut of λcenter< 220 mm is indicated by the dotted
verti-cal line. Muons which traverse the verti-calorimeter as MIPs leave their energy uniformly distributed in depth, producing a peak in the distribution at the point which corresponds to half the depth of the EM calorimeter. The right-hand plot shows the se-lected region after all cuts, for the signal events, the events from the background sample, and for those events from the Monte Carlo which are matched to real (“Monte Carlo truth”) elec-trons. Good agreement is observed between data and Monte Carlo.
As in the electron analysis described in the previous sec-tion, signal and background regions are defined in the plane of the TR ratio vs. E/p. A fit is performed to the data in the background region of the background sample and then used to estimate the background in the signal sample. Selected events from both samples are shown in Figure 13 for data and Monte Carlo. The Monte Carlo plots also include the distributions of electron candidates that are matched to Monte Carlo truth elec-trons, corresponding to 97% of the candidates selected from that sample. The upper plots show the E/p distributions for the selected events. The final selection cut of E/p > 0.5 is il-lustrated by the dashed line. This lower E/p cut, relative to the analysis described in section 4.3, is needed as the lower pT
electrons suffer relatively more energy loss in the detector ma-terial before reaching the calorimeter. The lower plots show the momentum distributions of the electron candidates passing the full selection, and show acceptance down to ∼ 500 MeV.
In general, ATLAS does not attempt to identify electrons down to such low energies. This commissioning analysis is in-tended to illustrate the flexibility that exists for the identifica-tion of electrons. While the topological clustering technique discussed here is not part of the standard electron identification algorithm for most of the detector acceptance, it is the default technique in the forward region (2.5 < |η| < 4.9). This region is beyond the tracking acceptance, so in that case no matching is done to tracks. Instead, electrons are identified by
topolog-ical clusters having properties (e.g. cluster moments) that are typical of electromagnetic energy deposits.
4.5 Commissioning of the τ reconstruction and identification algorithms
As discussed earlier, the cosmic-ray data have also been used to examine the tools used for the identification of τ leptons. A leptonically decaying τ, where the visible final state is either an electron or muon, is difficult to distinguish from a primary elec-tron or muon. The τ identification algorithm therefore focuses on hadronically decaying τ leptons, for which the dominant fi-nal states consists of either one or three charged hadrons and some number of neutrals. Reconstruction of these final states typically involves several subdetectors: one expects ID tracks associated with the charged hadrons and energy deposits in the calorimeter, from both charged and neutral hadrons. The neutrals are dominantly pions which decay to two photons and leave their energy in the EM calorimeter. Hadronically-decaying τ leptons are often referred to as τ-jets.
The identification of τ leptons is primarily concerned with distinguishing these from a large background due to QCD jets. The identification algorithm relies upon features such as the track multiplicity, which should be low for τ leptons, and the transverse profile of the energy deposits in the detector, which is typically narrower for τ-jets than for those from QCD. A τ will almost always have a final state with either one or three tracks, though some allowance is made for imperfect track re-construction in the ID. Finally, the τ final state will often result in a prominent deposit in the electromagnetic calorimeter, as-sociated with photons produced by the decays of neutral pions. The identification of τ leptons is performed by an algo-rithm that can be seeded either by a track from the ID or by an energetic jet in the calorimeter. Track-based τ candidates are seeded by one good quality track having pT> 6 GeV and
can incorporate up to seven additional tracks with pT> 1 GeV
within ∆ R < 0.2 of the seed track. Once the full set of tracks for a τ candidate is established, an associated calorimeter clus-ter is searched for within ∆ R < 0.2 of the pT-weighted track
barycenter. The existence of an associated cluster is not re-quired. Calorimeter-based candidates are seeded by jets recon-structed from calibrated topological clusters [24] with ∆ R < 0.4 and ET> 10 GeV. Once a seed jet is established the
al-gorithm searches for associated ID tracks having pT> 1 GeV,
within a cone of radius ∆ R < 0.3. The existence of such ac-companying tracks is not required.
Since no τ leptons are expected in the cosmic-ray data sam-ple, the focus of the study described here was simply to exer-cise the algorithms designed to identify them, and to investi-gate how well the quantities used for the selection are modeled in the simulation. Since τ leptons produced in proton-proton collisions originate from the interaction point, these algorithms normally impose tight requirements on the d0and z0
parame-ters of the τ tracks. However, since application of too tight a selection on these quantities (here with respect to the nominal IP) severely limits the available statistics, in this study accep-tance cuts of |d0| ≤ 40 mm and |z0| ≤ 200 mm were used. These
[mm] center h Topocluster moment 0 200 400 600 800 Entries 0 500 1000 1500 2000 2500
Data (signal sample) MC (signal sample) True electron tracks
ATLAS 2008/2009 cosmic-ray data
[mm] center h Topocluster moment 0 50 100 150 200 Normalized to Unity 0 0.02 0.04 0.06 0.08 ATLAS
2008/2009 cosmic-ray data Signal (Data)
Truth electrons (MC) Background (Data)
Fig. 12. Data and Monte Carlo distributions for the topological cluster moment λcenter, for signal and background events from the low-pT
electron selection. The left-hand plot shows the distribution obtained with the signal selection applied to the cosmic-ray data and Monte Carlo, along with the expected distribution for true electrons from the Monte Carlo. The distributions are normalized to unity. The cut at 220 mm is indicated by the dotted vertical line. For this plot, none of the cluster shape cuts have been applied. The right hand plot shows the selected region after all cuts, for the signal events, the events from the background sample, and for the truth electron distribution from Monte Carlo.
E/p 0.5 1 1.5 2 2.5 3 Entries 0 20 40 60 80 100 120
Data signal sample Data background sample
ATLAS 2008/2009 cosmic-ray data
E/p 0.5 1 1.5 2 2.5 3 Entries 0 20 40 60 80 100 120 MC signal sample MC truth electrons MC background sample
ATLAS 2008/2009 cosmic-ray data
momentum [MeV] 2000 4000 6000 8000 10000 12000 Entries 0 20 40
60 Data signal sample
Data background sample
ATLAS 2008/2009 cosmic-ray data
momentum [MeV] 2000 4000 6000 8000 10000 12000 Entries 0 50 100 150 MC signal sample MC truth electrons MC background sample
ATLAS 2008/2009 cosmic-ray data
Fig. 13. Results of the selection of low pTelectrons from the cosmic-ray data samples. The upper plots show the E/p distributions for selected
events in data (left) and Monte Carlo (right), for both the signal (ionization) and background (muon-bremsstrahlung) samples, and for the signal candidates matched to true electrons in the case of the Monte Carlo. The lower plots show the corresponding momentum distributions, for events passing the E/p cut, illustrated by the dashed lines in the upper plots.
Candidate [GeV] o of track-based T E 0 10 20 30 40 50 60 70 80 Number of Candidates 0 200 400 600 800 1000 1200 1400 1600 Tau Candidates Simulation ATLAS Preliminary 2008 cosmic-ray data Candidate [GeV] o of calo-based T E 0 10 20 30 40 50 60 70 80 Number of Candidates 0 100 200 300 400 500 600 Data Simulation ATLAS 2008 cosmic-ray data
Fig. 14. Data and Monte Carlo distributions for the transverse energy of τ candidates from the track-based (left) and calorimeter-based (right) identification algorithms.
Candidate o
Isolation Fraction of calo-based
-0.05 0 0.05 0.1 0.15 0.2 0.25 0.3 Number of Candidates 0 50 100 150 200 250 300 350 Data Simulation ATLAS 2008 cosmic-ray data Candidate o
Centrality Fraction of calo-based
0.7 0.75 0.8 0.85 0.9 0.95 1 1.05 Number of Candidates 0 50 100 150 200 250 300 Data Simulation ATLAS 2008 cosmic-ray data in first EM layer o width of calo-based T E -0.02 -0.015 -0.01 -0.005 0 0.005 0.01 0.015 0.02 Number of Candidates 1 10 2 10 3 10 Tau Candidates Simulation ATLAS Preliminary 2008 cosmic-ray data Candidate o
HAD Radius of calo-based
-0.1 0 0.1 0.2 0.3 0.4 Number of Candidates 200 400 600 800 1000 Data Simulation ATLAS 2008 cosmic-ray data
Fig. 15. Data and Monte Carlo distributions of quantities used in the calorimeter-seeded τ-identification algorithms. The upper left plot shows the isolation fraction, defined as the ratio in which the denominator is the energy deposited within a cone (around the τ direction) of ∆ R < 0.4 and the numerator is the energy deposited in the region 0.1 < ∆ R < 0.2. The upper right plot shows the centrality fraction, defined as the ratio of the energy within a cone of ∆ R < 0.1 to that within a cone of ∆ R < 0.4. The lower left plot shows the transverse energy-weighted width, in the η direction, in the first layer of the EM calorimeter. The lower right plot shows the distribution of the hadronic radius, the energy-weighted width of the cluster, calculated from the energy and positions of the constituent calorimeter cells, relative to the cluster center.
barrel part of the Pixel Detector, which extends to r = 123 mm and z = ±400 mm.
The analysis described here uses the cosmic-ray data from the fall 2008 run. The PCM dataset was used as the starting point for each study. Additional requirements were placed on the presence of pixel hits, differently for the two seeding meth-ods. The track-based selection required that the seed track have at least one pixel hit. For studies of the calorimeter-seeded al-gorithm, while there was no explicit requirement on the asso-ciation of a track to the seed jet, there was a requirement that there be at least one ID track in the event with at least one pixel hit. This track would normally be from the muon responsible for the calorimeter cluster around which the seed jet is formed. However, in cosmic-ray events these tracks are often not associ-ated with the cluster. The pixel hit requirement is thus intended to ensure that the shower shapes (which are used by the identi-fication algorithm) are approximately as expected for particles originating from the IP.
The τ-identification algorithm is designed to reconstruct τ leptons over a wide spectrum of energies. However, the rel-ative performance of the two seeding methods varies as a function of energy with the track-seeding having better per-formance at lower energies while for higher energies, the calorimeter-seeding is superior. Because of this, the type of cosmic-ray event producing fake τ candidates differs for the two seed types. Most fake track-seeded candidates come from minimum-ionizing muons with low momentum, which pro-duce an ID track that fakes a one-prong candidate. The dom-inant source of calorimeter-seeded fakes is cosmic-ray muons that undergo hard bremsstrahlung in the calorimeter. When considering real τ leptons reconstructed from collision data, ideally one would like to have candidates seeded simultane-ously by the track and cluster-based algorithms. In cosmic-ray data, however, since the origin of fake τ leptons differs for each algorithm, very few candidates fulfil the criteria for both. For this reason, track-seeded and calorimeter-seeded τ candidates have been examined separately.
Results are presented here to illustrate the agreement be-tween data and cosmic-ray Monte Carlo for the properties of the two types of τ candidates, in particular for those quantities used in the identification algorithms. In what follows it should be understood that “tau candidate” refers to a fake candidate that passes the selection described above, in which nominal se-lection criteria have been loosened to ensure sufficient statis-tics to allow for a meaningful comparison of the data and the cosmic-ray Monte Carlo simulation. Figure 14 shows the ET
distributions of such candidates from the two types of seed. In the case of the track-seeded candidates this is reconstructed via an energy-flow algorithm [23]. Good agreement is seen be-tween the cosmic-ray data and the simulation.
Figure 15 shows data versus Monte Carlo comparisons for some of the quantities used by the τ-identification algorithm. The upper left plot shows the isolation fraction for calorimeter-seeded candidates, which is a measure of the collimation of the τ-jet, defined as a ratio in which the denominator is the energy deposited within a cone (around the τ direction) of ∆ R < 0.4 and the numerator is the energy deposited in the region 0.1 < ∆ R < 0.2. For the same sample of calorimeter-seeded candidates, the upper right plot shows the centrality
fraction, defined as the ratio of the energy within a cone of ∆ R < 0.1 to that within a cone of ∆ R < 0.4. The lower left plot shows the transverse energy-weighted width, in the η di-rection, in the first (most finely segmented) layer of the EM calorimeter. The plot at the lower right shows the distribution of the hadronic radius, which is the energy-weighted width of the cluster, calculated from the energy and positions of the con-stituent calorimeter cells, relative to the cluster center. All dis-tributions show good agreement between the data and the sim-ulation. In the upper left plot of Figure 15 there are entries at negative values that are attributable to the noise. This is also the cause of the entries at values greater than 1 in the plot of the centrality fraction. The agreement between data and simulation in these regions illustrates that the modeling of the electronic noise in the simulation is reasonable.
5 Jet and missing transverse energy
studies using cosmic-ray events
Numerous theories of physics beyond the Standard Model pre-dict the existence of massive weakly interacting particles that escape detection and thus leave a large energy imbalance in the detector. For this reason, detailed understanding of the de-tector performance for missing transverse energy (ETmiss) is ex-tremely important. The most important input to the calculation of the ETmiss comes from the calorimeter, which provides cov-erage in the region of |η| < 4.9. Cosmic-ray energy deposits in the calorimeter typically lead to an imbalance in the trans-verse energy in the event. This effect can be large in the case of high-energy cosmic rays that lose a large amount of energy via bremsstrahlung. The energy deposits from cosmic-ray muons (or cosmic-induced air-shower events) can be reconstructed as jets, creating backgrounds to jet selections in many analyses. The properties of jets and ETmissreconstructed from cosmic-ray data are presented below, along with a discussion of techniques that have been developed to suppress such contributions in the analysis of collision data.
5.1 Missing transverse energy in randomly-triggered events
As is the case when running with proton-proton collisions, dur-ing cosmic-ray data-takdur-ing randomly triggered events are also recorded. The large sample of such events collected during the global cosmic-ray running allows investigations of the detec-tor performance for the measurement of missing transverse en-ergy. No energy imbalance is expected in these events. How-ever, global quantities such as ETmiss and ∑ ET(defined below)
result from the sum of energy deposits in ∼ 200k calorimeter channels, each with its own electronic noise. A proper determi-nation of these quantities relies on a good understanding of the cell-level noise in all calorimeter channels, and, in particular, a proper treatment of a few very noisy cells and cells having non-nominal high-voltage. There are currently two standard meth-ods for reconstructing missing transverse energy in ATLAS. The first is a cell-level method that takes as input all calorime-ter cells with |E| > 2σnoise. The second method takes as input