Analysis and Results of Lazy-L Tests for the Strength and
Fracture Behavior of Welded T-joints
by
George L. Boone, III
B. S. Naval Architecture and Marine Engineering U. S. Coast Guard Academy, 1992
Submitted to the Department of Ocean Engineering and Mechanical Engineering in Partial Fulfillment of the Requirements for the degrees of
MASTER OF SCIENCE
IN NAVAL ARCHITECTURE AND MARINE ENGINEERING and
MASTER OF SCIENCE IN MECHANICAL ENGINEERING
at the
MASSACHUSETTS INSTITUTE OF TECHNOLOGY May 1996
@ 1996 George L. Boone, III. All rights reserved
The author hereby grants MIT pe rrssjon to reproduce and to distribute publicly paper and electronic cop s l thesis in whole or in part.
Signature of Author
Department of Ocean Engineering May, 1996
Certified by .. - -. , ,,. .
Professor Emeritus Frayn A. McClintock Departnt of Mec, nical Engineering. Thesis Supervisor Certified by
Professor Alan J. Brown Department of Ocean Engineering. Thesis Reader Accepted by
..
C- .PM fes- A. Douglas Carmichael Department Graduate Chairman, Department of Ocean Engineering
J UL 2 6 1996
L-BRA E:3
Analysis and Results of Lazy-L Tests for the Strength and
Fracture Behavior of Welded T-joints
by
George L. Boone, III
Submitted to the Department of Ocean Engineering and Mechanical Engineering on May 28, 1996, in partial fulfillment of the requirements for the degrees of Master of Science in
Naval Architecture and Marine Engineering and Master of Science in Mechanical Engineering.
Abstract
Design of fillet welds for grounding loads is desirable to minimize oil outflow of crude carriers. Using fully plastic fracture mechanics, welded T-joints can be characterized by their limit load, slip line displacement to crack initiation, crack growth factor, and crack direction relative to slip lines. With these parameters, weld strength and behavior for
different types of loadings may be obtained. The Lazy-L Test is presented as a simple and economical means of obtaining these parameters, as well as a means of proof testing joints for service. Modifications to the Lazy-L Proof Test, to achieve worst-case deformations, are also presented.
Four experiments are presented with 6 mm welds and 38.1 mm thick plates produced using GMAW with a combination of MIL-S-22698 (EH-36) and ER70S-3 wire
electrode. The experimentally determined limit moment was 52% below predicted values from least upper bound sliding arcs for opening bending. This suggests cracking before the limit load, most likely due to the high triaxiallity of the opening bending configuration. Experimentally determined limit moments were up to 40% above predicted values from least upper bound sliding arcs for predominant leg shear and double fillet cases. These were surprisingly high, even considering a high fillet shear strength and the effect of friction. A small observed slip line displacement to initiation for the opening bending case was consistent with elastic crack initiation. All experimental crack growth rates per unit slip were consistent with values found in the literature.
The Lazy-T Test is proposed for proof testing against fracture through the fillets even up to the limit moment for S-shaped deformation in the base. The Inverted-y test is proposed for proof testing against fracture from the toe of the weld through the base, even with a relatively thin web. Welds passing the appropriate one of the Lazy-L, Lazy-T, or Inverted-y tests will not fracture in service before at least the web or base plate becomes fully plastic.
For measuring cracking resistance functions when fracture prevents passing a proof test, stubbier legs are needed for stability, along with proposed measurements of
displacement and rotation across the joint.
Thesis Supervisor: Frank A. McClintock
Acknowledgments
The welding and machining of specimens and fixtures was completed at the M.I.T. Lab for Nuclear Science Machine Shop. Testing facilities were provided by the M.I.T. Mechanical Behavior of Materials Lab, Department of Mechanical Engineering.
I would like to thank Professor McClintock for his time, patience and insight in helping me complete this thesis. Thanks also go to Professor Masubuchi for providing funding for part of the project and for his practical welding advice, LCDR Rob Holzman and LT Patrick Little for arranging partial funding through the U.S. Coast Guard,
Professor Alan Brown and the Navy Academic Office for providing funds to re-work the specimens and Steve for expediting the re-work. Special thanks to my wife, Leigh and son, Grayson for tolerating the past 2 years.
Table of Contents
Abstract ... ... 2 Acknowledgments... 3 Table of Contents... 4 List of Figures ... ... 7 List of Tables ... 9 List of Symbols... 10 Section 1 Introduction... 12 Background... 12 Existing tests... ... 12 Organization of Paper... ... 13Section 2 Relevant Analyses... ... 15
Least upper bounds to limit moments... 15
Weld moment from load... 19
Compliances for stable crack growth... 20
Weld rotation from measured displacement... 21
Crack initiation and growth parameters... 22
Section 3 Specimen Design and Testing ... 26
Review of T-joint fillet design... 26
Proof Tests... ... 28
Fillet Cracking Tests... 29
Remaining Lazy-L design considerations... 31
Section 4 Specimen and Fixture Fabrication... 33
Welding... ... 33
Specimen machining... ... 33
Sliding surface and 3/4 rounds... 33
Section 5 Lazy-L Experimental Procedure... ... 35
Instrumenting the test... 35
Measurements during the test... 36
Measurements after the test... 36
Experiments... 36
Section 6 Results and Discussion... ... 38
Single fillet under opening bending... 38
Single fillet predominant leg shear and double fillet... 39
Test stability... 39
Friction... 40
Appreciable leg yielding... ... 40
Welds... 40
Hardness tests... ... 41
Section 7 Conclusions and Recommendations... ... 42
Conclusions... 42 Recommendations... ... 43 Figures... 44 T ables... ... 66 References.. Appendix 1 Appendix 2 Appendix 3 Appendix 4 Appendix 5 Appendix 6 ... ... 7 5 Normalized Limit Moments and Crack Tip Mean Normal Stresses... 77
Normalized Limit Moments and Crack Tip Mean Normal Stresses for A ctual Specim ens... Analysis of Lazy-T and Inverted-y Proof Tests for Required Leg Length... ... Limit Moments for Actual Specimens... 91
Specimen Leg Design Calculations... 93
Appendix 7 Appendix 8 Appendix 9 Appendix 10 Appendix 11 Appendix 12 Appendix 13
Welding Materials, Process and Parameters... 98
Test Machine Calibration and Data Acquisition... 101
Moment vs. Rotation Plots for Experiments... 102
Linear Elastic Fracture Mechanics Analysis... 110
Rigid Leg Assumption Calculations... ... 111
Cost of Materials and Machining for Lazy-L Specimen Fabrication... 113
Effect of Friction on Limit Moments and Estimate of Coefficient of Friction ... 114
Fixture Design ... 115 Appendix 14
List of Figures
Deformation and fracture modes of T-joints found in service, both
normal and accidental... ... 44 Tensile Test Specimen... ... 45 Weld Peeling Test... ... ... 46
Transversely Welded Beam Test Specimen... Lazy-L Test Specim en... ... American Bureau of Shipping fillet weld break tests... Figure 2 Figure 3 Figure 4 Figure 5 Figure 6 Figure 7 Figure 8
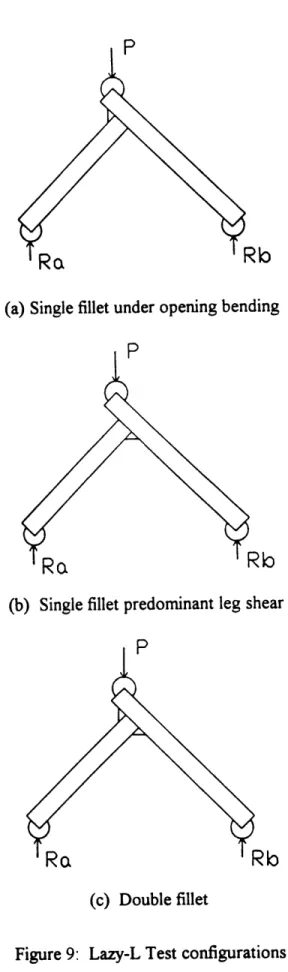
Figure 9 Lazy-L Test configurations... ... Figure 10 Sliding arc for single fillet under opening bending...
Figure 11 Sliding arc for single fillet predominant leg shear... Figure 12 Sliding arcs for the double fillet... Figure 13 Overall Lazy-L Test configuration... 56 Figure 14 Alternating sliding off and cracking model for a non-hardening
fillet weld... 57 Figure 15 Geometry for evaluating weld rotation from measured displacement... 58 Figure 16 Fractures in T-joints... ... 59 Figure 1
Force displacement curve for web tension of a fillet welded T-joint,
showing limit load, PL ... ... 50 Hardness distribution in a fillet weld... 51
Figure 17 Worst case deformation modes for T-joints and corresponding
proof tests... 60
Figure 18 Modifications to Lazy-L Proof Test... . 62
Figure 19 Suggested tack welds for fabrication... 63
Figure 20 Representative machine drawing of 3/4 round support... 64
Figure 21 Sketch of load vs. extension for single-edge-notch specimen for determining slip line displacement to initiation... 65
List of Tables
Table 1 Least Upper Bounds to Limit Moments and Stress Estimates... 66
Table 2 Outcomes, Needed Support Measurements, and Conclusions from
Lazy-L Proof Tests for Limit Loads... 67
Table 3 Outcomes, Needed Support Measurements, and Conclusions from
Lazy-T Proof Tests for Limit Loads... 68
Table 4 Outcomes, Needed Support Measurements, and Conclusions from
Inverted-y Proof Tests for Limit Loads... 69
Table 5 Matrix of Lazy-L Proof and Fillet Cracking Tests...70
Table 6 Maximum Moment, Maximum Load and Horizontal Displacement
of Specimen Legs... ... ... 71
Table 7 Sum m ary of Results... 72
Table 8 Crack Growth and Initiation Parameters from Measurement
of W eld Profiles... ... 73
List of Symbols
*A, OBAC,OD oA, oC0
Ods
OrsOw
Aa
ad , ar C a,u , da/dus df D E g ha I kfLa
Lb
Lo
Ls MM
Mnorm P ra, rc TSincluded angle of Lazy-L specimen Leg A and test surface included angle of Lazy-L specimen Leg B and test surface displacement
specimen rigid-body rotation coefficient of friction
slip arc angles
mean normal stress at the crack tip
rotational displacement of Lazy-L specimen legs deformed side crack angle
rigid side crack angle weld angle
machine shaft cross-sectional area length of crack
length of cracked face
compliance
crack growth factor
weld leg lengthdiameter of 3/4 round support Young's modulus
root gap
effective height rise of specimen leg due to relative rotation moment of inertia
fillet weld shear strength
length of Lazy-L specimen leg A length of Lazy-L specimen leg B overhang length of specimen legs length of ligament at the slip line moment per unit weld length normalized limit moment normalizing moment applied load
slip arc radii tensile stress
tw web plate thickness
us slip line displacement
ui slip line displacement to initiation
uf final slip line displacement
v vertical displacement
w weld length
xw, xb moment arm of Lazy-L specimen leg reaction forces
x, y coordinates of intersection point of sliding arc and fillet free surface
1 Introduction
Background
Recent grounding accidents of oil tankers, like the Exxon Valdez in 1989, combined with the more environmentally conscious public of the 1990's has renewed motivation to improve pollution resistance of all oil carrying vessels. Because of the inherent risk in transporting oil by sea, there exists a need to minimize damage and oil outflow when an accident occurs. Although the tanker vessel accidents are very diverse, for tankers over 10,000 DWT in the U. S., grounding events clearly dominate in terms of both numbers of accidents and, particularly volume of oil spilled. (Marcus, et. al., 1991) Improving structural design for grounding, which has traditionally not been considered in tanker design, could help in reducing damage and oil outflow.
Grounding considered, the structural design of bottom shell plating and its attachment, by fillet welds, to longitudinal and transverse stiffeners is important. The modes of loading and stiffener web separation which might be found in these types of accidents are found in Fig. 1. It is desirable, for all types of loading, that the deformation near a joint occur in the web or base plate rather than in the fillet, to prevent cracking of the fillet. By keeping the welds intact, the vessel is more likely to have reduced size openings in the shell plating. This increases the chances of survival and minimizes outflow of oil if tanks are ruptured. The metallurgical and defect structures of welds vary their sizes, so tests on full-scale welds are currently needed to predict initial and continuing crack growth. A test that yields needed data to predict these parameters for all types of loading and
achieves this at low load is highly desirable.
Existing tests
At present, there are several tests that provide quantitative design and fitness-for-service data. In tension, quantitative measures needed to predict fillet integrity include the limit moment, tear resistance and load drop per unit extension. In bending, these
parameters include the limit moment, rotation to crack initiation and moment drop per unit bend angle.
The tension test, or cruciform test, (Wilcox, 1995) shown in Fig.2, duplicates a full scale welded joint under tension, experienced when bottom shell plating is pulled away from the stiffener web (Fig. l1a). Results desired from this type of test include limit load and displacements to crack initiation and growth which can be used to estimate the tearing
work per unit length. Unfortunately, these tests require very large testing machines and are typically unstable, yielding no crack initiation and growth data from load displacement plots.
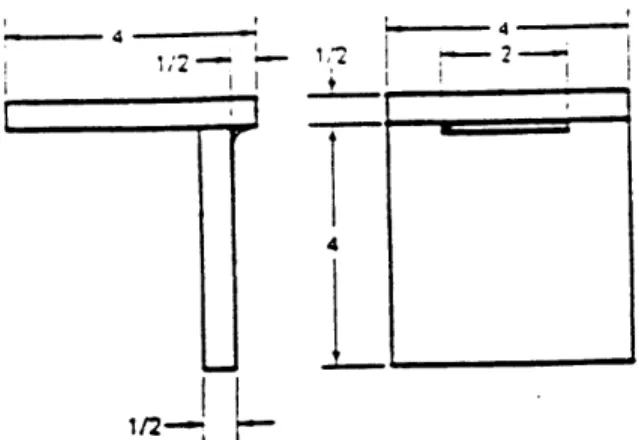
The cantilever peeling test considered by McDonald (1993), shown in Fig.3, is also impractically large, even for 6 mm welds, considering the stiffness required for stability and the length to keep the loads reasonable.
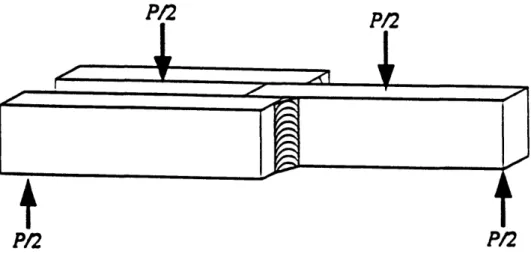
In the Transversely Welded Beam (TWB) Test (Kirkov, 1994), peeling of fillet welds by tensile tearing is reproduced by application of a bending moment to a beam containing a transverse T-joint (Fig.4). Data obtained include the limit load, tearing work and critical displacement for steady-state weld cracking. The results of Kirkov's
experiments were consistent with cruciform tensile tests, but done on a much smaller testing machine.
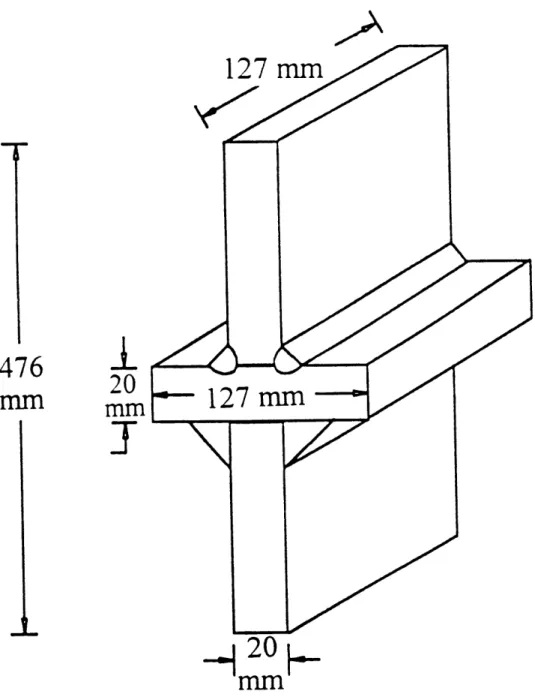
The Lazy-L Test shown in Fig.5, first proposed by McClintock (TSR 26) and the subject of a master's thesis (Brooks, 1995) , is an inexpensive, versatile experiment to proof-test samples of weld plate combinations that are proposed for service. Also, as a
fillet cracking test, the Lazy-L provides quantitative micro-cracking data. This test is actually an extension of the American Bureau of Shipping tack welder qualification test No.3, shown in Fig.6, which tests for qualitative weld characteristics associated with
fabrication, such as porosity, uniformity, and undercut (ABS, 1991). Non-hardening plastic fracture mechanics enables the calculation of the macro-quantities needed for
bending and tension (limit moment, displacement or rotation to crack initiation and moment drop per unit bend angle) from micro-cracking behavior, expressed as weld hardness, slip line displacement to initiation as a function of the normal stress across the slip plane, ui(as) , the cracking direction relative to the slip line, Ocs , and the crack growth rate per unit slip, da/dus = a,u , both also as functions of as at the current crack tip. These data characterize the weld for future designs against plastic deformation and fracture. The Lazy-L test also satisfies the need to have a low-load test on a full scale joint. This paper utilizes theory developed by McClintock on fully plastic mechanics for welded T-joints and a proposal for the Lazy-L test as a useful testing method by Brooks (1995), to develop and try a system, ultimately leading to a standard that could be used by welding engineers and structural designers.
Organization of Paper
This paper first covers, in Section 2, relevant analyses needed in design and data interpretation. A review of T-joint design for conceivable accidental loadings as well as
Lazy-L proof tests (or modifications to it) needed to produce these loadings, follows in Section 3. Section 3 concludes with design for fillet cracking tests. Fabrication of specimens and fixtures needed for the Lazy-L Test is covered in Section 4. Section 5
covers procedures for obtaining useful results from the test as well as a description of the actual specimens tested. Section 6 presents results and discusses the experiments
completed. Section 7 provides conclusions and recommendations for present and future work.
2. Relevant Analyses
This section, following Brooks (1995), first provides relations needed in design of T-joints and the specimens and fixtures for Lazy-L tests. Next, relations are given for conversion of machine load-displacement data to useful specimen moment-rotation values. Finally, relations are given for interpreting test data and measurements to reach crack initiation and growth data.
Least upper bounds to limit moments
Because ship steels are ductile enough in ship groundings and collisions so that plastic deformation, even in the presence of cracks, is large compared to the elastic, fracture mechanics of regions in which the elastic strains are negligible are considered. Further, non-hardening, rate independent plasticity is a useful, approximate limiting case and studies are limited to cases involving strain.
The limit moment is a measure of the strength of the member for a given loading (Fig.7 for tension) and is needed to predict behavior of welded T-joints. Limit moment prediction is difficult due to the complex geometry of the joint and in homogeneity of material properties in the fillet, web metal and heat affected zone. Previous analyses of fillet weld performance under critical loading conditions have utilized equilibrium across a
single section such as a fillet throat or fillet-web interface which, except for longitudinal shear, produce neither exact solutions nor bounds to it. The following summarizes an application of fully plastic fracture mechanics for fillet welded T-joints, developed by McClintock, to compute a least upper bound to the limit moment of the weld. These least upper bounds are typically 20-30% above actual limit moments.
Bounds to the limit moment from plastic slip line fields. Exact solutions for limit moments or loads are difficult to obtain, even without strain hardening, since in any deforming region, they must satisfy five conditions of mechanics, namely: (i) the partial differential equations of equilibrium of stress gradients, (ii) the definitions of components of strain in terms of displacement gradients, (iii) boundary conditions in terms of displacements or tractions (boundary forces per unit surface area), (iv) a yield locus which limits the magnitudes of stress components, and (v) linear functions relating only the increments of strain components to current stress components. In a rigid region only (i), (iii) and a yield inequality are needed. Exact solutions to the limit moment for plane strain and no strain
hardening are best expressed in terms of possibly curved lines parallel to the two directions of maximum shear at a point (e.g. McClintock, 1971). The lines together form a slip line field. Constructing complete slip line fields involves discovering a field that satisfies (a) the Hencky equations for equilibrium and yield condition in the deforming region, (b) the Geiringer equations for incompressibility in the deforming region, and (c) equilibrium and the yield inequality in the rigid region. Although slip line fields have been developed for a number of common geometries (e.g. McClintock, 1971, Chakrabarty, 1987), developing a slip-line field for a novel geometry is a matter of experience, insight, and possibly
experimentation.
Fortunately, an upper bound to the limit moment is found from the plastic work of incompressible displacement fields which satisfy any displacement boundary conditions. Useful upper bounds to the limit moment can be constructed from incompressible
deformation fields which take the form of circular arcs of sliding. Kim (1993)
demonstrates that if stresses on the arc which gives the least upper bound, called the LUB arc, are chosen to satisfy one global component of equilibrium, they satisfy all of them.
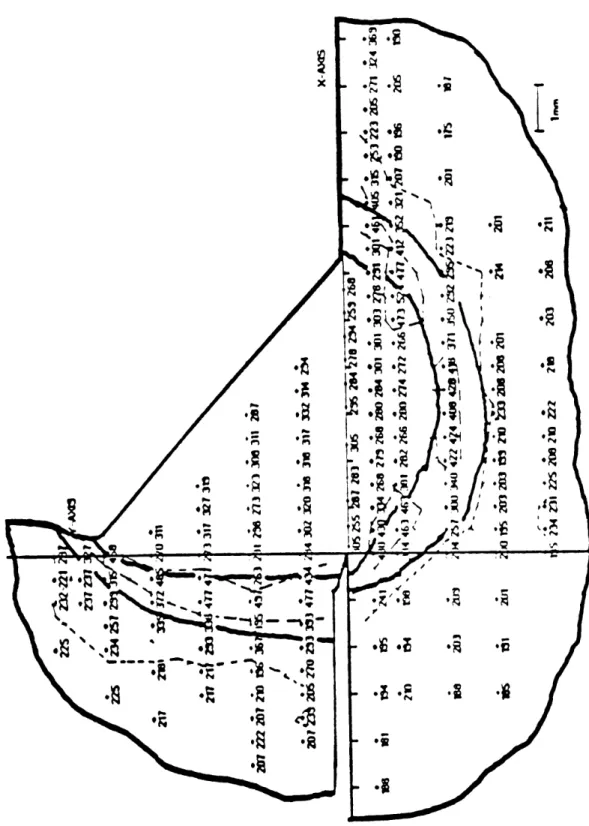
Upper bounds to the limit moment in the Lazy-L Test. Because the hardness within a fillet weld (shown in Fig.8 from Masubuchi, McClintock, Liang, 1996) has been shown to be roughly uniform and less than that in the surrounding heat affected zone, upper bounds to the limit load are found from plastic flow fields, modeled as sliding arcs through the weld metal. The rotation of one section of the specimen, along the arc, relative to the opposite section, 50 , multiplied by the applied moment, M , is equal to the work done in sliding the arcs against the shear strength of the metal:
B(Work)
= M80 (2.1)The arc is adjusted until the limit moment for a given web thickness, fillet strength, fillet size and specimen configuration is minimized. This is the least upper bound to the limit moment. Limit moments have been normalized, depending on the configuration, for clarity and generality.
Specimens used for fillet cracking tests consist of three different configurations (Fig 9): 1) one fillet in the top position, called opening bending, 2) one fillet in the bottom position, called predominant leg shear and 3) a double fillet. The upper bounds are most easily found for the first two. The web is assumed to rotate about a point on one of its edges, so the web just slides along the surface of the base plate. The friction force there does no work. These limit moments calculated for the configurations are used in the design
of specimens for Lazy-L fillet cracking tests. Limit moments for the double fillet are used in general design of T-joints.
Calculation of an upper bound to the limit moment for the single fillet under
opening bending begins with the selection of an arc of sliding through the fillet as shown in Fig. 10. The arc is characterized by a radius of curvature, rc , and angles
4C
and OD , measured clockwise from the x-axis. (Note that angle OC is a constant. An arc with a greater OC would pass through a harder heat affected zone and one with a lesser4C
would be a higher upper bound). The work done in sliding against the shear strength of the metal is expressed in terms of the shear strength of the fillet, kf , the radius of the arc of sliding, rc , the angles, OC and OD , and the relative rotation, 850:8(Work) = M80 = kf[rc(OC-OD)]rc 50 (2.2) From geometry:
C df 1
cosr)D =, - 4 (2.3)
Since this case involves predominant bending of the fillet, the normalizing moment
was chosen to be the fully plastic moment per unit length of a plate of fillet weld metal of
throat thickness df/4(2):
2kff(J kfdfz
Mom = = kfd (2.4)
no4
4
For bending, MLUB / Mnorm = MB:
MB
=
4(
rff)(c
-
OD)(2.5)
MB is now minimized by varying rc/df (since OD is a function of rc/df from Eq.2.3).
For single fillet predominant leg shear, the minimum normalized bending moment is a function of the ratio of weld leg length to web thickness, df/tw . Also, both angles are functions of the radius of curvature for the sliding arc, ra , as shown in Fig. 11. Other variables include the height of the center of rotation, rc , and the point of intersection of the arc and the free surface of the weld, denoted by ( x , y ) coordinates with respect to the reference axes shown in the figure.
The work done in sliding against the shear strength of the metal is expressed in terms of the shear strength of the fillet, kf, the radius of the arc of sliding, ra ,the angles OB and QA , measured from the horizontal, and the relative rotation, 80:
8(Work) = M80 = kf[ra(4B-PA)]ra 50 (2.6) The angles OA and OB may be expressed in terms of ra, rc and x or y, (x = y for
450 welds):
Cos A _ r , COS
_ r
-x (2.7)ra ra
Relations involving ra/tw , rc/tw and df/tw reduce to a quadratic equation in x/tw:
ra
S
= r e +1 = x rf
+ 1+ L(2.8)df xt, t, t tw t, tw
Given df/tw , the rc/tw to minimize the upper bound can now be selected.
The normalizing moment was chosen to be a moment arising from a shear force per unit length of weld, kf df, with a moment arm, tw :
Mnorm = kf df tw (2.9)
For predominant leg shear, MLUB / Mnorm = Ms
a= "r (OB--OA
M= dw (2.10)
M, is now minimized by using ra/tw and x/tw values from Eq.2.8. General results are given in Table 1.
For a double fillet, the minimum normalized bending moment is an extension of the single fillet in predominant shear to include the influence of the additional fillet. The
geometry, illustrated in Fig.12, requires that the height of the center of rotation of the arc of sliding for the fillet in transverse shear equal the radius of curvature for the fillet in
bending, both referred to as rc.
The work done in sliding against the shear strength of the metal for the double fillet case is expressed in terms of the shear strength of the fillet, kf, the radii of the arcs of sliding, ra and rc , the angles OA, PB, , C, and OD measured from the horizontal, and the relative rotation, 50 :
8(Work) = M80 = kf{ [rc(OC - OD)]rc +[ra(fB-(A)]ra }10 (2.11)
Notice from the figure that the angles (C and OD are measured counter-clockwise from the x-axis. As a result, (C = 0 and OD is:
(D
= 1350 - cos( - (2.12)
Using the same normalizing moment as that for the single fillet predominant leg shear in Eq.2.9, for the double fillet, MLUB / Mnorm = MD :
MD = (2.13)
MD is now minimized for various values of rc/tw. General results are given in Table 1.
Weld moment from load
The Lazy-L configuration is analyzed using simple trigonometric and mechanical equilibrium relations. In this section, a relation is developed for calculating the moment applied at the weld as a function of the applied load and specimen geometry. The weld
moment is assumed equal to the moment applied about the center of the least upper bound arc (characterized by radius rc and/or ra ) as shown in Figs.10, 11 and 12 for the three configurations. This weld moment relation is useful in design of specimens for the Lazy-L Test.
Neglecting friction allows the weld moment to be expressed in terms of the reaction force, Ra , the angle, a , the web thickness, tw , and rc , from Figs.5 and 12:
Mweld = Ra[(La - rc)cosa - t, sina•] (2.14)
A moment balance about the right-hand support (Fig.5) yields Ra in terms of the moment arms for the reaction forces, xw and xb , and the applied load, P:
Ra = x (2.15)
xW +1 Xb
where, for rigid legs: xw = Lacosa -twsina , xb = (Lb-tw)cos3 Compliances for stable crack growth
Calculation of the machine, fixture and specimen deflections at the limit load are needed to predict whether or not stable crack growth is possible for a particular testing apparatus and set of specimens.
Specimen compliance is estimated by from elastic deformation of the specimen legs. Assuming the joint is fixed, the vertical displacement of leg A, va, is expressed in terms of Ra, La , Young's modulus, E , and the moment of inertia, I (e.g. Crandall, et. al.,
1992):
Ra La3 Cos 4RLa 3 cos2
(2.16)
v = = (2.16)
3EI Ewtw2
An equivalent expression may be developed for Leg B of the specimen by substituting Rb, Lb-2tw, and 3 for the corresponding variables for leg A in equation (2.16). For equal leg lengths (La = Lb-2tw) and thicknesses, the vertical displacements, va and vb , are equal and the vertical displacement of the specimen, vs = Va. For asymmetrical specimens, a conservative estimate of specimen compliance is achieved by equating vs with the larger of the two vertical displacements at the leg ends.
Fixture compliance is estimated by determining the vertical displacement due to elastic deformation of the fixtures. The vertical displacement of the I-beam in the experiments is given in terms of the reaction force, Ra, the length of overhang for the
specimen, Lo , Young's modulus, E , and the moment of inertia of the beam, I (Fig.13) (Crandall, et. al., 1992):
RaLo3
vf = o (2.17)
3EI
Machine compliance varies with the crosshead position. To estimate the effect of crosshead position for the experiments, the compliances of the screw shafts are calculated. For two shafts the compliance is expressed in terms of the deflection, 8 , the load, P , the length of the shafts, L , and the cross-sectional area, A :
Cshaft = 8/ P = L / 2AE (2.18)
The change in the shaft compliance is added to the measured compliance at a single cross-head position to yield a total compliance at the current shaft length:
Ctot = Cmeas + (L -Lmeas) / 2AE (2.19)
If the value of the change in shaft compliance is small compared to Ctot, Cmeas may be used as the compliance of the machine at all shaft lengths as done for experiment compliance calculations in App.6. For the experiments, using 2 in diameter shafts, L-Lmeas = 20 in, and Cmeas = 2.15 x 10⁻⁶ , the compliance due to the change in shaft length is only 5% of Ctot.
Weld rotation from measured displacement
In order to interpret displacement data, measured displacement, vmy, must be related to relative rotations, 80, between the specimen legs. This relative rotation is related to displacement along the arc of sliding through the weld, dus (Fig.14). The displacement-rotation is developed for the assumption that the Lazy-L specimen legs remain rigid throughout the test.
First, fix Leg B of the specimen and impose a displacement vector perpendicular to Leg A as shown in Fig. 15. The small height rise, ha, is expressed in terms of La, 80 and a as well as the span of the specimen, xw+xb ,and the rigid body rotation, &y :
The measured displacement, vm, can also be expressed in terms of &y:
vm = Lb&ycosI (2.21)
Solving for &y gives:
La80cosa LaOcoso (2.22)
x, + xb L cos a + (Lb - 2t,)cosI3
Finally vm can be related to the relative rotation, 80 :
V
La
cosa Lb cos_ (vm
=e[
La cosa +Lb
tcos
(2.23)
Crack initiation and growth parameters
Slip line displacement to initial crack growth The displacement along the arc of sliding is given in terms of the radius of the arc, r , and the relative rotation of the
specimen measured as described in Sec.5:
8us = ra,c 80 (2.24)
For two symmetrical arcs alternately active, as observed in the single fillet opening bending
case, the displacement along each slip line is:
Bus=rc6 0 / 2 (2.25)
The crack growth ratio., da/dus = a,u , is a measure of crack advance per unit slip line displacement needed for calculating the tear resistance of T-joints in tension. This ratio, approximated for small crack growth angles, is related to the slope of the steepest part of the falling curve, 8(M / ML) / 80 .
For single fillet under opening bending, using 8a = 8df / 42, Eq.2.25 and differentiating the relation for moment (M = MB kf df2/ 2) with respect to df, the crack growth ratio is:
da 8(ML 1
d (2.26)
du, 80 r / d, "x
For single fillet predominant leg shear and double fillet, using 8a = 8df, Eq.2.24,
and differentiating the relation for moment (M = MS,D kf df tw ) with respect to df, the crack growth ratio is:
da _ 1 (2.27)
du, 6 r/ df
For an alternative estimate of these crack growth parameters, than from moment-rotation plots, profiles of incompletely cracked specimens sections or fractured surfaces can be measured by an x-y recorder driven by LVDT's on the table and barrel of an optical
microscope, or more elegantly by confocal laser, or scanning electron, stereo microscopy (Masubuchi, McClintock, Liang, 1996). Consider negligible strain-hardening and use the alternating sliding and cracking model of Fig. 14 (shown for a T-joint in tension, but can be extended for an arc of sliding). Repeated micro-crack advance by dad in the Ods direction relative to the slip lines, alternating with slip dus , leaves the entire surface of the deformed side (ds) at Ods.
Then the ligament at the last of the successive slip lines on the deformed side decreases by:
dLs = -dus -da(coseds-sinedstan0w) (2.28) The sought for displacement during crack growth, uf -ui , can now be given in terms of the initial ligament LsO and the deformed-side crack growth rate per unit slip, dad/dus :
Lso = d-g-u =(uf -u 1+ da"d (cos 0& + sin0d tan0) (2.29)
L dus
d-g-ui
uf -ui = dgu (2.30)
In analyzing test results, the deformed-side crack growth ratio can be found from the displacements by rearranging Eq.2.30:
d-g-ui
dad uf -ui (d- g- uf)/ (uf - u) (2.31)
(2.31)
du, COSOds + sinO&tan w cosod + sinOdtanOw
Alternatively, the deformed-side (and also the rigid side) crack growth ratios can be found
from the deformed and rigid-side crack face angles using geometry of Fig. 14.
cotOrs du, + dad cosd dad = 1 da = dad sin (2.32)
dad sin 0d du, sin dscoto , -cos ds du, du, sin ,•,
This analysis for tension is applied to the predominant shear and double fillet cases
since most of the resistance comes from shear. From Fig. 14, yr , yd , ds , Ors , xf, ar, and ad are measured. To find slip line displacement to initiation , ui, the slip line displacement, uf, is given in terms of Yr and yd:
uf = Yr -Yd (2.33)
where: Uf - = f tan tan (2.34)
To estimate the crack growth ratios, assume a single slip and fracture propagating through the entire fillet. The rigid and deformed-side crack growth ratios then can be found
from the displacements ar, ad and uf:
dar/du = ar/uf , dad/du = ad/uf (2.35)
Note: For da/du >> 1, the two are similar.
Lazy-L test results in terms of the mean normal stress across the crack tip are independent of the test configuration and applicable to other loadings. McClintock (TSR 26) has developed equations for the mean normal stress at the fillet root as functions of the
angles in radians, the mean normal stress at the root of the single fillet under opening bending is:
= - 1O + (Oc -OD) (2.36)
Similarly, the mean normal stress for the single fillet in predominant leg shear is:
=
-i
1 + (A --B) (2.37)where 0 s equals OB + n/4 in order to measure from the fillet surface rather than the horizontal as in Fig. 11. Finally the two mean normal stresses for the double fillet are:
-c +
(=
D-.. C B (0A -B) (2.38)3. Specimen Design and Testing
Review of T-joint fillet design
The design of structural details, such as fillet weld design, is influenced greatly by standards of classification societies. Classification societies direct the size and type of material used in constructing commercial ship welds. The standards are based on
approximate theory, experience, and factors of safety used to simplify weld design for normal operating stresses.
Of interest, however, is the design of fillet welds for performance during groundings and collisions. The best design for an accident would be one in which all the plastic deformation around a joint takes place in the shell plating and stiffeners, while no section across the joint fractures or reaches its limit load. (If a weld section of the joint did reach its limit load, the resulting concentration of deformation in the joint would soon lead to fracture.)
Fully plastic joint section fractures. As shown in Fig. 16, fully plastic
deformation, and hence ductile fracture in T-joints could run past the end of the web plate or through the base plate (intercostal member). These will be referred to as "web section" fractures and "base section" fractures. Fracture can occur before fully plastic flow, but the
goal here is to assure fully plastic flow before and during fracture. Tests that fail to verify reaching the limit load do provide the load at which elastic or elastic-plastic fracture occurs, but the analysis of such results if left to future developments in linear and non-linear elastic
fracture mechanics
Worst case deformation modes of T-joints. Examples of the worst-case
conditions for T-joints are presented in Fig. 17 along with the corresponding Lazy-L tests (or modifications to it, which will be discussed later). Web tripping , as seen in a number of ship grounding accidents, is shown in Fig. 17a. This is a worst-case condition for the web section if the web is thinner than the base plating as is usual. Another worst case for the web, shown in Fig. 17b, includes high opposing curvatures in the base across the joint, plus tripping of the web which may occur in tanker grounding. A worst case for the base section is shown in Fig. 17c. For this case, high base curvature is reached on one side the joint, plus tripping of the web.
Design for base and web sections stronger than adjacent plates. Note that any reasonable fillet weld will leave the base section limit load as high as that of the base plate, so the design of fillets to prevent base section fracture is not considered here.
To prevent web section fractures, note that if shear and tensile forces are small enough to not affect the moment, the largest moment on the web section is limited to that which could be applied by the adjacent web plate. In an accident, the maximum is that which would produce high curvature in the plate. Practically, take the web limit moment to be the non-hardening limit moment of the plate evaluated at its tensile strength, (MLw)TS • To ensure this limit moment is reached before appreciable plastic flow in the web section, evaluate the web section limit moment at the yield strength in the fillet weld, (MLwsec)YS:
(MLwsec)YS > (MLw)TS (3.1)
Limit moment for the web plate. The fully plastic limit moment for the web plating, per unit weld length, is given in terms of the tensile strength of the web plating, TSw, and its thickness, tw (Crandall, et. al. 1992):
2 t2
M = -TS, - (3.2)
3 '4
Limit moment for web section. An upper bound to the limit moment for the web section is found from minimizing the work done in sliding along an arc through the fillets against the shear strength of the metal. This limit moment is given is terms of the
normalized limit moment for the joint (double fillet), MD , and the normalization moment for the configuration (See Sec.2):
ML = MD kfdft (3.3)
The Mises yield criterion gives the shear yield strength, k , in terms of the tensile yield strength, YS : k = YS/13. (This is in contrast to the approximate maximum shear strength, k = 0.75TS, recommended by Krumpen and Jordan (1984) because of less thinning in shear of a fillet than in a tension test.)
Relations between weld leg and web thickness. Substituting equations (3.2) and (3.3) into equation (3.1) and using kf = YSf/13 gives the weld leg-web thickness relation for proper design of fillets for prevention of plastic web section fracture:
df 1 TSw
- > (3.4)
tw 2MD YSf
Relations between web and base thickness. Generally, the base plate is thicker than the web for other reasons than the design of the T-joint. Occasionally, however, it may be desired to have the web remain rigid in service, as in Fig. 1 T7b. Parenthetically, for such service the limit moment of the web must be designed to be greater than the nominal yield moment of the base. If so, the thickness of the base must be lower than that given by:
2M, = 2 TSb 2 Lw 2 YS,
tw -
S
(3.5)V-3 4 T 4 2TSb
Proof testing the web section with such thin base plates turns out not to be possible with the Lazy-L Test, but can be done with the Lazy-T Test discussed below.
Proof Tests
As a check of the design and fabrication, a proof test involves loading the member to worst-case service conditions to ensure that the web or base plate will obtain high curvature before the joint fractures or yields appreciably. The limit moment per unit length of a plate in plane strain bending is given by Eq.3.2. The tensile strength might be
obtained from a Rockwell hardness test.
Lazy-L Proof Tests. The proof tests that correspond to the worst-case service conditions of Fig. 17 are shown in the right hand column of that figure. In a Lazy-L Proof Test of a successful joint, only one plate should yield appreciably. If both plates yield, the curvature in the weaker member may be limited so that the weld section has not been tested to the full moment the weaker plate might develop at its tensile strength. Which one, or whether both will yield can be predicted from the yield and bending moments found from Eq.3.2 by using the yield strength YS and the tensile strength TS of the web and base sections, (w) and (b). (Note that for the Lazy-L Test, the moments applied on the web or base plates will be approximately equal.) For plates that yield, the distances to their
support points from the central load point, xw or xb shown in Fig.5 , must be measured in order to find the maximum moment that the weld sections have withstood. These
Simulated Lazy-L Proof Tests. If both plates have been predicted to yield in the Lazy-L Test, the thickness of the stronger will have to be increased to obtain high
curvature in the weaker member. Unfortunately, the thicker plate, through a higher cooling rate, may affect the fracture behavior of the weld. Therefore we call such a test a simulated proof test.
Lazy-T Proof Tests. There may be service conditions where the applied moment on the web may be twice the moment applied on each side of the base plating as in Fig. 17b. If the limit moment for the web happens to be greater than for the base, high curvature in the web plating cannot be obtained with a Lazy-L Test , and perhaps not even appreciable yield. Therefore, the web section for this service condition cannot be proof tested with the Lazy-L. To proof test this service condition, the moment applied on the web must be twice that applied on each side of the base. This can be accomplished with an extension of the Lazy-L Test, called the Lazy-T Test, shown in more detail in Fig. 18 and analyzed in
App.2. An extension of Table 2 is constructed for the cases of Fig.17b in Table 3.
Inverted-y Proof Tests. For service conditions where high curvature is attained in relatively strong base plates on only one side of the base plating, as seen in Fig. 17c,
another modification to the Lazy-L is needed for proof tests. The Inverted-y test, shown in more detail in Fig. 18 and analyzed in App.2, applies the moment of the web plus that of the opposite side of the base to one side of the base plating. An extension of Table 2 is
constructed for the cases of Fig. 17c in Table 4.
Fillet Cracking Tests
The Lazy-L Test also allows quantitatively measuring the cracking behavior of the fillet welds for evaluating changes in the welding process, or for choosing welds for other modes of deformation such as mixed bending and tension or the web tension that occurs in peeling. To obtain rotation angles from testing machine displacements, the specimen must be designed such that the fillets will fracture before appreciable (general) yielding in either the web or the base plating. Ideally, fillet cracking will not occur until after the limit moment has been reached. The limit moment for the web section based on the tensile strength, (MLwsec)TS, must be less than those for the web or base plates based on the yield strength, (MLw)YS , (MLb)YS :
(MLwsec)TS < (MLw)YS, (MLb)YS
If this thickness requirement is impractical, some means should be developed for measuring local rigid-body displacements and rotation across the weld section.
Lazy-L tests with a single fillet on either the outside or the inside of the joint, and the two fillets together, provide different slip displacements per unit joint rotation, and different normal stresses across the crack plane at the crack tip, so all three are needed. Also, the different configurations call for separate calculations of limit moment. (See Sec.2) Using the limit moments for the web section and plates, the plate thicknesses required by Eq.3.6 are:
Single fillet under opening bending
tw 0.75'1: TSf B (3.7)
*->• 1VIs (3.7)
df F2 YSw
Single fillet predominant leg shear. and double fillet:
tk 0.7 5TSf
d
df>
2
'
MSD
(3.8)
YSW
With single slip line fillet cracking tests, the weld cracking can be described in terms of crack resistance functions such as the dependence on normal stresses of the slip displacement to initiation, ui , the rigid side crack advance per unit slip, dar/dus , and the crack direction relative to the slip line, Ors =
Or - Os
, shown in Fig. 14.ui(L ) , dau = aru, (- Or - Os = (,, (3.9)
2k du,
2k ' '
2 k\2k
With these fundamental functions, the effects of various welding process could be
described more concisely, and the results used to predict weld behavior under other modes of deformation, such as transverse tension of a T-joint.
Remaining Lazy-L Test design considerations
Additional considerations for design of specimens for the Lazy-L Test include: 1) the specimens must be sized so that the maximum load is within the capacity of the testing machine and 2) for stable fracture, so that crack growth data can be gathered, the sum of the machine fixture and specimen compliances must not be greater that the anticipated load drop per unit displacement.
Weld Length. Choice of weld length is governed by: 1) the plane strain
requirement and 2) the load capacity, size and compliance of the test machine. The plane strain requirement ensures the majority of the weld material is sufficiently far away from the end to minimize the influence of weld end effects. The recommended weld length is ten times the weld leg length. (Brooks, 1995) Some iteration may be necessary if the length of the legs required to reach the total limit moment for a chosen weld length exceeds
compliance, load or size restraints of the test.
Leg Length. Choice of leg length is governed by: 1) choice of weld length, 2) limit moment of the specimen and, 3) load capacity, size, and compliance of the test machine. The first consideration is to make sure that the limit moment for the specimen is reached within the load capacity of the test machine. The second consideration is to make
sure that for the chosen leg length, the compliance is less than that which would cause unstable fracture. Relations for calculation of limit load from limit moment and for calculation of machine, fixture and specimen compliance are presented in Sec.2.
Recommended procedure for choice of weld and leg length 1. Choose weld length to be:
w = 10 df (3.10)
2. Calculate the least limit moment of the sections and plates:
M=minM Molw ,
-TS
w- (3.11)3. Choose minimum leg length to achieve M within the capacity of the testing machine. For short legs, the effects of thickness on the geometry and loads may have to be taken into account.
4. Verify that the height and span of the welded specimen do not exceed height and span constraints of the machine and fixture. A larger machine and longer fixture base may be necessary.
5. Ensure that the sum of machine, fixture and specimen compliances, Cmfs , does not exceed anticipated displacement per unit load drop, Cfract. For a single fillet predominant shear, the cracking displacement will be of the order of the length divided by the crack growth ratio, a,u , typically 3-10, but infinite for cleavage:
Cmfs = Cm + Cf + Cs < Cfract = PL / (df / a,u) (3.12)
(Note: For opening bending divide df by i2.)
If inequality (3.11) is not satisfied for a given machine and fixture, either increase the plate thickness to reduce the specimen compliance or decrease the Lazy-L leg length. (Reducing the weld length, df, is likely to give a different cracking behavior, as is increasing the plate thickness, which will cool the weld more rapidly.)
4 Specimen and Fixture Fabrication
Welding
The welding process, the process parameters and the surface preparation should be chosen to match the application for which the Lazy-L Test is being conducted. Weld fit-up and structural distortion are important. Distortion and the presence of gaps may reduce the
strength of the joint and cause uneven loading.
Distortion due to welding causes the specimen legs to fold over toward the side of the joint which is welded. This is reduced by first tack welding the ends. The specimen is now cut and machined to weld length, w , which removes the tack weld and the ends of the weld, which cool at a slightly different rate than the rest of the weld and are usually not of consistent quality (Fig. 19). It is desired, to be consistent with the slip line analysis, that zero penetration is made at the root of the joint. Attempts to do this however may result in inferior welds due to lack of fusion, especially if the fillet is undersized for the plating being joined. Weld parameters for fabrication of specimens for the experiments are given
in App.7.
As shown in Fig.5, the joints for the experiments are welded to allow an overhang of one thickness from the top side of the joint. This choice may be modified for certain proof tests, as described in Sec.3.
Specimen machining
The ends of specimen legs should be machined square to improve weld fit up and ensure even loading across the specimen.
The cut-off end sections mentioned above should be used for light load superficial (HR15N) hardness readings on the weld. Mill or grind, by a water cooled process, the original surfaces near the weld for firm support on a pedestal anvil.
Sliding surface and 3/4 rounds
The sliding surface should be ground and sanded (or other appropriate means) to minimize friction with the 3/4 round supports. Additionally, Teflon spray lubricant is applied before testing. Brooks (1995) additionally used heavy oil and Teflon shims. All other fixture surfaces are machined smooth for even support. An I-beam and 1/4 in plates were used, for example, in these experiments (Fig. 13).
The 3/4 round supports, shown in a representative machine drawing in Fig.20, are turned to diameter D and then drilled along the axis using a 1/8-inch diameter bit. A 900 wedge of material is removed using a band saw and milling machine. The drilling procedure creates a rounded notch which relieves stress concentration.
5
Lazy-L Experimental Procedure
Instrumenting the test
If possible, arrange for real-time displays of the moment vs. rotational
displacement, including hysteresis loops on loading and reloading. The plot will show initial system compliance and the effect of friction, if any, and will become vertical and accelerate as instability is approached.
Ideally, display the applied moment in normalized form, such as M / MLUB. Calculating a load-moment and displacement-rotation conversion factor (Eqs. 2.14 -2.15 and 2.23) for a given specimen or set of specimens allows quick conversions during testing. A normalized moment facilitates generalizing the results to other dimensions, or comparing the incompleteness of such generalization due to initiation if it occurs before full plasticity.
Instrumentation for the pilot experiments, performed on a Instron 1125 universal testing machine with Labtech Notebook data acquisition software, is included in App.8. Measurements before the test
Hardness test readings should be taken at several locations within the fillet weld as well as in the web and base material. Hardness can be converted to Knoop hardness readings, in kg/mm2, from which TS=0.3HK. Light load superficial Rockwell hardness
tests, HR15N, are appropriate in the fillet weld since indentations are small, which allow readings to be taken at several test points. By hand magnification or by eye, measure the size of the actual fillet as well as any gaps, and note the shape of both. Polaroid pictures may be appropriate.
Machine compliance data is often included in the literature from the manufacturer, but varies with crosshead position and direction as well as test orientation. Therefore it should be measured for a particular test configuration. For purposes of experiments, the value of machine compliance was taken from compliance tests done by Brooks (1995) on the same machine. This value was compared (Sec.2) to the calculated compliance of the machine screw shafts to quantify effect of different cross head positions. Since the value of fixture compliance was expected to be small compared to the other sources, it was calculated from the beam deflection equation (Eq.2.17) for predicted limit loads.
Measurements durine the test
During initial loading, determine the total machine, fixture and specimen compliance by 90% unloading from, say, 2/3 of the expected limit moment with plots of moment vs. rotational displacement. Also observe any hysteresis in the loading and unloading curves. Friction may be considered negligible if the hysteresis loop is small. That is, if the change in moment due to forces acting in different directions is small, friction is negligible.
As the load drops, perhaps unload and reload to determine current compliance. Look for asymmetry (Crack breakthrough on one side or at one end). Stop the crosshead and mark on the specimen where the crack has penetrated the surface of the weld. This will give an idea of the size of the plane strain region.
Measurements after the test
Note on the plot the following crack growth and initiation parameters:
i) rotation to initiation. An estimate is found, for a rigid-plastic material, from the angle change on the moment rotation plot between the intercepts on the line of maximum moment of the initial elastic compliance and the tangent of the steepest part of the falling curve (Kardomateas and McClintock, 1987, See Fig.21).
ii) moment drop during crack growth. The choice of moment drop may be arbitrary along the steepest part of the falling curve, which corresponds to crack growth.
iii) rotation during crack growth. Measure the rotation corresponding to the arbitrary moment drop in ii)
iv) estimate plane strain zone from fractured specimen. This can be done with the aid of markings made on the test specimen.
v) note and measure, if possible, the size of hysteresis loop in unloading and re-loading curve.
vi) measure xb, xw if deflection is significant.
Experiments
The matrix for experiments is an extension of earlier work completed by Brooks (1995) on the Lazy-L Test (Table 5). Brooks tested 20 mm plates of varying weld lengths joined by 6 and 9 mm fillets. Since three of the earlier tests could have qualified as a now
called proof test and more useful results are generated by a fillet cracking test, only fillet cracking tests are examined here. To satisfy plate thickness to weld leg length, ( tw/df), requirements for the fillet cracking test established in Sec.3 for all three configurations, 38.1 mm (1.5 in) thick plates with 6 mm fillets were used. Specimen leg length, La and Lb , and weld length, w , were chosen to meet plane strain and testing machine load capacity requirements described in Sec.3. To allow for duplication and examine the effect of root gap on the results, tests on a total of 9 specimens were planned: three of each configuration, including one of each configuration with a 2 mm root gap. Unfortunately, inferior welds were made on the first set of specimens. Due to budget constraints, only four specimens could be re-welded and machined. (See App. 12 for cost summary)
6. Results and Discussion
The moment normalized with respect to the calculated limit moment, M / MLUB , is plotted against the calculated rotational displacement in App.9 for each specimen tested. The rotation is calculated with the rigid leg assumption which was valid for all tests run. (Table 6 and App. 11) To check for the effect of friction, crosshead displacement was reversed during load rise for all runs except that for Specimen 2. The moment effect due of friction was estimated at +/- 6% of the limit moment (App.13). Uncharacteristic drops in moment, seen near the limit load in the plots of Specimens 4, 5, and 7, are due to rate-dependent deformation when the crosshead was stopped to measure the horizontal displacements of the legs. Results for all experiments are shown in Table 7. Single fillet under opening bending
The load-deformation curve was stable throughout. Total displacement was
approximately 9 times the elastic displacement extrapolated to the maximum load using the initial slope, so plastic analysis is appropriate. The crack grew through the middle of the fillet, indicating both slip arcs were active.
Limit Moment. For bending, the observed maximum moment was half the least upper bound: Mexp / MLUB = 0.48. Brooks found for 6 mm fillets Mexp / MLUB = 0.7 and 0.9, and for 9 mm fillets, Mexp/MLUB = 0.45 to 0.52. This suggests cracking before the limit load. By linear elastic fracture mechanics, KIc for the test specimen is 48.1 MN-m- 3 /2 , which seems reasonable for steel (App. 10), (Matthews, 1973). The high triaxiallity of this configuration may cause the elastic then plastic behavior of the crack. As the crack extends, the plastic zone for elastic fracture most likely reaches the far side of the ligament, resulting in fully plastic crack growth.
Crack response functions. An estimate of the crack growth per unit slip displacement on dual arcs, a,u , is made from Eq.2.26. The result of a,u = 3.5 is reasonable for fully plastic fracture (3-10). The slip line displacement to initiation, ui as shown in App.9 on the opening bending plot, is found from the angle change on the moment rotation plot between the intercepts on the line of maximum moment of the initial elastic compliance and the tangent of the steepest part of the falling curve (Kardomateas and McClintock, 1987, See Fig.21). The value for Specimen 2 is ui = 0.039 mm. This value
is reasonable considering the specimen fractured well below the limit load in the elastic region.
Single fillet predominant leg shear and double fillet
The loads and crack growth behavior for the single fillet predominant leg shear are similar to those for the double fillet in Lazy-L testing, so the two are discussed together. The system became unstable after plastic rotations of 1-2 times the elastic rotation to the limit moment. The cracks grew relatively close to the web plating for these cases: within df/7 for the double fillet and much less than df/10 for predominant leg shear.
Limit load. The ratios of experimental observed moment to that calculated from sliding arcs for the least upper bound were Mexp / MLUB = 1.2 and 1.4 for predominant leg shear and Mexp / MLUB=1.4 for the double fillet. Even taking into account a high
as-welded shear strength of the fillet and the effect of friction, Mexp / MLUB is still surprisingly high.
Crack response functions. Previous Lazy-L experiments with thinner leg sizes were unable to generate any quantitative data on slip displacements for crack initiation or growth from moment-rotation plots because of excessive leg deformation. Because leg deformation was negligible for these experiments, slip line displacements to initiation were estimated from cross head motion. ( Because these fractures were unstable, the maximum
slope of a stable falling curve was sketched.) For the single fillet predominant leg shear tests, ui = 0.22 mm and 0.17 mm, and for the double fillet, ui = 0.07 mm. The slip line displacement to initiation for the double fillet is surprisingly low for plastic fracture.
Estimates of crack growth ratio were also made from measurements on the actual weld profile (Table 8). For the single fillet predominant leg shear cases, dar/dus = 6.2 and
6.4 and for the double fillet, dar/dus = 3.1. Typically, values of 6 have been found for other forms of asymmetric crack growth. Due to very small crack face angles, an estimation of ui could not be obtained by hand measurement.
Test stability
Both the single fillet predominant leg shear cases and the double fillet case fractured
unstably. Brooks also experienced these type of failures using the same testing machine,
of App.6 show that the compliance criterion is barely met for the transverse shear case and not met by the double fillet. The largest contributor of compliance among machine,
specimen, and fixture compliances is specimen compliance. Since a specimen leg thickness of 38.1 mm is practically near maximum, using shorter less compliant legs is a likely
solution.
Friction
For the experiments, Teflon spray was applied to the sliding surface before each test. Even so, somewhat appreciable hysteresis loops were observed in the unloading and reloading part of the moment-rotation plots. The effect of friction was determined to be +/-6% of the total moment applied (App. 13). This effect is about twice that of the effect of axial force at the joint on the moment, which was neglected. The coefficient of friction was estimated at p = 0.08 for the experiments. Brooks (1995), using a heavy oil and Teflon spray, observed smaller hysteresis loops. He found break-down of Teflon shims.
Appreciable leg yielding
A requirement to find crack path deformation in the fillet cracking test was that the specimen legs not yield appreciably. The stress reached in the legs (t = 38.1 mm) at the maximum load was well below that for yield, so the criterion held for the experiments. If, however, the thickness required to achieve this is prohibitively large or if it is desired to run a fillet cracking test on the actual joint, some means should be developed for measuring local rigid-body displacements and rotation across the weld section. A simple solution might be recording and photographing a transparent grid and a line segment attached across the weld at its end. More elegant solutions might include Moire patterns or laser speckle
inferometry.
Welds
In an effort to produce welds with zero penetration at the root, inferior welds were made on the original 9 specimens. Due to a relatively high cooling rate of the thick steel
and no pre-heating, little fusion of the undersized weld was observed. (Note : A rule of thumb is to pre-heat if the fillet leg length to plate thickness ratio, df/t < 0.3.) Lazy-L tests were run on the original specimens, only to observe fracture at very low load loads
between the web-fillet interface. Observation of fracture surfaces showed very little fusion. Due to budget constraints, only 4 specimens could be re-worked.
Hardness tests
Because of the large leg sizes of Specimens 4, 5 and 7, accurate light load superficial hardness readings could not be taken. Further, when specimens were re-fabricated, only a small region near the weld was machined off to remove the end effect. This left no cut-off end sections (Sec.4) for hardness tests. To obtain relative hardness for the interior of the welds for all specimens, an automatic center punch was used to indent the ends and interiors. Measuring the indentation diameters with a Brinell microscope allowed comparing them with indentations made on the weld of Specimen 4, whose hardness was measured with the light load hardness test. No appreciable difference was measured between the weld indentation diameters of Specimen 4 and those at the ends and interior of other specimens. As a check, however, indentations were made on the hardened T-l steel (TS= 121 ksi by hardness) of about twice the expected tensile strength of the welds. The indentation diameters were only 15% lower than those for the fillets. Hardness test results are presented in Table 9.
7. Conclusions and Recommendations
Conclusions
1. For a proof test, the Lazy-L specimen is simple and convenient, especially if the flattening of the weaker member is evidence of acceptability. In other cases, the Lazy-L Test must be supplemented by the Lazy-T and the Inverted-y tests. (Fig. 17)
2. Limit moment , crack growth ratio, and crack direction relative to the slip line are needed to provide design and fitness-for-service data for T-joints, can be obtained at relatively low loads on full scale joints with the Lazy-L Test.
3. To fulfill the rigid leg assumption for fillet cracking tests, 38.1 mm thick legs are adequate for the limit moment required in testing 6 mm fillet welds.
4. Least upper bound limit moment predictions over-predicted the experimental limit moment for the single fillet under opening bending case by 52%. For the single fillet predominant leg shear and double fillet cases, the limit moment is under predicted by 20-40%.
5. Linear elastic fracture mechanics is reasonable to apply to the initiation of cracking in a single fillet under opening bending but the extent of total rotation compared to elastic rotation points toward a plastic analysis for crack growth.
6. Slip line displacement to initiation and crack growth factor may be found from the moment-rotation plot or from weld profiles of cracked specimens.