An Analysis of Information Complexity in Air Traffic
Control Human Machine Interaction
by
Christos George Tsonis B.S. Aerospace Engineering Georgia Institute of Technology, 2003
SUBMITTED TO THE DEPARTMENT OF AERONAUTICS AND ASTRONAUTICS IN PARTIAL FULFILLMENT OF THE REQUIREMENTS
FOR THE DEGREE OF
MASTER OF SCIENCE IN AERONAUTICS AND ASTRONAUTICS
AT THE
MASSACHUSETTS INSTITUTE OF TECHNOLOGY
Signature of
Certified by:
Accepted by:
JUNE 2006
MASSACHUSETTS INSTITUTE
@2006 Massachusetts Institute of Technology OF TECHNOLOGY
All rights reserved
JUL 1 2006
LIBRARIES
A u th o r : ... .... ... A----A ERR
Department of Aeronautics and Astronautics May 26, 2006
.... ...
Mary L. Cummings Assistant Professor of Aeronautics and Astronautics
Thesis Supervisor
Jaime Peraire Professor of Aeronautics and Astronautics Chairman, Department Committee on Graduate Students
An Analysis of Information Complexity in
Air Traffic Control Human Machine Interaction
by
Christos George Tsonis
Submitted to the Department of Aeronautics and Astronautics on May 26, 2006 in Partial Fulfillment of the
Requirements for the Degree of Master of Science in Aeronautics and Astronautics
ABSTRACT
This thesis proposes, develops and validates a methodology to quantify the complexity of air traffic control (ATC) human-machine interaction (HMI). Within this
context, complexity is defined as the minimum amount of information required to
describe the human machine interaction process in some fixed description language and chosen level of detail. The methodology elicits human information processing via cognitive task analysis (CTA) and expresses the HMI process algorithmically as a cognitive interaction algorithm (CIA). The CIA is comprised of multiple functions which formally describe each of the interaction processes required to complete a nominal set of tasks using a certain machine interface. Complexities of competing interface and task configurations are estimated by weighted summations of the compressed information content of the associated CIA functions. This information compression removes descriptive redundancy and approximates the minimum description length (MDL) of the CIA. The methodology is applied to a representative en-route ATC task and interface, and the complexity measures are compared to performance results obtained experimentally by human-in-the-loop simulations. It is found that the proposed complexity analysis methodology and resulting complexity metrics are able to predict trends in operator performance and workload. This methodology would allow designers and evaluators of human supervisory control (HSC) interfaces the ability to conduct complexity analyses and use complexity measures to more objectively select between competing interface and task configurations. Such a method could complement subjective interface evaluations, and reduce the amount of costly experimental testing.
Thesis Supervisor: Mary L. Cummings
Acknowledgements
I am forever grateful to my mother and father. Their unbounded love, support and sacrifices allow me the freedom to dream and the strength to pursue life's journeys. Thank you to my little sister for always lighting up my heart and putting a smile on my face. I thank my grandparents for their wisdom and love, and for the sacrifices they made. The love of a family has been my life's greatest blessing.
I am deeply thankful to my advisor Professor Cummings for entrusting and supporting me as her student and for the hard work put into reviewing this thesis. I am grateful for her advice and mentorship in preparation for the challenges of the professional world. I admire Professor Cummings for building and fostering the community that has become the Humans and Automation Laboratory (HAL).
Thank you to HAL post-doctoral associate Dr. Enlie Wang for advising this thesis before leaving MIT. This research would have not been possible without the grant from the FAA's Civil Aerospace Medical Institute (CAMI) entitled "Developing Measurements of Information Complexity for ATC Displays." I thank the technical monitor Dr. Jing Xing of CAMI for her ideas on complexity, and feedback on the thesis proposal and draft. Thank you to Dr. Peter Moertl of MITRE for also reviewing my thesis proposal and draft, and providing valuable feedback.
To my fellow HALiens: Jinho Jang, Paul Mitchell, Sylvain Bruni, Jessica Marquez, Liang Sim, Angela Ho, Cristin Smith, Carl Nehme, Amy Brezynski, Mark Duppen, Daniel Cunha, Chris McQuin, Stacey Scott and Jake Crandall. Thank you all for your help and for sharing this experience. Finally last but not least I thank my great office mates in 35-217: Maital Dar, Gregory Zerbib, Jonathan Histon, Stephan Langhans, Eric Jones, Mike Reyes, Celia Geslin, Georg Theis, Robin Riedel and Tony Abad.
Table of Contents
A B STRA CT ... 3 ACKNOWLEDGEMENTS ... ... 5 TABLE OF CONTENTS ... 7 LIST OF ABBREVIATIONS... I L IST OF FIGURES... 13 LIST OF TABLES...17 CHAPTER 1 - INTRODUCTION ... 19 CHAPTER 2- COMPLEXITY ... 232.1. Philosophical Discourses on Complexity... 23
2.2. Information Theory and Algorithmic Complexity...25
2.3. Complexity in Cognition and Human Factors... 27
2.4. Complexity in Air traffic Control... 30
2.5. C onclusions... 33
CHAPTER 3 - METHODOLOGY ... 35
3.1. Interface Configurations... 36
3.2. Step One: Cognitive Task Analysis...38
3.2.1. Air traffic background, tasks and interfaces...39
3.2.2. Cognitive task analysis methods... 44
3.2.2.1. Observation... 45
3.2.2.2. Think aloud method... 46
3.2.2.3. Task decomposition and information requirements...46
3.2.2.4. Cognitive process charting... 47
3.2.3. Cognitive task analysis results... 48
3.2.3.1. Description of task and interface... 49
3.2.3.2. Decomposition of task and information requirements...53
3.2.3.3. Cognitive process flow charts...54
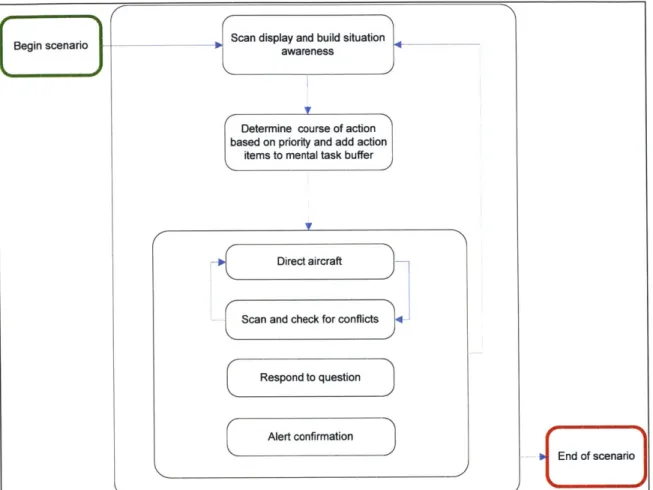
3.2.3.3.1. Primary task #1: Aircraft selection and direction...56
3.2.3.3.2. Primary task #2: Conflict detection and avoidance...61
3.2.3.3.3. Secondary tasks: Question responses and alert confirmations... ... 62
3.2.4. Cognitive task analysis conclusions... 71
3.3. Step Two: Cognitive Interaction Algorithm... 71
3.3.1. Developing the cognitive interaction algorithm...71
3.3.1.1. Algorithm syntax... 72
3.3.1.2. Cognitive interaction algorithm functions... 73
3.3.1.3. Cognitive interaction algorithm assumptions... 82
3.4. Step Three: Estimation of Complexity...83
3.5. Conclusions...89
CHAPTER 4 - HUMAN PERFORMANCE RESULTS ... 91
4.1. Experiment Motivation...91
4 .2. M ethod ... 92
4.2.1. A pparatus... 92
4.2.2. Participants and procedure... 93
4.2.3. Experimental design... 94
4 .3 . R esu lts...97
4.3.1. Egress fraction... 97
4.3.2. Question responses...98
4.4. C onclusions...101
CHAPTER 5 - COMPLEXITY METRIC VALIDATION ... 103
5.1. Experimental Scenario Cognitive Interaction Algorithms...103
5.2. Scenario Complexity Estimates... 107
5.3.2. Complexity and workload... ... 113
5.4 .C onclusion s...116
CHAPTER 6 - CONCLUSIONS... 117
CHAPTER 7 - REFERENCES...121
APPENDIX A - TABLE OF SUBTASKS AND INFORMATION REQUIREMENTS.... 127
APPENDIX B - COGNITIVE INTERACTION ALGORITHM FUNCTIONS AND C H A R TS ... 133
APPENDIX C - BASE COGNITIVE INTERACTION ALGORITHMS FOR EXPERIMENTAL SCENARIOS...147
List of Abbreviations
AET Algorithmic Execution Time AIC Algorithmic Information ContentATC Air Traffic Control
CIA Cognitive Interaction Algorithm CID Computer Identification
CNS Central Nervous System CTA Cognitive Task Analysis DSR Display System Replacement FAA Federal Aviation Administration FL Flight Level
HMI Human Machine Interaction HSC Human Supervisory Control MDL Minimum Description Length UAV Unmanned Aerial Vehicle
List of Figures
Figure 1-1. Air traffic control human-machine interface. The station shown is the Display System Replacement (DSR) used for en-route traffic operations in the USA. Photo courtesy of Federal Aviation A dm inistration (FA A )... 20 Figure 1-2. Complexity analysis procedure outline...22 Figure 2-1. Left figure displays an ordered pattern. Middle figure displays chaotic pattern. Right figure displays a disordered pattern (white noise). Grassberger (1989)...24 Figure 2-2. Graphical representation of the transformation between absolute complexity and complexity relative to the human. The reduction is the result of a large number of neural schemas that have been programmed in the human central nervous system and correspond to a transformation represented by M ... . . 2 9
Figure 2-3. Air traffic control complexity chain (Cummings & Tsonis, 2005)... 31
Figure 3-1. Outline of complexity analysis procedure... 35 Figure 3-2. Typical en-route ATC display data-blocks showing two aircraft. Data-blocks have three lines of information. The first line of text represents the flight number, the second is the altitude and the third is the computer identification number. Image courtesy of the FAA...37 Figure 3-3. Four competing interface variants. These consist of four aircraft data-block types with varying number of lines on the base layer. The first three data-blocks can be expanded to include all five lines of information. The bottommost data-block always displays five lines...38 Figure 3-4. Air traffic controllers circa 1935 tracking aircraft using small paperweights on a table top aviation chart. Image courtesy of the FAA...40
Figure 3-5. Air traffic controller interacting with a radar scope circa 1960. Image courtesy of the F A A ... . . 4 1 Figure 3-6. A ir traffic control flight phases...42 Figure 3-7. En-route DSR primary display interface screenshot. Image courtesy of the FAA... 43 Figure 3-8. The Reprogrammable Air Traffic Experimental Testbed (RATE) interface...50 Figure 3-9. Five line (top) and two line (bottom) aircraft data-blocks. The double arrowhead used to expand the data-block is shown on the right. The information included in each data-block is lab eled ... . . 5 1 Figure 3-10. Highest level overall cognitive process flow chart for representative ATC task scenario... 55 Figure 3-11. Aircraft selection and direction portion of the cognitive process...57
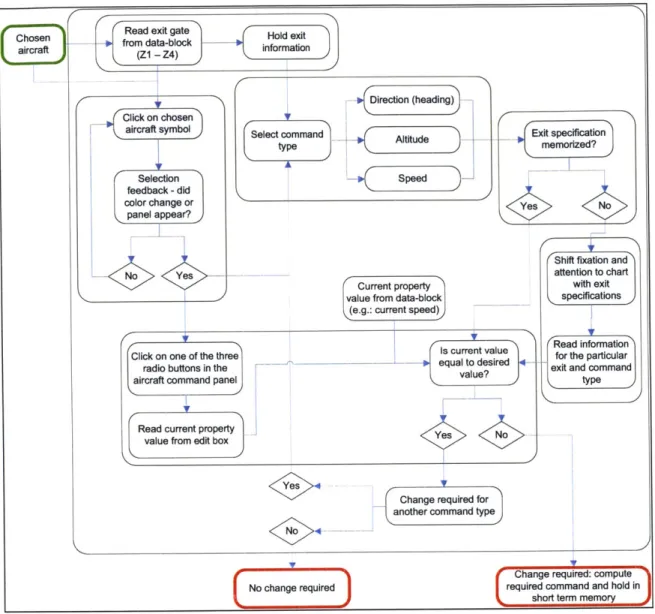
Figure 3-12. Cognitive process flow chart for determining whether a change is needed to the current
aircraft heading, altitude or speed to meet exit objectives... 59
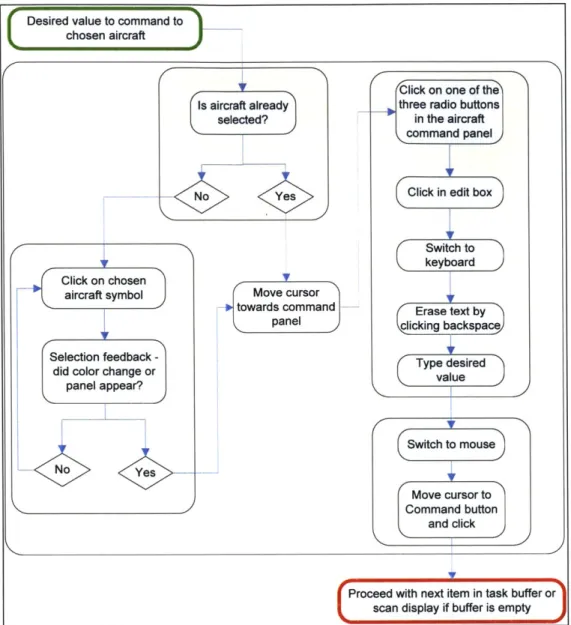
Figure 3-13. Cognitive process flow chart of issuing a known command to an aircraft...60
Figure 3-14. Cognitive process of conflict detection for a given aircraft relative to nearby aircraft...62
Figure 3-15. Cognitive process spanning from the hearing of a new question alert to the commencement of scanning for a given aircraft... 64
Figure 3-16. Cognitive process flow chart of scanning display in search of a particular aircraft flight nu m b er... . ... 65
Figure 3-17. Cognitive process chart for extraction of information from data-block with embedded in form ation ... . 66
Figure 3-18. Cognitive process chart for extraction of information from five line data-block... 68
Figure 3-19. Cognitive process chart for submitting an answer using the data-link interface...69
Figure 3-20. CIA functions called by heading command... 75
Figure 3-21. CIA functions called by moving cursor, moving hand, moving eyes, typing and reading.. .76
Figure 3-22. Functions called by the CIA function describing the process of gathering new question in form ation ... 7 7 Figure 3-23. CIA functions called by the two find flight functions...78
Figure 3-25. CIA functions called by the data-block information extraction functions. The above figure is for the three line data-block... 81
Figure 3-26. CIA functions called by the data-block information extraction functions. The above figure is for the four line data-block... 81
Figure 3-27. CIA functions called by the data-block information extraction functions. The above figure is for the five line data-block... 82
Figure 3-28. Structure of base CIA for the two-line data-block configuration. The numbers on the lines indicate the number of times each CIA function is called from the base algorithm...86
Figure 3-29. Complexity estimates for each interface configuration... 88
Figure 4-1. The RATE interface displaying a screenshot from a scenario with high aircraft count and three line data-block. Flight NWA485 is selected... 72
Figure 4-2. Sector exits and rules. An aircraft entering through one of the four quadrants was required to exit through one of the other three, at the altitudes and velocities shown above...94
Figure 4-4. Box plot of mean number of correct responses for each data-block type...99 Figure 4-5. Box plot of question response accuracy versus number of aircraft...100 Figure 4-6. Estimated question response times for each data-block type at two levels of aircraft count...101 Figure 5-1. CIA functions called by scenario 112. Numbers denote the frequency with which each of the fun ction s is called ... 104 Figure 5-2. Cognitive interaction algorithm MDL complexity estimates for each of the sixteen
experim ental scenarios... 109 Figure 5-3. Normalized MDL complexity estimate for (A) each question distribution and (B) each data-b lo ck ty p e ... 1 10 Figure 5-4. Normalized complexity and normalized egress fraction versus (A) data-block type, (B) question distribution and (C) number of aircraft...112 Figure 5-5. Normalized complexity and normalized correct responses versus (A) data-block type, (B) question distribution and (C) number of aircraft...114 Figure 5-6. Normalized complexity and normalized question response time versus (A) data-block type, (B) question distribution and (C) number of aircraft...115
List of Tables
Table 3-1. Subtask time measurements and categories... 48
Table 3-2. Portion of table containing a hierarchical task breakdown and information requirements. Entire six page table is included in Appendix A... 54
Table 3-3. Command execution time by command type...61
Table 3-4. Average extraction time for information on each line for each data-block type. Shaded cells represent embedded extraction times for embedded information... 70
Table 3-5. Average time to locate aircraft flight on radar display for two levels of aircraft...70
Table 3-6. Description of symbols used in CIA... 72
Table 3-7. List and description of CIA functions...74
Table 3-8. Summary of CIA functions with complexity estimates for each function and algorithmic execution tim es... . . 85
Table 3-9. Number of calls of each CIA function for example configurations. These cells include the ni values that enter the complexity equation (Equation 3-1)...87
Table 3-10. Data-block complexity estimates computed by Equation 3-1... 87
Table 4-1. Independent variables and factor levels... 95
Table 4-2. Percentage of time that operators have to click in the data-blocks in order access a piece of information and number of questions per data-block line under each question distribution level...96
Table 4-3. Summary of dependent variables... 96
Table 5-1. Scenario code legend specification and nominal event decomposition per scenario...104
Table 5-2. CIA functions including complexity estimates, algorithmic execution time estimates and number of calls for each of the sixteen scenarios... 107
1. Introduction
Computer and display technologies have matured to a stage where the presentation of information is no longer primarily limited by the technology's ability to process information, but by the human's. More simply put, today's technology allows for a practically unbounded number of configurations for presenting information on a computer display to a human. It is known however that humans have inherent neurophysiologic information processing limits (Cowan, 2001; Kandel, Schwartz, & Jessel, 2000; Miller, 1956; Norman & Bobrow, 1975; Rasmussen, 1986; Wickens & Hollands, 2000) which must be accounted for in the technological design. These essentially correspond to complexity limits at various stages of information processing that physically occur within the central nervous system (CNS).
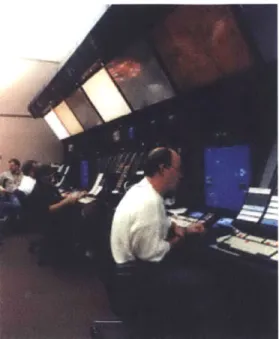
In many areas of complex interface development, such as air traffic control (ATC), designers could benefit greatly from a structured and practical analytical method for quantifying complexity in order to select between competing interface and task options. A typical ATC interface is shown in Figure 1-1. While there are many factors exogenous to the interface that ultimately contribute to the complexity of human information processing, including environmental and organizational factors, the interface itself can add to the complexity if not carefully designed (Cummings & Tsonis, 2005). In the ATC domain, the complexity imposed on the individual controllers ultimately limits the air traffic capacity and can increase the economic cost of operation of the ATC system. While a successful method for quantifying the complexity of an interface could be applied in a number of domains, in ATC it could lead to the implementation of improved interfaces which could result in a combination of improved safety, increased controller productivity and airspace capacity, reduced system costs, and reduction in training time
Figure 1-1. Air traffic control human-machine interface. The station shown is the Display System Replacement (DSR) used for en-route traffic operations in the USA. Photo courtesy of Federal Aviation Administration (FAA).
In order for a technological interface to achieve its full system performance potential, be operated safely, and at the same time require the least amount of operator training and cost, complexity of the human-machine interaction process must be minimized subject to certain constraints. The engineer designing the human-machine interface is confronted with the challenge of deciding how to most effectively present the information and design the task in a way such that the human can accomplish the required goals accurately and efficiently. An engineer faced with competing design options should be able to ensure that the information complexity relative to the human is low enough to allow for the goals to be accomplished efficiently.
While increased interface complexity due to a poor design can be addressed to some degree with additional training, this is oftentimes counterproductive and costly. A preferable solution would be to provide the engineer with a tool for quantifying the complexity of competing interface and task configurations prior to delivering the technology to operators. This measure can then form the basis of more objective design choices. Such a tool would also be of value when deciding upon the acquisition of competing technological interfaces, such as ATC or unmanned aerial vehicle (UAV) workstations.
This thesis therefore proposes a practical, theoretically based methodology for quantifying information complexity in human-machine interaction. The chosen definition of complexity stems from information theory. Although the definition is elaborated upon
in Chapter 2, complexity is defined as the (minimum) amount of information required to
describe an object' in some fixed description language (Gell-Mann & Lloyd, 1996; Shannon, 1948). This complexity analysis methodology expresses the interaction process between the human and the machine as an algorithm based upon results of a cognitive task analysis (CTA). This algorithmic scripting of information between the human and interface is named the cognitive interaction algorithm (CIA). Complexity can then be estimated by algorithmic information content (Cover & Thomas, 1991) or by some minimum information content such as Kolmogorov Complexity (Li & Viftinyi, 1997).
The complexity analysis methodology is summarized in Figure 1-2. It first proposes the application of a CTA for breaking down the task and eliciting cognitive processes for a given interface configuration. Based on the knowledge acquired from the CTA, the CIA is written. In this thesis the estimates of complexity are provided by the algorithmic information content (AIC), and the compressed algorithmic length (representative of minimum description length) of the CIA. This yields a numeric value for a specific task and interface configuration. In order to evaluate the validity of the methodology, the resulting complexity measures generated for each task and interface configuration are compared to the performance results obtained from an experiment conducted with United States Navy ATC trainees engaged in a basic en-route ATC vectoring task. Based on this comparison it is determined whether the complexity analysis performed to examine the effect of different display configurations is a successful predictor of operator performance.
Complexity Analysis Procedure Outline
Analyze and break down the task for a given interface configuration
2 Express interaction as the Cognitive Interaction Algorithm (CIA)
3 Estimate the complexity of the algorithm
4 Repeat I through 3 for other configurations
5 Compare the complexities of competing configurations
Figure 1-2. Complexity analysis procedure outline
This thesis is organized into five chapters following this introduction. In Chapter 2 the literature in the complexity field is reviewed with a particular emphasis on complexity in information processing and ATC. Chapter 3 describes the methodology in detail. It begins with a discussion of typical ATC tasks and interfaces and then the ATC task which forms the basis of the validation of this methodology is analyzed by a CTA. The CIA functions are devised and presented in Chapter 3, and the method for estimating complexity is illustrated.
The experimental methods used to measure performance on the ATC task are described in Chapter 4 along with the associated experimental results. Chapter 5 compares the performance measures to the complexity estimates obtained from the methods described in Chapter 3. Finally the results are summarized and final conclusions are drawn in Chapter 6. This chapter also includes a discussion on potential limitations and shortcomings, as well as recommendations for future work.
2. Complexity
Complexity is cited extensively throughout the literature in a variety of fields and disciplines and affects many aspects of science, engineering and technology integration (Bar-Yam, 1999). Merriam-Webster dictionary defines complexity as "composed of many interconnected parts; compound; composite. a complex system" (2001). In this chapter relevant complexity literature is reviewed. The review is structured to go from a broad to more specific focus and is sectioned into the following components:
* Philosophical discourses on complexity
" Information theory and algorithmic complexity e Complexity in cognition and human factors * Complexity in air traffic control
The chapter discusses methods proposed to measure complexity, with a particular emphasis on previous work regarding measures of complexity in ATC and human-machine interaction. This chapter concludes by providing the rationale for the chosen complexity definition.
2.1. Philosophical Discourses on Complexity
The complexity review begins at the epistemologically broadest level with the discussion of complexity from a philosophical perspective. Many efforts have been made to provide comprehensive definitions of complexity. A noteworthy example is the work of Edmonds (1999a; 1999b) who conducted a detailed study on the syntactic origins of complexity. In this work he defines complexity as "that property of a language expression which makes it difficult to formulate its overall behaviour even when given almost complete information about its atomic components and their inter-relations." An important consequence of this definition is that it relays the difficulty in formalizing something complex based solely on the understanding of its fundamental parts.
Grassberger (1989) positions complexity somewhere between order and disorder. He considers three diagrams similar to those in Figure 2-1. The human generally judges the middle as the most complex. The given reason is that humans interpret the image on the right as an object with no rules. If describing the images at the level of each pixel however, the amount of information required to objectively and fully describe the rightmost figure is greater. Therefore rather than highlighting that complexity lies somewhere between order and disorder, this example emphasizes that complexity is relative to the language of the observer. More specifically complexity is relative to the language of description used by the observer to decode the object. The language of description is the set of characters, conventions and rules used to decode and convey information. By the language of description used by the human to perceive the figures, the description of the middle figure requires the most information. The human representation of the middle figure has the least pattern redundancy and has a larger description length than the other two.
Figure 2-1. Left figure displays an ordered pattern. Middle figure displays chaotic pattern. Right figure displays a disordered pattern (white noise). Grassberger (1989).
In the extensive complexity review conducted by Xing & Manning (2005), they conclude that the concept of complexity is ultimately multi-dimensional and cannot be sufficiently described with a single measure. They identify three dimensions of complexity: number, variety and rules. Number refers to the numeric size of the elements in a system and variety refers to the diversity of elements within the system. Rules govern relationships between system elements. Their work was conducted for the purpose of reviewing techniques which could be applied to the complexity analysis of ATC displays. Further discussion is thus reserved for subsequent sections.
While philosophical discourses of complexity are of interest for conceptual understanding, they are inherently subject to linguistic ambiguity. This limits their direct applicability as a basis for a quantitative metric in engineering. This is less of a problem with the more mathematical based methods reviewed in the following section. However a most important point drawn from the philosophical discourse is that complexity necessarily depends on the language that is used to model the system (Edmonds, 1996). Therefore any measure of the complexity of human-machine interaction is dependant upon the language chosen to describe the interaction process. In the proposed
methodology the description language is the cognitive interaction algorithm.
2.2.
Information Theory and Algorithmic Complexity
Information theory originated in the late 19th Century when mathematical
formulae were developed to measure entropy in thermodynamic processes (Gell-Mann & Lloyd, 1996). Thermodynamic entropy effectively measures uncertainty about the microscopic state of matter. Because information serves to reduce uncertainty, the mathematical formula proposed by Claude Shannon (1948) to define information was essentially the same as that which measured entropy2. Shannon's formula for the entropy of a discrete message space is shown below.
I(M) = - Yp(m)log(p(m)) (E.2-1)
meM
Equation 2-1 computes the information (I) contained in a set of messages (M), as a function of the probability (p) with which each message (m) in set M is communicated. The term log(p(m)) is the self-information of message m. Prior to Shannon's contribution, information content of a message was oftentimes measured by the number of letters or other symbols needed to convey it.
Stemming from the seminal work of Shannon (1948), information theorists have provided measures of complexity, as they relate to communication and algorithms. Perhaps the most notable of such measures is that developed by Russian mathematician Andrei Kolmogorov and known as Kolmogorov Complexity. One definition defines
Kolmogorov Complexity as "the minimum number of bits into which a string can be
compressed without losing information" (Black, 1999). In other words the complexity of a string is the length of the string's shortest description in some fixed description language. For a rigorous mathematical definition, and comprehensive resource on Kolmogorov Complexity, the reader is referred to the work by Li & Vitanyi (1997).
The principle of minimum description length (MDL) is related to Kolmogorov Complexity. MDL has its origins in the work of Shannon (1948; 1964) however Rissanen (1978) was the first to formally formulate the idea. The general idea behind MDL is that any regularity in a given set of data can be used to compress the data. The MDL principle is a formalization of Occam's Razor (Blumer, Ehrenfeucht, Haussler, & Warmuth, 1987; Kaye & Martin, 2001) in which the best hypothesis for a given set of data is the one that leads to the largest compression of the data (i.e. the description with the lowest complexity). The vast majority of applications of MDL are for model reduction and statistical inference, and used within the computer science field. As MDL captures the minimum amount information required to describe a system it inherently measures information complexity. A larger MDL corresponds to a larger complexity. For a detailed review of the theory and current applications of MDL, the reader is referred to the recent work compiled by GrUnwald, Myung & Pitt (2005). For simplicity in this thesis MDL (and thus complexity) is approximated by the compressed information content of an algorithm (the CIA).
The application of information theoretic formalisms to problems of human machine interaction has thus far had limited success. A notable exception includes Fitt's Law (Fitts, 1954), which applies information theory to provide a quantitative model for analyzing the trade-off between the accuracy and speed of human motor movements as a function of end point target size. The general failure to connect information theoretic formalisms to human-machine interaction is of course partly due to the sheer complexity of human information processing. In addition human information processing is generally not expressed in a formal language by human factors researchers, something which limits the applicability of more systematic and quantitative predictive methods. The application of information and algorithmic theoretic analysis techniques to human-machine interaction could be simplified if human information processing and machine interaction
formalism to the description of the human information processing involved during human-machine interaction, such that quantitative analysis techniques can be applied.
2.3.
Complexity in Cognition and Human Factors
The section begins with the general discussion of complexity in cognition and then continues with a discussion of complexity in human factors. The definition which best connects cognition and complexity is that by Godfrey-Smith (1996). He states that "the function of cognition is to enable the agent to deal with environmental complexity" (Godfrey-Smith, 1996). In this thesis the relevant agent is the human. The environment is formed by the machine interface and the information arriving through the interface.
Cognition is performed within the central nervous system (CNS) which has the brain at its core. On the cellular level the brain is composed of approximately 10" neurons and an even greater number of glial cells. These cells form the basis of the neural circuitry of the central nervous system (CNS). The CNS is described by Pinker as a complex computational device that transforms information in rule-governed, algorithmic ways (Pinker, 1997). The specialized neural circuits contained within the CNS make up systems which are the basis of perception, action, and higher cognitive functions, including consciousness (Kandel, Schwartz, & Jessel, 2000; Pinker, 1997).
Xing (2004) relates neural science to complexity and provides examples of certain areas of the brain and their functions as they relate to a human interacting with an ATC interface. She outlines the functions of areas of the brain involved with information processing stages of perception, cognition and action. The visual cortex performs perceptual tasks that include target searching, text reading, color detection, motion discrimination and many others. Typically part of this information is then transmitted to the associational cortex and combined with elements of long term memory. Among others, the cognitive functions of working memory, text comprehension and planning occur in the associational cortex. According to Xing (2004) the bandwidth of the cognitive stage is much less than that of the perceptual stage. The pre-motor and motor cortical areas encode voluntary body movements, such as those of the eye or hands. The motor cortex, which enables the action phase of the information processing loop, is
believed to process information in a serial manner, and consequently has a narrower bandwidth than both the perceptual and cognitive stages (Xing, 2004).
As alluded to in the previous paragraph, the neural networks in the human brain have limited bandwidths, as is the case with any communication medium. In other words, there are limits to how much information can pass through these neural circuits in a given amount of time. If these information limits are exceeded, information is lost and performance on a task likely drops. These limits in information throughput are equivalent to complexity limits. In order to process any incoming information signals, the human CNS must perform neural computations to reduce information complexity. Incoming information to the human, such as that from a display, which has a certain absolute complexity, acts in conjunction with a large number of neural schemas3. These neural schemas are essentially adaptive complexity transformers that serve to transform and reduce the incoming absolute state of information complexity to levels which the human is able to process effectively.
The simplified relationship between absolute complexity and complexity relative to the human is shown graphically in Figure 2-2. The equation describing this transformation is shown below.
Khuman - M Kabsolute (2-1)
In Equation 2-1 Khuman is the complexity relative to the human, M is the transformation
and K absolute is the absolute complexity. The matrix M is purely a property of the CNS and
is constructed through learning and genetic preprogramming. The term Khuman is the complexity of the computations that occur in the CNS and is that component of complexity which this proposed methodology attempts to capture. The quantity Khuman
must not be confused with perceived complexity. Perceived complexity is the conscious (subjective) component of Khuman - The term Kabsolute contains all the information required to fully describe the environmental input signal. Equation 2-1 is shown mostly for
It is important to note that the term neural schema is chosen because it is physically more accurate than the similarly used definition of mental model, originated by Craik (1943). For more information on neural
conceptual reasons, and it is not intended at this stage for the mathematical properties of the transformation to be defined.
Information Conmplexity
Absolute Information
Rm~iv
n
Humpn
Compl~ityRelative
to
Human
C~omplexity __________Reductive
Kc
absolute humanTransformation
()
of
Information
Compiexity
Figure 2-2. Graphical representation of the transformation between absolute complexity and complexity relative to the human. The reduction is the result of a large number of neural schemas that have been programmed in the human central nervous system and correspond to a transformation represented by M.
In terms of complexity in human factors, Miller (2000) makes a distinction between perceived and actual complexity. He defines perceived complexity as the "phenomenon of being difficult to understand or deal with." He further decomposes perceived complexity into three dimensions: component complexity, relational
complexity and behavioral complexity. Component complexity is the number and
diversity of components that the human perceives a system to have. Relational complexity refers to the number and variety of the links between components. Finally behavioral complexity refers to the number and variety of perceived states or behaviors that the system can exhibit. An increase along any of the dimensions results in an increase in complexity. According to Miller, increased complexity results in an increase in workload and/or unpredictability of the system. This motivates the need to quantify it in order to be able to compare the complexity of competing human-machine interfaces.
Miller's complexity breakdown is similar to the categorical breakdown of complexity developed by Xing & Manning (2005). As already mentioned they arrive at the conclusion that the key elements of complexity are number, variety and rules (Xing, 2004; Xing & Manning, 2005). The added point relevant to this subsection is that complexity is the result of crossing the elements of complexity with the three stages of
human information processing identified by Xing (2004). These stages consist of perception, cognition and action.
Another reference that relates to this discussion is the review of visual complexity by Donderi (2006). As part of this extensive review Donderi first covers structuralism and Gestalt psychology and continues by reviewing the topics of visual complexity theory, perceptual learning theory and neural circuit theory. A goal of his review is to help establish the theoretical basis for measures of complexity in human factors. In his earlier work Donderi (2003) uses compressed computer image sizes for measuring the visual complexity of a display. While he does not directly propose a general measure of complexity in HMI, he concludes his review by stating that "minimizing visual complexity, while respecting the requirements for the task, should maximize task performance."
In summary, the human brain is conceptually a computational device which employs neural schemas to reduce complexity of the incoming information. This reduction of complexity is required so that the human can successfully interact with the surrounding environment. Minimizing complexity should maximize human performance on a task. In this thesis, all stages of CNS information processing will be categorized as cognition.
2.4. Complexity in Air Traffic Control
Air traffic control complexity is a critical issue, particularly in light of expected forecasts of increased air traffic volume. Complexity has been attributed as the primary cause for the deployment failure of the FAA's Advanced Automation System after an expenditure of $US 3-6 billion over a period of twelve years (Bar-Yam, 1999). This complexity can arise from a variety of sources, categorized by Cummings & Tsonis (2005) as environmental, organizational and display (or interface). Figure 2-3 shows the cascading complexity chain illustrating the decomposition of complexity as it applies to complex systems such as ATC.
In ATC, capacity is in great part limited by the cognitive complexity imposed on the individual controller. Extensive work has been conducted to quantify complexity in
complexity where they identify methods for extracting complexity factors from controllers. In general the majority of ATC complexity has focused on quantifying the complexity imposed on the controller by the air traffic itself, and not the complexity associated with the interface or the entire interaction process.
Complexity Mitigation
Figure 2-3. Air traffic control complexity chain (Cummings & Tsonis, 2005).
A significant portion of ATC complexity work has been the set of ATC complexity metrics known as dynamic density (Kopardekar, 2003; Laudeman, Shelden, Branstrom, & Brasil, 1998; Masalonis, Callaham, & Wanke, 2003; Sirdhar, Seth, & Grabbe, 1998). These measures attempt to capture, weigh and sum numerous driving variables of air traffic complexity to arrive at a numeric real-time metric of ATC complexity. These variables include such entities as number of aircraft, spacing distances, number of speed changes (Majumdar & Ochieng, 2002), and were selected because they were statistically deemed predictive of controller workload.
A smaller amount of work has focused on estimating the complexity imposed on the human controller due to the decision support interfaces intended to aid with the control and supervision of air traffic. As introduced previously, Xing & Manning (2005) cross the components of complexity (number, variety, and relation) with the three stages of human information processing (perception, cognition, and action). This generates a 3x3 matrix which forms the basic framework of their proposed ATC display complexity metric. The idea is that if general human limitations for each cell in the matrix could be
established then these results could be used as a point of reference for evaluating the complexity of ATC interfaces. To date the question of how to establish the general limits and how to fill the cells of this matrix has not been addressed in the literature.
While decomposing complexity of an ATC interface into number, variety and relation is reasonable, there are more concise and precise ways to define and capture complexity. For example MDL4 is able to precisely capture the consequences of all of the above three elements with greater parsimony. For example given two system descriptions with equal number, the system description with large variety is inherently less compressible than the element with less variety, and hence has a larger MDL. This is due to the smaller amount of repetitious and redundant information that is present. This is shown with the simple example of the two binary strings in Figure 2-4.
String (A)
101010101010101010101010
String (B)
110100011010011101010010
Figure 2-4. Two binary strings.
The top string A has a minimum description length in the English language of "twelve repetitions of 10". String B cannot be compressed to that degree, and would required one to express each digit. Hence by the MDL definition of complexity, String A is less complex than string B even though they have the same length. If strings A and B were abstract representations of controller, interface and traffic situations A and B respectively, it would be concluded that situation A is less complex than B. Any relations between elements would also necessitate additional descriptive information but could serve to either reduce or increase the MDL. Given two measures which capture complexity equally, the simplest is the most preferable.
The ability to capture complexity is important in ATC because ATC administrators require objective and quantitative methods to predict and assess human limitations and performance on new technology. A complexity metric would provide a more objective aid for deciding between options in the acquisition of new technology. Furthermore it would provide an objective "check" to subjective ratings that controllers
use to rate technological configurations. Objective complexity metrics would allow designers of technology to predict how competing interface configurations could affect the end user, while reducing the amount of more costly usability and evaluation trials.
2.5.
Conclusions
After reviewing numerous definitions of complexity, the revised definition developed for the context of measuring complexity in human machine interaction is:
Complexity is defined as the (minimum) amount of information required to describe the human-machine interaction process in some fixed description language and chosen level of detail.
In this work the proposed description language is the CIA. The CIA represents human information processing and includes the actions involved in the execution of a task using a given machine interface. The above definition is consistent with complexity in information theory and similar to effective complexity defined by Gell-Mann & Lloyd (1996). The chosen definition also parallels the general definition of Bar-Yam who defines complexity as the amount of information necessary to describe a system (Bar-Yam, 1997). The selected definition also parsimoniously captures the consequences of each of the complexity elements of number, variety and rules, or any similar such categorical breakdown6. A final advantage of the selected definition of complexity is its
simplicity, which makes it easier for it to form the basis of a quantitative metric. Complexity (as defined here), is estimated by the information content of an algorithm (CIA) for different task and interface variants. As is discussed in greater detail in the subsequent sections, in this thesis information is quantified by two measures: the algorithmic information content (AIC) and the compressed algorithm size which is representative of MDL.
5 He also notes that this is dependent upon the level of detail of the system description
3. Methodology
The purpose of this chapter is the presentation and detailed discussion of the complexity analysis methodology first outlined in Chapter 1 (Figure 3-1). The analysis is applied to an experimental ATC interface and task that was developed for the purposes of examining performance consequences of different interface variants.
The methodological steps in the proposed complexity estimation method are shown in Figure 3-1. Once competing interface configurations have been identified, the first step in the procedure consists of a CTA of the representative ATC task. The motivation for conducting the CTA is that it provides knowledge regarding operator information processing. This knowledge forms the basis for the CIA functions which are formulated relative to an assumed representative operator.
Complexity Analysis Procedure
[utline
I Analyze and break down the task for a given interface configuration
2 Express this interaction as the Cognitive Interaction Algorithm (CIA)
3 Estimate the complexity of the algorithm
4 Repeat I through 3 for other configurations
5 Compare the complexities of competing configurations
Figure 3-1. Outline of complexity analysis procedure
The second step consists of writing the CIA functions for the various interaction processes. The ultimate purpose for expressing the interaction process as an algorithm (the CIA) is such that the information complexity can be quantified. In order to fulfill this process, a core CIA is created for each interface configuration and the nominal user
interaction. The core CIA is the highest level script of what typical occurs in each assumed scenario and are the algorithms from which all CIA functions are called. The CIA functions represent cognitive and task subprocesses that the operator performs (eg: moving the cursor). In Step 3, the method and equation for estimating overall complexity from the algorithms, is applied to example interface variants for an assumed nominal task. While the purpose of this chapter is to outline the methodology, Chapters 4 and 5 present additional task factors and validate the predictive capacity of the complexity measures (for the given interfaces and tasks).
3.1. Interface Configurations
This complexity estimation methodology is applied in order to quantify and compare complexity between different interface configurations. It is important to emphasize that interface configurations depend upon the context under which they are used and thus cannot be compared independent of a task. For example the complexity of a computer keyboard depends upon the message being typed and not only on the keyboard itself. It is therefore necessary to establish a nominal scenario which describes how the human interacts with the interface. Only within the context of an assumed scenario can the complexity of the different interface configurations be correctly assessed.
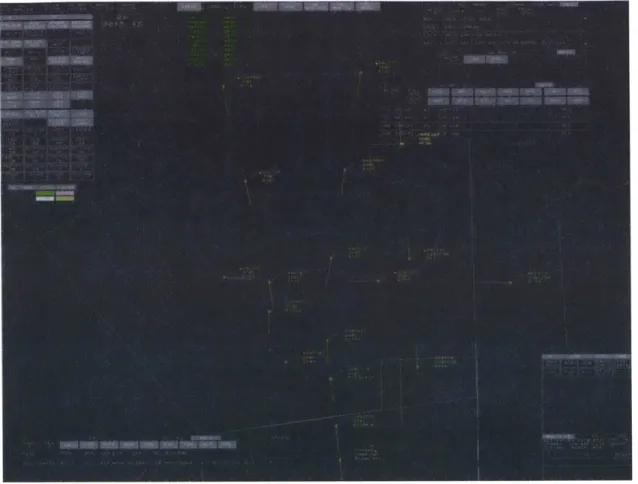
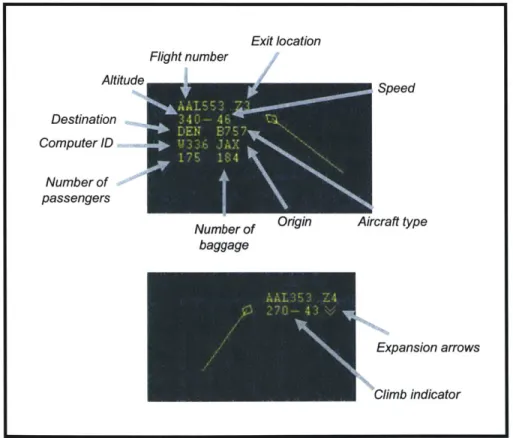
As an example illustration of the complexity estimation methodology, four variants of en-route ATC aircraft data-blocks are compared. Data-blocks are interface elements on the display which contain alphanumeric and graphical information pertinent to each target aircraft. They are located beside the actual aircraft position on the display, and controllers extract information from these in order to perform their tasks. This information typically includes such information as altitude, speed, heading, and flight and identification numbers. A screenshot of a typical data-block from an actual en-route ATC display is shown in Figure 3-2.
Figure 3-2. Typical en-route ATC display data-blocks showing two aircraft. Data-blocks have three lines of information. The first line of text represents the flight number, the second is the altitude and the third is the computer identification number. Image courtesy of the FAA.
The four example data-block variants, to which the complexity estimation methodology is applied, are shown in Figure 3-3 and vary by the amount of information that each has on the base layer. The data-blocks with fewer than five lines on the base layer are expandable to display all five lines. In the cases with fewer than five lines visible, the rest are made visible by clicking on a double arrowhead. Each click displays one extra line.
From an application perspective, an ATC organization such as the FAA would want to identify any potential consequences of changing the number of lines on the performance of controllers. This is especially relevant as more information becomes available with an increased number of sensors and higher communication bandwidths and decisions must be made on how and where to present that additional information.
2 Line Data-Block
3 Line Data-Block
4 Line Data-Block
5-Line Data-Block
Figure 3-3. Four competing interface variants. These consist of four aircraft data-block types with varying number of lines on the base layer. The first three data-blocks can be expanded to include all five lines of information. The bottommost data-block always displays five lines.
The simulated interface and associated representative tasks are discussed in depth within the following section as part of the CTA.
3.2. Step One: Cognitive Task Analysis
The purpose of the CTA in this complexity estimation methodology is to elicit and present a high level approximation of the information processing that occurs within the human CNS as an ATC task is carried out using a given interface. Since this methodology is intended for applications to problems of human-machine interaction in ATC, a task-analytic overview of actual ATC operations is provided and framed within a historical context. Existing CTA techniques are then briefly reviewed in order to establish an understanding of available methods and the techniques applied. Following this, a representative experimental ATC task and interface is described. The final CTA step is the presentation of the resulting cognitive process charts and a description of the steps and procedures involved in carrying out the ATC task.
3.2.1. Air traffic control background, tasks and interfaces
The safe and expeditious movement of air traffic requires the coordination of an enormous number of human, technological and economic resources. The infrastructure and capability to efficiently and safely move people and goods by air is one most valuable economic assets of a nation. The Air Traffic Action Group reported in 2005 that the air transportation industry contributes 880 billion U.S. dollars annually to the cumulative global gross domestic product (The economic and social benefits of air transport, 2005). Central to ATC operations are air traffic controllers who are responsible for separating and directing aircraft to their destinations. The tasks that controllers perform have changed over the past eighty years, driven by several technopolitical7 milestones and a steady surge in commercial air traffic (Burkhardt, 1967; Heppenheimer,
1995).
In the early years of ATC, controllers manually tracked aircraft on maps using small paperweights (called "shrimp boats"), as shown in Figure 3-4. These tools provided one of the first ATC interfaces, and subsequent technological evolution and implementation was aimed at eliminating the limitations imposed by these tools. Although at that time controllers had no direct radio link with aircraft, they used telephones to stay in touch with airline dispatchers, airway radio operators, and airport traffic controllers. These individuals fed information to the en-route controllers and also relayed their instructions to pilots.
7 Technopolitical milestones include such things as key congressional acts (e.g.: Air Commerce Act) and
Figure 3-4.Air traffic controllers circa 1935 tracking aircraft using small paperweights on a table top aviation chart. Image courtesy of the FAA.
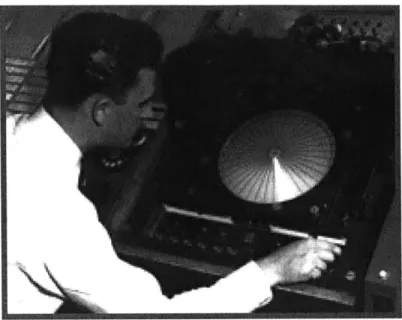
The radar8 which was first introduced in 1952 in the United States was the technology that enabled significant increases in controlled traffic capacity (Nolan, 2004; Skolnik, 2001), but also added a new layer of complexity. It was the first technology that presented controllers with a relatively accurate approximation of the aircraft's position at a given time. Although greatly improved over the past 50 years, this technology still forms the foundation of today's air traffic management systems. Information from the radar is presented to the human via the scope, which is the primary tool used by controllers to support their tasks. Radar scopes have evolved from their early days (Figure 3-5), and now include automation aids and tools which the controller can leverage. Current ATC interfaces in the United States resemble that shown in the introduction (Figure 1-1). Many relics of previous systems are carried over to new systems however. One such example is the display of radar sweeps on screen, something not necessary with modem displays. Resistance to change is partly because of the potentially high risk of radical changes in such a safety critical domain. It is also due in part to controller resistance to technological implementations which could replace their own skills.
Figure 3-5. Air traffic controller interacting with a radar scope circa 1960. Image courtesy of the FAA.
Current ATC operations are typically broken down into several phases. The first phase begins with the aircraft on a taxiway. A subset of controllers, typically located in a control tower, are responsible for surface traffic, ensure that aircraft taxi to their runways in an orderly fashion and do not progress onto runways unless provided with a clearance. These controllers issue clearances for take-off. Once the aircraft is airborne, a terminal control center soon assumes responsibility for that flight, vectoring the aircraft away from the airport safely. Once the aircraft has climbed and is at some distance from the terminal area, responsibility for the flight is handed off to en-route controllers who monitor the high altitude traffic flows and issue commands to pilots as required. As a flight nears its destination airport and descends, responsibility is handed back to the terminal controllers who ensure a clear approach. Finally control is yielded back to the tower who clears the runway and return taxi. A profile of the flight phases is shown in Figure 3-6.
Terminal Terminal
control control
Iower .0 En-route control Tower
controlcontrol
* *.
4 ; 0000 0
Figure 3-6. Air traffic control flight phases.
The representative task and interface to which this complexity analysis methodology is applied replicates en-route ATC characteristics. Typical en-route ATC operations consist of directing and ensuring separation of aircraft flying at high altitudes. In the USA, the national airspace is sectioned into twenty-two air route traffic control centers (ARTCC), each broken down into several dozen sectors. One controller is generally responsible for a single sector, although in many cases is assisted by an additional person. Controllers accept aircraft from neighboring en-route sectors and then must hand them off once they have traversed their sector. As aircraft fly through the sector, controllers must ensure adherence to a set of separation standards that define the minimum distance allowed between aircraft. Furthermore controllers attempt to expedite the flow of traffic such that airlines can minimize flight time and fuel consumption.
In the USA the most recent en-route control interface implemented is the Display System Replacement (DSR), manufactured by Lockheed Martin. The DSR station is shown in Chapter 1 (Figure 1-1) and includes
e A primary 20"x 20" color display (radar) with trackball and keyboard
* A 15" secondary color display (data) with flight strip bays and keyboard input * An auxiliary 15" display with flight strip bays, printer and keyboard input
A screenshot of the primary display is shown in Figure 3-7. The experimental interface developed for this research was modeled on this system.
Figure 3-7. En-route DSR primary display interface screenshot. Image courtesy of the FAA.
Air traffic controllers have skills and knowledge that are the result of extensive training and practice. Their preparation includes a four year FAA approved education program, twelve weeks of operational training, followed by two to four years of practical training within an ATC facility (Bureau of Labor Statistics, 2006). Reducing the complexity of ATC interfaces and tasks has the added benefit of reducing this long preparation time.
For ATC tasks controllers generally command inputs via a trackball and keyboard, observe visual information from the primary (radar scope) and secondary displays and communicate with aircraft via a headset which they must key in order for their communication to be aired. Controllers must make both spatial and temporal mental projections based on multiple aircraft and follow numerous standardized procedures and regulations. They track targets and comprehend and project the location and behavior of aircraft in the three spatial dimensions in addition to the dimension of time. In most circumstances they also communicate with controllers who support them, as well as
supervisors and controllers of other sectors. In performing these tasks and interacting with these technologies and other humans, controllers process information using neural schemas and mental computations that result from years of training. The information processing of controllers has been the subject of a large body of research (e.g., Majumdar & Ochieng, 2002; Mogford, 1997; Seamster, Redding, Cannon, Ryder, & Purcell, 1993). The following section discusses the CTA methods which were applied to the representative ATC task.
3.2.2. Cognitive task analysis methods
Cognitive task analysis (CTA) is an umbrella term encompassing a variety of methods and techniques that serve to break down and extract the cognitive processes and physical actions which a human performs in the accomplishment of a set of goals and tasks. Cognitive task analyses are practical tools that have the general purpose of methodically breaking down a human-machine interaction process into numerous
interconnected subtasks.
A variety of CTA techniques have been developed, applied and reported in the human factors research and development community (Annett & Stanton, 2000; Diaper &
Stanton, 2004; Hackos, 1998; Schraagen, Chipman, & Shalin, 2000). CTA techniques include numerous methods for extracting information, including observation, interviews and surveys as well as examination of verbal communications between team members, think aloud methods, diagramming methods and psychological scaling methods (Seamster, Redding, & Kaempf, 1997).
Several methods have been applied to problems of human machine interaction in the aviation community, including ATC (Seamster et al., 1997). For example Seamster et al. (1993) conducted an extensive CTA study to specify the instructional content and sequencing for the FAA's en-route ATC curriculum redesign. This analysis attempted to capture knowledge structures, mental models, skills and strategies of en-route controllers in order to provide an understanding of the key components of the controller's job. As a result, Seamster and his colleagues identified thirteen primary tasks, presented a mental model of the controllers' knowledge organization, categorized controller strategies, and