HAL Id: hal-02450319
https://hal.archives-ouvertes.fr/hal-02450319
Submitted on 16 May 2020
HAL is a multi-disciplinary open access archive for the deposit and dissemination of sci-entific research documents, whether they are pub-lished or not. The documents may come from teaching and research institutions in France or abroad, or from public or private research centers.
L’archive ouverte pluridisciplinaire HAL, est destinée au dépôt et à la diffusion de documents scientifiques de niveau recherche, publiés ou non, émanant des établissements d’enseignement et de recherche français ou étrangers, des laboratoires publics ou privés.
To cite this version:
Pierre Levasseur. Can social programs break the vicious cycle between poverty and
obe-sity?: Evidence from urban Mexico. World Development, Elsevier, 2019, 113, pp.143-156.
Can social programs break the vicious cycle between poverty and obesity? Evidence from urban
Mexico
Levasseur, * 1,2,3
1-GREThA, Université de Bordeaux, France
2-Departamento de Economía Aplicada, Universidad de Granada, Spain 3-Irstea, UMR G-EAU, Montpellier, France
Abstract: This article analyzes how social interventions offer a solution to counteract the spread of
overweight among the poor. Focusing on the Mexican conditional cash transfers program, we assess the average effect of a long run enrollment on adult body mass index and waist-to-height ratio. An original triple difference approach, which distinguishes over time participants from nonparticipants and stayers from leavers, is implemented. We find that the expansion of this program (to urban areas) has a protective effect on adult bodyweight for staying participants, but not an absolute effect. Moreover, the global impact of the program to reduce obesity is halved due to a low rate of participation in Mexican cities. Furthermore, we find health-risky externalities related to the cash component of the program. Indeed, the amount of cash payments is positively correlated with abdominal fat concentration, especially among enrolled women and for short-run enrollments. To sum up, our results bring new insights to the complementary role of both program components (cash and conditionalities).
I.INTRODUCTION
Important lifestyle transformations occur through urbanization, industrialization and globalization: food consumption becomes more caloric and physical activity decreases. As a consequence, these transformations destabilize the balance between calorie intakes and expenditures, and then lead to a spread of obesity and related diseases. However, obesity is not homogeneously distributed in a given society. Some social categories of the population appear to be more exposed to obesity than others. Interestingly, the social gradient of obesity tends to change over the development process. While fat is positively correlated with high social positions in traditional societies, obesity particularly affects poor populations in modern and rich economies (Sobal and Stunkard, 1989; McLaren, 2007). In other words, the obesity burden moves from the rich to the poor over the economic development process. Two principal channels may explain this surprising shift. First, economic growth is often associated with a growing access of poor populations to new consumption goods (ultra-caloric and processed food, durable assets related to inactivity, etc.) which unbalance energy intakes and expenditures and result in a generalized weight gain (Monteiro, Conde and Popkin, 2001; Monteiro et al., 2004). Second, through the globalization process of culture, thinness ideals are progressively adopted, even in the developing world (Brewis, SturtzSreetharan, & Wutich, 2018). Fat stigma increases in society institutions (e.g. schools and labor market) and then reduces socioeconomic climbing capacities of overweight and obese persons (Cawley, 2004; Runge, 2007). Conjointly, both channels lead to a vicious circle between poverty and weight gain: obesity reduces the chance of schooling and/or professional success, obese people plunge or remain into poverty, the poor have obesity-related lifestyles, and so on.
Given the strong association between poverty and obesity, social programs appear as a relevant solution to this public health problem. However, in developing countries, often over-indebted, the introduction of social protection system is limited by budgetary and fiscal restrictions. Hence, many emerging countries like Mexico have opted for a compromise alternative: the conditional cash transfers (CCT) programs. Since these programs only target the poorest, their cost is relatively low. The principle is simple. In exchange for monetary (or non-monetary) supplements, the participant agrees to meet a number of conditions (called conditionalities), which generally aim to increase public service demand
(i.e. school and health center). Cash transfers are said to be “conditional” because participants who do not meet the attached conditionalities are directly excluded from the program and do not receive payments anymore. Cash incentives have two main functions: (i) to encourage eligible households to take part in the program and (ii) to offset several constraints related to public service attendance, such as direct (registration, uniform, equipment, consultation, transportation, medicine, injections, etc.) and indirect costs (opportunity cost, loss of time, etc.). Note that the poor are particularly sensitive to these constraints. Evidently, other factors limit the public service demand from poor populations, such as the lack of interest in health and education. This lack of interest is theoretically attributable to a low level of nutritional and health knowledge, as well as temporal inconsistencies (i.e. preference for a present satisfaction rather than for an uncertain investment in human capital, Banerjee and Duflo, 2011; Levine, 2015).
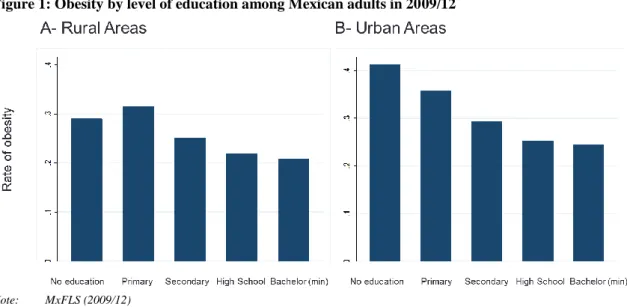
Two principal reasons make the case of Mexico especially relevant to explore how CCT may constitute a concrete action to simultaneously reduce poverty and obesity in countries with low funding capacities. First, the Mexican CCT program, called Progresa, then Oportunidades, and finally Prospera, is one of the most ambitious and successful around the world (Fiszbein et al., 2009). Second, overweight and obesity now concern two-third and one-third of Mexican adults, respectively. Besides, the obesity burden is significantly increasing in low social categories in Mexico through both pathways discussed above, especially in urban settings (Levasseur, 2015, 2018). Figure 1 is explicit about the social gradient of obesity and its evolution. While the shift of obesity burden has already moved to the poorest (the lowest educated) in urban areas, the shift of the obesity-social gradient remains at a transitory stage in rural settings (intermediate levels of education are associated with the highest obesity prevalence).
Insert Figure 1
Initially, the purpose of the program was to eradicate hunger and extreme poverty by intervening in education, nutritional deficiencies and infectious diseases. Established in 1997 as part of a randomized controlled trial in a small group of marginalized rural areas, this program has shown positive impacts on human capital indicators. In view of its conclusive results (see Hoddinott and Bassett, 2008), the government extended the project to overall marginalized rural areas between 1998 and 2000, and then
to small urban areas in 2001 and to Mexican metropoles in 2002. In 2007, poor households from all marginalized communities of the country (rural and urban) were eligible for the program. However, the existing literature reveals that the program expansion to urban areas, since 2001, has several limitations. Indeed, the participation rate of eligible households is anecdotic (around 50%) and the rate of dropouts is surprisingly high in cities (Angelucci, Attanasio and Maro, 2012).
Based on the case study of the Mexican CCT program, we aim to identify how a social intervention allows the vicious circle of poverty and obesity to be broken. More specifically, we seek to explore how both program components (cash versus conditionalities) can constitute a solution (or a limit) to break this circle. Using a quantitative design based on longitudinal data from the Mexican Family Life Survey (2005-12), the present study aims to assess the average treatment effect on the treated (ATET) for urban adult populations regarding two complementary bodyweight outcomes: the body mass index (BMI) as a general adiposity indicator and the waist-to-height ratio (WHtR) as an abdominal adiposity indicator. To our knowledge, no study has yet measured the impact of the Mexican CCT program on anthropometric indicators in the case of urban adults. The use of a triple difference (DDD) approach appears to be particularly relevant in the context of the study. By distinguishing participants from nonparticipants, and then participants who withdraw (leavers) from participants who remain beneficiaries (stayers) over time, this approach adds a temporal dimension to the analysis. In other words, the triple difference design differentiates the effects of a short-run enrollment (carried by leavers) and the effects of a sustained enrollment (carried by stayers). This original approach has the advantage to correct the existing time-invariant heterogeneity that simultaneously explains the treatment status (nonparticipant, stayer or leaver) and the bodyweight indicators. Moreover, to better control for baseline heterogeneity between nonparticipants, stayers and leavers, pre-matching procedures are implemented and used to weight DDD estimates. Finally, we explore the independent effects of both program components (cash versus conditionalities) by analyzing the relationship between the level of cash payments and bodyweight among enrolled adults, distinguishing short-run from long-run enrollments. The rest of the article is organized as follows: Section 2 succinctly describes the Mexican program of CCT; Section 3 presents the existing literature that analyzes the impacts of the program on nutritional
health and highlights some limitations to explore; Section 4 describes the data; Section 5 establishes the empirical strategy; Section 6 comments the results; and Section 7 concludes.
II.DESCRIPTION OF THE MEXICAN CONDITIONAL CASH TRANSFERS (CCT) PROGRAM
2.1. Benefits
The Mexican program offers two types of cash transfers: (i) a basic aid to increase household food consumption; (ii) optional scholarship to encourage school attendance. Each type of transfer is linked to specific conditionalities.
In exchange for a basic food aid (the same amount to all participants), each household member must visit the nearest health center every two months for medical checkups. Moreover, the person receiving the transfers (generally the mother) is asked to attend monthly public health training and health/nutritional prevention meetings (pláticas). Every month, health centers report attendance to program administrators. Households that have not complied with these conditionalities for four consecutive months (or six non-consecutive months in one year long) are automatically excluded from the whole program’s benefits.training
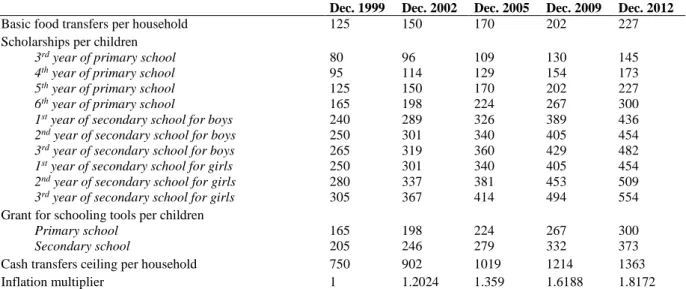
Concerning scholarships, the amount of transfers varies by household since it depends on the number of schooled children, the attended school section and gender (see Table A.1 in the Appendix). Note that the program sets a maximum transfer threshold (20% of household expenditure) to avoid possible natalistic externalities (Skoufias, 2005). To benefit from a whole scholarship, a student must enroll in a school (approved by the Ministry of Education) and be present at least 85% of the month. Registration and attendance are reported by the school authority and relayed to program administrators. If school attendance is lower than 85%, a proportional amount is deducted from the bi-monthly total payment. For example, if a student is absent 50% of the time in the last two months, he will receive half of the scholarship.
To conclude, unlike the basic food transfer, scholarship-related conditionalities do not necessarily lead to definitive exclusions, but rather to payment reductions (Álvarez, Devoto, & Winters, 2008). It means that a household can partially enroll in the program as long as the health and nutrition component is met.
However, if a household does not comply with the health and nutrition component, but continues to send its children to school, then this household will be permanently excluded from the whole program’s benefits.
2.2. Selection process of beneficiaries
In the Mexican CCT program, the beneficiary targeting strategy follows a dual selection process. As a first step, a geographical selection of the poorest communities is established. Since the level of concentration of poor households is very different between rural and urban areas, the geographic selection process is region-specific (Orozco & Hubert, 2005). Then, a selection of eligible households is carried out within pre-selected rural communities and urban segments. In other words, only poor households belonging to a poor community are eligible for the program.
In eligible enclaved communities, interviewers go directly at home. Hence, a quasi-exhaustive census of the inhabitants is conducted in rural areas. Households meeting the eligibility criteria are de facto invited to enroll. However, for cost reasons, this type of census is not carried out within eligible urban segments. Instead, a self-selection system is installed. First, households living in eligible urban segments are informed about the existence of the program through mobile loudspeakers, advertisements and radio messages. Households, perceiving themselves as eligible, must go to the nearest temporary reception desk (installed in a health center) where they are interviewed. The information is directly entered by computer and simultaneously juxtaposed with the multivariate poverty index (homogeneous at the national level since 2001) called puntaje (see Skoufias, Davis and de la Vega, 2001). Finally, for households meeting the eligibility criteria (having a puntaje higher than 0.69), home visits are then completed to check the veracity of the data recorded during the interview.
This system of self-selection has resulted in the exclusion of many urban eligible households. Angelucci, Attanasio and Maro (2012) estimate that about 50% of potentially eligible urban households do not benefit from the program, while this rate is lower than 10% for rural households. Behrman et al. (2012) report that almost one-third of them did not know about the existence of the program. In other words, more than two-thirds of eligible non-participants voluntarily decided not to enroll in the program whereas they could. Although some eligible households have probably felt uncertainty about their
eligibility, many have voluntarily decided to self-exclude, probably because program payments are insufficiently attractive compared to urban living standards (Angelucci et al., 2012). Indeed, the amounts of cash supplements are identical in rural and urban areas (see Figure A.1 in the Appendix), despite an evident gap in living costs.
III.LITERATURE SURVEY
As discussed earlier and evidenced in Figure 1, there is a strong correlation between poverty and obesity in emerging countries such as Mexico, especially in urban settings. Indeed, specific studies focusing on Mexico suggest that the urban poor is increasingly affected by a generalized weight gain (Levasseur, 2015). Moreover, the obesity status significantly reduces labor market opportunities, especially in Mexican cities (Levasseur, 2018).
The effect of the Mexican CCT program on poverty alleviation is relatively intuitive and well documented in the literature, even in urban settings. As observed in rural areas, the urban version of the program contributes to significantly increase the level of household food expenditures (Angelucci & Attanasio, 2009). Others studies find conclusive results regarding the size of young children, which is a long-run indicator of nutritional deficiencies (Leroy et al., 2008). Moreover, the schooling-related conditionalities significantly improve education attainment in Mexican cities (Behrman et al., 2012). However, no study assesses the impacts of the program on overweight and obesity in the urban context. Yet weight gain is a much more prevalent problem in Mexican cities than hunger and nutritional deficiencies. Theoretically, the Mexican CCT program has no direct linkages with obesity. Remember that this program initially aims to alleviate hunger and extreme poverty. Nonetheless, the two components of the program (conditionalities plus cash) can indirectly and differently affect obesity risks. For instance, the indirect impacts of cash supplements on obesity risks are assumed to be ambiguous (can be positive or negative) because we do not know how this extra income is really spent. In theory, extra incomes can be spent to consume goods and services related to weight gain (high-fat foods, tobacco, alcohol, etc.) or weight loss (healthy foods, sportive activities, etc.). Concerning the attached conditionalities, and especially the nutrition- and health-related conditionalities, the impacts on obesity risks are expected to be negative. It is not surprising to assume that regular medical checkups, public
health training and health/nutritional prevention meetings probably improve health-related behaviors and then protect adult beneficiaries against obesity (Andalón, 2011).
Despite the lack of studies about urban settings, the research works that focus on rural Mexico bring many lessons to understand how each program component (cash and conditionalities) influences adult nutrition. For example, Fernald, Gertler and Hou (2008b) find that the program negatively affects the BMI (-2%) and reduces overweight (-6%), obesity (-25%) and high blood pressure (-2%) risks among rural adults from 30 to 65 years old (around 3.5-5 years after the program implementation). From a regression discontinuity design, Andalón (2011) shows that program enrollment reduces obesity prevalence by 32% among young women (15-21 years old) and has no effect on young male’s BMI. Concerning childhood overweight and obesity, the literature does not draw clear conclusions. When comparing preadolescent participants (8-10 years old) with a 3.5-year enrollment period to those with a 5-year enrollment period, Fernald, Gertler and Neufeld (2009) do not detect any gap in the prevalence of overweight. Furthermore, among all adolescent participants, the authors do not observe any reduction in the rate of overweight, even after a 10-year enrollment period. In other words, we can speculate that the effect of the program on nutritional health is only relative: enrollment only retains weight gain (compared to eligible nonparticipants) but does not improve nutritional health.
While the role of conditionalities is assumed positive for health and nutrition, some authors highlight the ambiguous effects of the monetary component. Fernald, Gertler and Hou (2008a) and Fernald, Gertler and Neufeld (2008) use an interesting strategy to address the independent effect of cash incentives on adult health in rural areas. By isolating a group of participants that manage to double their cash payments thanks to a longer participation in the program (3.5 versus 5 years) and/or cumulative scholarships, these authors show that the relationship between cash incentives and nutritional outcomes depends on the age of participants. For young children (2-6 years old), cumulative cash transfers are associated with an increase in height and a decrease in undernutrition, BMI and overweight, as well as better physical, cognitive and linguistic development capacities (Fernald, Gertler and Neufeld, 2008). By contrast, for adults (30-65 years old), the doubling of cash transfers is positively correlated with BMI and increases the risks of overweight, obesity and high blood pressure (L. C. H. Fernald et al., 2008a).
Even if the causal link is not properly established (Attanasio, Meghir, & Schady, 2010), these results suggest that the cash component is beneficial for young children, but may have negative externalities on adult health, at least in the short run. In other words, while a part of monetary aids is probably invested in the child's human capital (education, health and nutrition), another part of these funds is likely to be used by the adults to consume more unhealthy goods, such as tobacco,1 high-calorie food and beverages, or alcohol (L. C. H. Fernald et al., 2008a; Avitabile, 2012).
This aspect reminds some findings from the literature which seeks to identify obesity determinants. Several authors assume that an extra income increases the obesity prevalence among poor populations, certainly through the adoption of risky behaviors (Monteiro, Conde and Popkin, 2001; Smith and Goldman, 2007; Levasseur, 2015). While a cash supplement can be considered as a risk factor for the poor, education is expected to have a protective role, since education is strongly related to nutritional and health knowledge. One can, therefore, assume that program-related conditionalities reduce obesity risks insofar as they potentially improve nutritional and health knowledge, especially through medical checkups, public health trainings and nutrition/health prevention meetings. To test the influence of health-related conditionalities on nutritional health, Avitabile (2012) implements a random controlled trial of the Mexican program called Pograma de Apoyo Alimentario (PAL). The author observes that, by conditioning in-kind transfers through attendance to training sessions, the program significantly decreases women’s waist circumference, probably due to feeding improvements. In the case of Progresa-Oportunidades-Prospera, Fernald, Gertler and Hou (2008a) show that a longer exposure to conditionalities (a 1.5 extra year) increases (self-reported) walking and reduces obesity prevalence and high blood pressure risks among enrolled adults. Therefore, one can imagine that both CCT components (conditionalities plus cash transfers) have complementary effects in the long run. Indeed, such a program potentially gives the monetary and educational capacities to adopt healthier behaviors (better food consumption, opportunities for physical activity, etc.).
To sum up, the Mexican CCT program may constitute a relevant solution to fight the obesity/poverty circle. Nonetheless, as evidenced in the previous literature survey, both CCT components
(conditionalities versus cash) may have different effects on bodyweight, depending on temporality. For instance, an additional cash transfer may increase the obesity risk in the short run because poor people tend to use an extra income to consume goods related to weight gain. In this case, exposure to the attached conditionalities is probably too short to enough sensitive adult beneficiaries about health and nutrition issues. However, a longer exposure to the program conditionalities (especially nutrition- and health-related conditionalities) may have a protective effect on obesity risks. Indeed, the existing literature shows that a longer exposure transforms health-related behaviors of adult participants. After a while, extra incomes tend to be better used (in healthier food consumption) and physical activity increases.
Given the temporal ambiguity concerning the effects of cash payments on adult obesity risks, at least in the short run, the use of a triple difference (DDD) model seems relevant. In addition to reducing time-invariant heterogeneity, this approach offers the opportunity to distinguish participants from nonparticipants, as well as long-run participants (stayers) from short-run participants (leavers). Baseline matching procedures are implemented to weight DDD estimates and limit the presence of a selection bias between nonparticipants, leavers and stayers. Moreover, we regress adult bodyweight on the level of cash payments among enrolled households to test the assumed ambiguous effects of an extra income. IV.DATA
The data used in this study come from the Mexican Family Life Survey (MxFLS), the first survey with a representative sample of the Mexican population at national, rural-urban and regional levels. Sampling directives were drawn up by the Mexican Institute of Statistics. The survey covers a 10-year period with three distinct waves. The first wave was carried out in 2002 with 35,677 individuals surveyed in 8,440 households (living in 150 municipalities across 16 Mexican states). Given the longitudinal dimension of the survey, the second (2005/06) and the third (2009/12) waves are based on the initial sample from 2002. For both waves, the follow-up rate of the initial sample exceeds 90% at the household level. MxFLS data include detailed information on socioeconomic characteristics of households and individuals. Moreover, anthropometric data were collected for all household members directly at home by trained staff from the Mexican Institute of Public Health. Weight was measured with a set of digital
scales (accuracy of 0.1 kg) and height with a stadiometer (accuracy of 0.5 cm). To identify the nutritional status of adults, two complementary outcome indicators are used: the body mass index (BMI) and the waist-to-height-ratio (WHtR).2 While the BMI is a good predictor of global adiposity accumulation, the WHtR better identifies fat distribution in the body, especially abdominal fat concentration (around vital organs) which is highly correlated with comorbidities and mortality (Burkhauser & Cawley, 2008). Note that the WHtR better identifies excess weight than the BMI insofar as this latest cannot distinguish fat from muscles and bones. For both indicators, extreme values are removed by following a Tukey boxplot (i.e. 1.5 ∗ 𝑖𝑛𝑡𝑒𝑟𝑞𝑢𝑎𝑟𝑡𝑖𝑙𝑒 𝑟𝑎𝑛𝑔𝑒). We also implement additional analyses using clinical classifications based on BMI and WHtR cut-offs (i.e. overweight, obesity and risky central adiposity concentration). Nonetheless, continuous bodyweight measures (BMI and WHtR) are preferred, instead of their relative clinical classifications, in order to limit the sensitivity of the results to potential threshold effects.
To meet the objective of the study, the sample is restricted: (i) pregnant and lactating women are withdrawn from the sample in order to limit anthropometric bias; (ii) we focus on urban adults from 18 to 65 years old to highlight the assumed negative externalities related to the cash component.
V. EMPIRICAL STRATEGY
5.1. Measuring the impact of program enrollment on bodyweight: a triple difference design
Regarding health and nutritional indicators, the way in which both program components interact is not yet established, particularly in urban areas. While the cash component can have negative externalities on adult behaviors in the short run, the literature suggests that a longer compliance with health and nutritional conditionalities leads participants to adopt healthier lifestyles and consumption habits. Given this temporal ambiguity, it seems relevant to distinguish participants from nonparticipants, as well as long-run participants from short-run participants, to estimate the effect of the program on bodyweight outcomes.
High rates of self-exclusion (nonparticipations and dropouts) in cities and the observational structure of the MxFLS lead us to adopt a specific strategy. Indeed, there are unobservable factors that
2 BMI=[kg/(m²)] and WHtR=[cm/ cm].
simultaneously influence a self-exclusion decision and nutritional outcomes, such as individual involvement in health and education. For example, some households sensitive to health and education issues will psychologically overstate the level of cash incentives, while they will minimize the constraints associated with conditionalities compliance. Accordingly, this selection bias can potentially overestimate the impact of the program, since enrolled households are likely to be more interested in adopting healthier behaviors than eligible households who voluntarily choose not to enroll (or leave the program).
Such a selection bias could be solved using a difference-in-differences (DD) approach. By comparing the outcome gaps between treated and untreated individuals, pre- and post-intervention, this estimator eliminates the invariant selection bias over time, including the hazards due to unobservable heterogeneity. Thus, this approach assumes that the selection bias is constant over the period studied. Here, this hypothesis is not too heavy: we can easily assume that omitted factors, such as the individual's interest in health and education issues, will not change over a short period. To be implemented, a DD method requires that the base period precedes the program implementation. However, the first survey available in the MxFLS dates back to 2002, and in 2002, a portion of urban households was already participants (the expansion to cities started in 2001). Hence, the use of a DD approach would lead to a temporal bias underestimating the true impact of the program.
When a pre-intervention period is not available, Ravallion et al. (2005) propose using an alternative and practical approach: if the enrollment date is unknown, it is likely to focus on the dropout date which is well-known. The underlying idea is to compare the nutritional trajectories of three distinct groups: the leavers (i.e. short-run participants), the stayers (i.e. long run participants) and the nonparticipants (i.e. never enrolled). As for the DD method, this alternative approach also supposes that there is no time-varying heterogeneity between participants and nonparticipants. In practice, this original approach, referred as a triple difference (or difference-in-difference-in-differences – DDD), follows a two-step process.
In a first step, two propensity score matching procedures are required to control for a potential selection bias between stayers, leavers and nonparticipants: (i) a matching of initial participants (leavers and
stayers) with non-participants; (ii) a matching of stayers with leavers.3 For both matchings, propensity scores are estimated using logistic binomial models. The first model measures the probability of enrollment and the second model estimates the probability of being a stayer rather than a leaver. More formally, we have:
{𝑃(𝑃𝑎𝑟𝑡𝑖𝑐𝑖𝑝𝑎𝑛𝑡𝑖) = 𝛼 + 𝛽𝑋𝑖,𝑡=1+ 𝜀𝑖 𝑃(𝑆𝑡𝑎𝑦𝑒𝑟𝑖) = 𝛼 + 𝛽𝑋𝑖,𝑡=1+ 𝜀𝑖
[1]
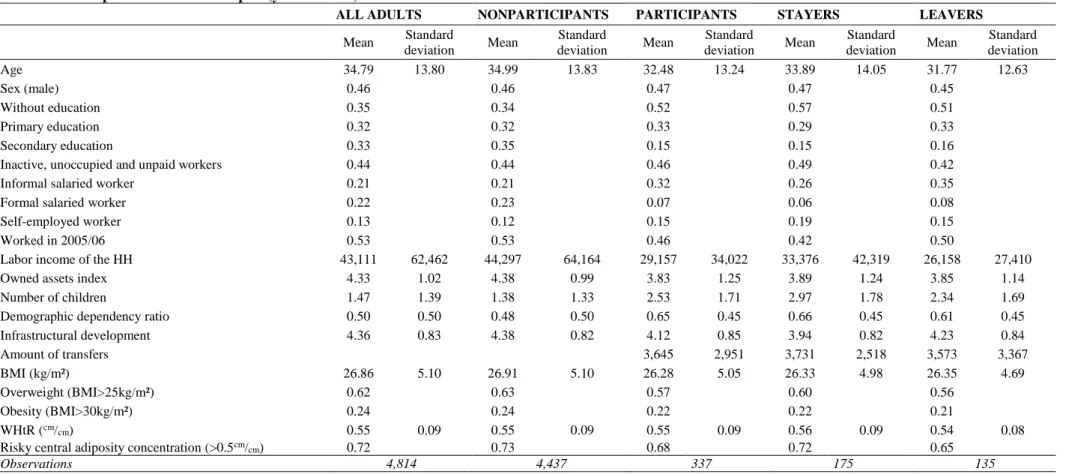
Where the dummy 𝑃𝑎𝑟𝑡𝑖𝑐𝑖𝑝𝑎𝑛𝑡𝑖 distinguishes individuals i who participate in 2005 from nonparticipants (never enrolled between 2002 and 2012). 𝑆𝑡𝑎𝑦𝑒𝑟𝑖 is a dummy variable that takes the value 1 if the individual i participates between 2005 and 2012, and the value 0 if the individual i enrolls in 2005 but not in 2012 (i.e. leaver). 𝑋𝑖,𝑡=1 refers to the observed characteristics of individuals i at the baseline period t=1 (2005). As enounced in Table A.2 in the Appendix, this vector of control variables captures several characteristics at the individual-level (age, gender, education and socio-professional status), at the household (or household head)-level (number of children, demographic dependence, annual labor income and assets) and at the community-level (infrastructures). Note that we include the treatment status of an individual i in 2002 into the second matching procedure to capture additional heterogeneity between stayers and leavers. For instance, we can assume that a participant who enrolls earlier (since 2002) is more involved in health and education issues and is going to stay longer enrolled in the program than a participant who enrolls later (between 2002 and 2005/06).
Like Ravallion et al. (2005), we use the five closest neighbors method in order to match propensity scores of participants and non-participants, and then, propensity scores of stayers and leavers. The quality of both matchings is analyzed according to a protocol suggested by Caliendo and Kopeinig (2008): (i) balance tests of observed characteristics between treated and untreated individuals; (ii) estimates of percentage bias between treated and untreated individuals; (iii) an overlap analysis of the propensity scores distribution between treated and untreated individuals (both matchings are restricted
3 As argued by Ravallion et al. (2005, p.210), “people who join a social program are likely to differ from those who do not, and
people who leave the program are potentially different to those who stay”. Table A.3 in the Appendix reports pre-matching descriptive statistics across several observed factors. For instance, important differences are observed between stayers and leavers in terms of household head’s labor incomes.
to the common support area). Finally, we weight the observations in the DDD estimates using the propensity scores from both matching procedures.
In a second step, DDD estimates are carried out. Regarding both outcome indicators (BMI and WHtR), the DDD is the difference between the evolution of stayers compared to matched nonparticipants (𝐷𝐷𝑠𝑡𝑎𝑦𝑒𝑟𝑠) and the evolution of leavers compared to matched nonparticipants (𝐷𝐷𝑙𝑒𝑎𝑣𝑒𝑟𝑠). Mathematically, the DDD estimator takes the following form:
{
𝐷𝐷𝐷 = 𝐷𝐷𝑠𝑡𝑎𝑦𝑒𝑟𝑠− 𝐷𝐷𝑙𝑒𝑎𝑣𝑒𝑟𝑠
𝐷𝐷𝐷 = 𝐸[(𝑌𝑡=2𝑇 − 𝑌𝑡=2𝐶 ) − (𝑌𝑡=1𝑇 − 𝑌𝑡=1𝐶 )|𝐷𝑡=2= 1, 𝐷𝑡=1= 1] −𝐸[(𝑌𝑡=2𝑇 − 𝑌𝑡=2𝐶 ) − (𝑌𝑡=1𝑇 − 𝑌𝑡=1𝐶 )|𝐷𝑡=2= 0, 𝐷𝑡=1= 1]
[2]
Where 𝐷𝑡 identifies enrollment status at the period t (t=1 for 2005 and t=2 for 2012). 𝐷𝑡 takes the value 1 if the individual participates in the program at the period t and 0 otherwise. 𝑌𝑡𝑇 is the average observed outcome for treated individuals (i.e. being a participant in the baseline and/or in the follow-up period). 𝑌𝑡𝐶 refers to the average observed outcome for untreated individuals (i.e. being a nonparticipant in a given period t). In other words, 𝑌𝑡𝐶 estimates the counterfactual: the average observed outcome from a group of nonparticipants who are comparable, conditional on observed factors, to participants.
To measure the average treatment effect on the treated (ATET), DDD estimates must meet two conditions (Ravallion et al., 2005). We rewrite the DDD model in the following form to better describe both conditions:
𝐷𝐷𝐷 = [𝐸(𝐺𝑡=2|𝐷𝑡=2= 1, 𝐷𝑡=1= 1) − 𝐸(𝐺𝑡=2|𝐷𝑡=2= 0, 𝐷𝑡=1= 1)]
− [𝐸(𝐺𝑡=1|𝐷𝑡=2= 1, 𝐷𝑡=1= 1) − 𝐸(𝐺𝑡=1|𝐷𝑡=2 = 0, 𝐷𝑡=1 = 1)] [3]
Where G is the bodyweight gap between participants (stayers or leavers) and nonparticipants. The first term in square brackets refers to the effect of staying in the program rather than leaving, resulting from the gap between stayers and leavers in t=2 (follow-up period). Note that this estimate would be biased whether the past participation of leavers affects their nutritional situation at the follow-up period (𝐸(𝐺𝑡=2|𝐷𝑡=2 = 0, 𝐷𝑡=1 = 1) ≠ 0). One could effectively assume that leavers adopt healthier behaviors as a result of their ex-participation. Hence, to exclude such a possibility, the following hypothesis must be tested and met: absence of an outcome gap between stayers and nonparticipants in the follow-up
period (𝐸(𝐺𝑡=2|𝐷𝑡=2= 0, 𝐷𝑡=1= 1) = 0). The second term in square brackets is the selection bias associated with potential initial differences between stayers and leavers. For example, if the interest in health is more important for stayers than for leavers, this selection bias would overestimate the protective effect of a long-run enrollment. Hence, we test the absence of a selection bias: 𝐸(𝐺𝑡=1|𝐷𝑡=2= 1, 𝐷𝑡=1 = 1) = 𝐸(𝐺𝑡=1|𝐷𝑡=2 = 0, 𝐷𝑡=1= 1).
Finally, we bootstrap the whole estimation procedure to correct estimated standard deviations and increase the robustness of findings. We run 1,000 bootstrap replications.
5.2. Measuring the ambiguous effects of cash payments on adult bodyweight
An increase of cash incentives will theoretically raise the enrollment rate and reduce the number of dropouts from the poorest households. However, the literature warns us against the possible negative externalities that an additional income could have on the nutritional health of the poorest. Furthermore, the way in which the two components of the program interact is not yet established. To highlight this ambiguity, we estimate how an extra income from the program aid does influence anthropometric outcomes among adult participants. Based on the longitudinal dimension of the MxFLS (2002-2012), we use a random-effect generalized least square estimator as the following:
𝑌
𝑖𝑡 = 𝛼+ 𝛽1𝑋𝑖𝑡 + 𝛽2𝑐𝑎𝑠ℎ𝑖𝑡 + 𝜀𝑖𝑡 [4]Where 𝑌𝑖𝑡 is the anthropometric status (BMI and WHtR) of an adult i at the period t (2002, 2005/06 and 2009/12). The variable of cash incentives is analyzed in its logarithmic and discretized forms. Note that we divide the annual amount of cash transfers by the number of children in the household since the analysis is implemented at the individual level.4 𝑋
𝑖𝑡 is a vector of control variables including individual characteristics (age, gender, education, work status), information at the household level (household head labor income quartiles, owned assets) and community factors (infrastructural development index, municipality size and region). We describe the set of control variables in Table A.2 in the Appendix.
4 We divide the amount of payments by the number of children rather than by the number of members in the household because
the only way to vary the amount of payments is through the accumulation of scholarships (see Table A.1 in the Appendix). When the number of members is used to correct the level of payments, the results remain the same (available from the author upon request).
In alternative specifications, we add interaction terms between cash incentives and gender. Besides, to better analyze short-run effects of cash payments on adult bodyweight, we run estimates excluding long-run participants (i.e. stayers) from the sample.
VI.RESULTS
6.1. Program enrollment and anthropometric indicators of treated adults: a triple difference
approach
In this subsection, a triple difference (DDD) model is implemented to assess the average treatment effect on the treated population (ATET) regarding both anthropometric indicators: body mass index (BMI) and waist-to-height ratio (WHtR). The results based on clinical classifications of both outcomes indicators (overweight, obesity and risky central adiposity) are also discussed. The DDD model involves three inter- and intra-individual differences: (i) participants vs. nonparticipants, (ii) baseline (2005/06) vs. follow-up (2009/12) periods; (iii) stayers vs. leavers.
6.1.1. Pre-matching procedures
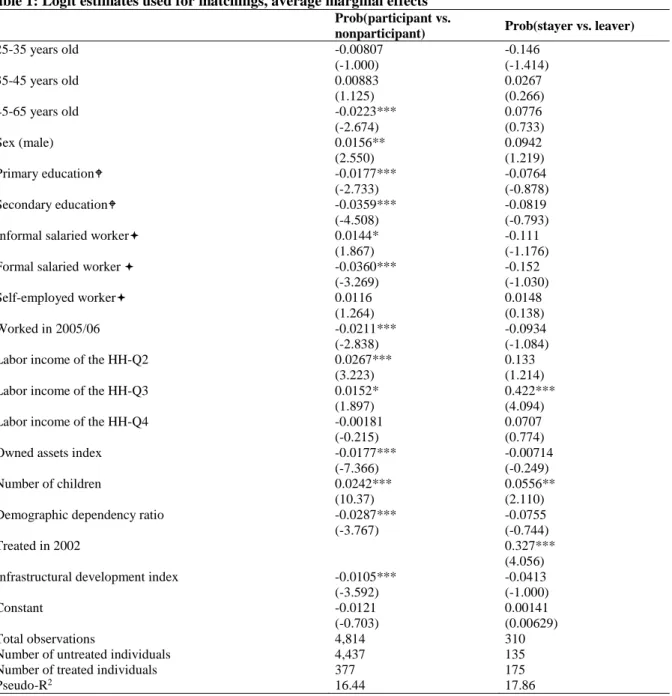
As previously enounced, two matchings are implemented beforehand in order to control for the potential selection bias in the baseline period. The first one matches participants and nonparticipants according to the estimated probability of enrollment. The second one matches stayers and leavers according to the estimated probability of staying. Table 1 reports the Logit estimates from which both matchings are based on. In column 1, it is interesting to note that the relationship between the household head’s labor income and program enrollment follows a U-inverted relationship. Middle-income households (Q2 and Q3) are more likely to enroll than the 25% the poorest and the 25% the richest. Besides, households with a higher demographic dependency ratio (i.e. mainly composed of children and the elderly) are less likely to enroll than those with mainly working-age members. These results reinforce the hypothesis that the most vulnerable households are not sufficiently incentivized to enroll in the program, since the amount of monetary aids is probably inappropriate for the living standards that characterize cities (Angelucci et al., 2012). Except that, other participation predictors are quite intuitive. At the individual level, being educated and working, especially in a formal setting, reduces the likelihood of enrollment. At the
household level, the number of owned assets is negatively correlated with participation, while the number of children increases enrollment. At the community level, living in the most developed cities (regarding infrastructures) decreases the enrollment probability.
Insert Table 1
Like Ravallion et al. (2005), propensity scores are matched by the five closest neighbors method.5 The quality of the two matching procedures is satisfactory. As shown in Figure A.2 in the Appendix, there are enough treated and untreated individuals with similar propensity scores. Only 14 treated individuals are outside the common support in the second matching (stayers vs. leavers). These individuals are therefore excluded from the analysis. Moreover, the standardized percentage biases across covariates are relatively low after both matchings (Figure A.3 in the Appendix); except for some variables where the bias is close to 20% (e.g. self-employment, household assets). Nevertheless, the balance tests show no significant difference at the 5% level between treated and untreated individuals for all observed characteristics (Table A.4 in the Appendix). Consequently, we assume that matched nonparticipants and participants are comparable in the baseline period (2005/06), and that among participants, matched leavers are similar to stayers, conditional to observed characteristics. From both previous matchings, two treatment variables are generated to implement DDD estimates: stayers vs. nonparticipants and leavers vs. nonparticipants. Then, the propensity scores are used to weight matched observations (i.e. on common support) in the DDD.
6.1.2. Triple difference estimates
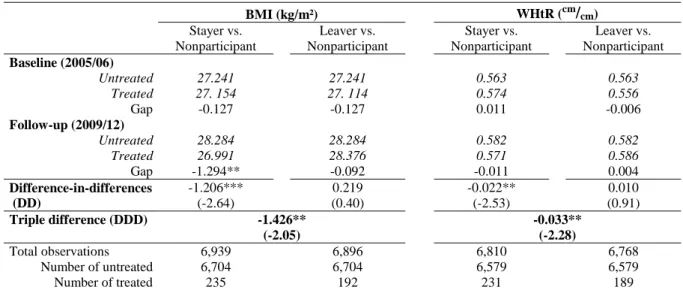
The triple difference strategy compares the evolution of the anthropometric status (BMI and WHtR) between stayers and leavers over time, while controlling for the situation of nonparticipants to capture possible exogenous shocks unrelated to the program. DDD estimates are reported in Table 2. To better describe the relevance of the results, let's focus first on adult BMI. Thanks to both matching strategies, average BMI between stayers, leavers and nonparticipants are not significantly different in the baseline period (2005/06). Then, in the follow-up period (2009/12), stayers become significantly thinner than
nonparticipants (-1.3kg/m²). However, note that, as expected, unobservable time-invariant factors (e.g. interest in education and health) have probably overestimated the protective effect of the program. Indeed, DD estimates show that the BMI gap between stayers and nonparticipants is actually -1.2k/m² when this heterogeneity is controlled for. Nevertheless, given that some stayers already benefited from the program in the baseline period (2005/06), we assumed that a DD procedure would underestimate the impact of the program. This hypothesis holds true since, controlling for program dropouts, the DDD estimator indicates that staying in the program significantly reduces adult BMI by 1.4kg/m² (significant at the 5% level). The same type of result is observed for the abdominal adiposity indicator (WHtR). While DD estimates indicate a decrease of 0.022cm/cm involved by program participation, DDD estimates show a stronger effect. Indeed, a sustainable enrollment significantly decreases by 0.033cm/cm the average WHtR of adults.
Note that additional estimates identify heterogeneous treatment effects according to age and gender. An age-specific analysis suggests that the negative effect of program enrollment on adult bodyweight is significantly higher for young adults (18-35yo) than for older adults (35-65yo).6 Furthermore, a gender-specific analysis shows a stronger protective effect of program enrollment on BMI for women (-2.41kg/m² [z-stat=-2.43]) than for men (-0.40kg/m² [z-stat=-0.37]). Nonetheless, there is no gender heterogeneity in terms of WHtR (-0.035cm/cm [z-stat=-1.77] for women versus -0.035cm/cm [z-stat=-1.81] for men.
Our DDD model meets both conditions that Ravallion et al. (2005) recommend testing of. First, there is no significant outcome gap between participants and nonparticipants, as well as between stayers and leavers, in the baseline period (Table 2); the latter is particularly true regarding the BMI. Therefore, we can conclude that our estimates are not subject to a selection bias. Furthermore, outcome trajectories between baseline and follow-up periods suggest that the second condition is also respected. Indeed, Figure 2 shows a convergence of average BMI and WHtR between leavers and nonparticipants over time (i.e. parallel trends), while stayers follow an alternative trend. In other words, once out of the
6 Considering adult BMI, the coefficient for young adults is -3.42kg/m² [z-stat=-2.42] and the coefficient for older adults is
-0.18kg/m² [z-stat=-0.24]. Considering adult WHtR, the coefficient for young adults is -0.061cm/
cm [z-stat=-2.48] and the
program, leavers are on the same nutritional trajectory as nonparticipants. This convergence suggests that there are not exogenous shocks on the period enable to differently affect participants and nonparticipants.
Insert Table 2
Even if we can interpret outcome coefficients from the DDD model as an ATET, Figure 2 illustrates the relative nature of this effect. In line with Fernald, Gertler and Neufeld (2009), a longer enrollment does not actually reduce adult BMI and WHtR, but only avoids their respective growth. Note that the stayers’ average BMI is around 27kg/m² in the follow-up period, which matches an overweight status. In Table A.5 of the Appendix, additional estimates using clinical classifications based on BMI cut-offs show that program enrollment has a negative but nonsignificant impact on overweight and obesity risks. These latest results are not surprising since estimates based on clinical classifications are highly sensitive to threshold effects enable to underrate continuous bodyweight variations. These results denote that the program has only a partial effect on adult overweight and obesity, limiting their increase without reducing their prevalence. Nonetheless, considering a clinical classification based on a WHtR cut-off, we observe a significant and negative impact: program enrollment reduces by 17 percentage points the probability of risky central adiposity (significant at the 5% level). This latest result highlights the relevance of using the WHtR to complement the over-used BMI. Indeed, the WHtR-based clinical classification seems to be less sensitive to threshold effects than the BMI-based categories.
Insert Figure 2
6.2. Negative externalities related to the cash component
In this last part of the study, we focus on enrolled households and seek to examine how the cash component of the program affects adult bodyweight by interfering in consumption behaviors (tobacco, alcohol, high-calorie food, etc.). Ceteris paribus, the literature assumes that an extra income potentially has negative health-risky externalities for poor populations, especially in the short run given the too short exposure to positive externalities involved by conditionalities.
Table 3 presents estimates from the random-effect generalized least square model focusing on all adults (18-65yo) who durably or punctually enrolled in the program between 2002 and 2012 (including stayers and leavers, as well as “occasional participants” in 2002 and 2009/12). The overall quality of estimates is satisfactory: R² are around 30%. In addition, the fitted coefficients of control variables are consistent with the literature findings. As expected, age has a quadratic influence on BMI and WHtR of participants: at the beginning of adulthood, the individuals tend to gain weight, but after a certain age the relation is reversed and they lose weight. Furthermore, participants who work (in an informal, formal or independent job) are significantly thinner than inactive, unemployed or unpaid participants, despite some differences according to outcome indicators.
It is interesting to see that adult BMI and WHtR evolve differently over time. In Table 3, the total variance of the BMI is more explained by inter-individual differences than intra-individual differences: R²-between is twice higher than R²-within. It means that the adult BMI is relatively stable over time (between 2002 and 2012). By contrast, regarding adult WHtR, within is slightly greater than R²-between. It indicates that WHtR better captures fat accumulation over time than BMI. This fact is not particularly surprising since BMI does not identify how adiposity is distributed in the body. These differences may explain why cash payments per child have a positive, linear and significant effect (significant at the 1% level) only for adult WHtR (column 4). In other words, ceteris paribus, higher cash incentives increase abdominal fat accumulation over time.
Insert Table 3
By interacting log-transfers with gender, the abdominal fat gain appears to be stronger for female participants (column 6). Besides, when annual cash payments are discretized into quartiles, we find that the 25% of participants who receive the highest aids have a higher BMI than the 25% of participants who receive the lowest aids (column 2). Similarly, compared to the first quartile of transfers, the 75% who receive the highest payments accumulate more abdominal adiposity over time (column 5).
To better capture the effects of cash incentives on adult bodyweight in the short run, we implement additional estimates restricting the analysis to short-run participants (i.e. excluding the group of stayers). These estimates are available in Table A.6 in the Appendix. Compared to the estimates based on all
participants (Table 3), Table A.6 shows for example that a short-run enrollment (being a leaver or an occasional participant) doubles the positive impacts of cash payments on BMI.
VII.CONCLUSION
Given the limited financing capacity of developing countries, the CCT programs form an affordable solution to reverse the spread of obesity among poor populations. However, compliance with conditionalities limits participation and substantially increases dropouts, particularly when compliance-related constraints are high and cash incentives are relatively low. In addition, health externalities compliance-related to each program component (cash vs. conditionalities) are still poorly investigated, particularly in an urban context. Based on the case of Mexico, which is a developing country that has gradually expended a CCT program from rural to urban areas, we sought to better understand how the amount of payments and conditionalities compliance interfere with each other and affect nutritional behaviors. The present study makes two main contributions to the literature.
First, as expected, a sustained enrollment in the program significantly reduces adult BMI and WHtR. Using a triple difference design, we found a significant ATET of -1.43kg/m² and -0.033cm/cm regarding adult BMI and WHtR, respectively. Note that these protective effects are twice stronger when we restrict the estimates to the young adults (18-35yo) or to female participants (at least in terms of BMI). Nonetheless, these findings must be relativized. In fact, the program has a limited impact on adult BMI and WHtR: a sustained participation in the program does not reduce these outcome indicators, but only prevents weight gain (Figure 2). Although this relative effect is somehow successful, average BMI and WHtR of stayers are around 27kg/m² (i.e. an overweight status) and 0.57cm/cm (i.e. a risky level of central adiposity), respectively. This result is not so surprising considering the program purpose and design. Indeed, initially designed to reduce hunger and extreme poverty, this program fits poorly with the nutritional issues that plague cities (i.e. obesity). Therefore, to be more effective in reducing obesity prevalence, the program conditionalities should be better adapted to the urban context. Besides, a focus on young adults seems particularly efficient in terms of obesity reduction, probably because young people are more likely to change their habits than the oldest. In addition, the program should better integrate fathers, especially in health- and nutrition-related conditionalities. Indeed, the
higher protective effect for women is not so surprising since public health training and nutrition/health prevention meetings are exclusively provided to the person who receives the program benefits, who are often the mothers.
A second contribution concerns the program time exposure. The design of the triple difference method allows stayers, leavers and nonparticipants to be distinguished over time. While long-run enrollment has a protective effect on adult bodyweight, leaving the program between 2005/06 and 2009/12 results in a weight gain among adults (see Figure 2). This last finding supports the hypothesis that a short-run enrollment leads to inappropriate uses of cash transfers. We test such a hypothesis estimating how the amount of payments affects adult BMI and WHtR among household participants. As assumed by Fernald, Gertler and Hou (2008a), the cash component positively affects adult bodyweight. Ceteris paribus, adult participants receiving larger amounts of aids tend to accumulate more abdominal fats over time than participants receiving less monetary supports. Besides, as suggested by Andalón (2011), this effect is stronger for women, who directly receive bimonthly payments. Furthermore, the positive effect of cash payments on adult BMI is particularly strong when the estimates focus on short-run participants only (i.e. leavers and occasional participants). In other words, the negative health externalities of cash incentives would be a short-run effect. This proposition is consistent with the existing literature focusing on rural Mexico. For instance, Hoddinott and Skoufias (2004) show that rural participants consumed 7.1% more calories at the beginning of the enrollment than 18 months later. Fernald, Gertler and Hou (2008a) add that short-run enrolled adults walk less and have higher BMI than longer enrolled adults (18 extra months). Hence, it is likely that a longer exposure to conditionalities offsets the negative externalities associated with an additional income. Health-related conditionalities (medical checkups, public health training, and nutritional prevention meetings, etc.) would encourage (young adult) participants to gradually adopt healthier lifestyles, improving health and nutritional knowledge.
To conclude, the results from this study enrich the debate between conditional versus unconditional cash transfers. Despite the many advantages of an unconditional support (few self-exclusion and dropouts, absence of pressure and constraints, etc.), an additional income can have negative externalities on adult behaviors among the poor. Obviously, these negative externalities are particularly salient in urban areas
of emerging countries where the access to processed goods is growing (tobacco, ultra-caloric foods, etc.) and lifestyles are increasingly becoming sedentary. In such a context, conditioning monetary aid can thus be a relevant action if conditionalities really aim to protect nutritional health (adapted training, health center visits, etc.). Nevertheless, compliance with conditionalities generates different constraints for participants (e.g. direct and indirect costs) that can become unsustainable for the most vulnerable households and lead them to leave the program (González-Flores, Heracleous, & Winters, 2012). According to Angelucci, Attanasio and Maro (2012), the participation rate in urban Mexico is around 50% among potentially eligible households. Therefore, the global impact of the program to fight obesity among the urban poor (target population) is halved. In fact, the global effect would be 0.7kg/m² and -0.017cm/cm in terms of adult BMI and WHtR, respectively. Note that a high dropout rate may have negative externalities on adult abdominal adiposity. Indeed, a short exposure to conditionalities does not sensitize enough the participant about the importance of adopting healthier behaviors. Consequently, CCT providers should identify each constraint associated with conditionalities compliance to minimize exclusion errors and thereby maximize the global impact of the program on the target population. In the case of Mexico, it is clear that increasing the amount of transfers in urban areas should, not only encourage more eligible households to enroll in the program, but also limit the number of dropouts. A more complete and sustainable enrollment of the target population would offer a tangible way to break the poverty/obesity circle. Another possible action to reduce program desertions could be to make the amount of cash payments proportional to the poverty level of the eligible household. Nonetheless, one shall keep in mind that a program expansion to a larger number of urban beneficiaries could reduce the observed protective impact in terms of obesity risks. Indeed, such an expansion could incorporate households less concerned with health and nutrition issues than the group of stayers we used as a treatment group in this study. Hence, further research needs to focus on these expending effects.
REFERENCES
Álvarez, C., Devoto, F., & Winters, P. (2008). Why do Beneficiaries Leave the Safety Net in Mexico? A Study of
the Effects of Conditionality on Dropouts. World Development, 36(4), 641–658.
https://doi.org/10.1016/j.worlddev.2007.04.014
Andalón, M. (2011). Oportunidades to reduce overweight and obesity in Mexico? Health Economics, 20 Suppl 1, 1–18. https://doi.org/10.1002/hec.1773
Angelucci, M., & Attanasio, O. (2009). Oportunidades: Program Effect on Consumption, Low Participation, and Methodological Issues. Economic Development and Cultural Change, 57(3), 479–506. https://doi.org/10.1086/596616
Angelucci, M., Attanasio, O., & Maro, V. D. (2012). The Impact of Oportunidades on Consumption, Savings and Transfers. Fiscal Studies, 33(3), 305–334.
Attanasio, O., Meghir, C., & Schady, N. (2010). Mexico’s conditional cash transfer programme. The Lancet,
375(9719), 980. https://doi.org/10.1016/S0140-6736(10)60432-1
Avitabile, C. (2012). Does Information Improve the Health Behavior of Adults Targeted by a Conditional Transfer Program? Journal of Human Resources, 47(3), 785–825. https://doi.org/10.3368/jhr.47.3.785
Banerjee, A., & Duflo, E. (2011). Poor Economics: A Radical Rethinking of the Way to Fight Global Poverty (First Edition edition). New York: PublicAffairs.
Behrman, J. R., Gallardo-García, J., Parker, S. W., Todd, P. E., & Vélez-Grajales, V. (2012). Are conditional cash transfers effective in urban areas? Evidence from Mexico. Education Economics, 20(3), 233–259. https://doi.org/10.1080/09645292.2012.672792
Brewis, A., SturtzSreetharan, C., & Wutich, A. (2018). Obesity stigma as a globalizing health challenge.
Globalization and Health, 14, 20. https://doi.org/10.1186/s12992-018-0337-x
Burkhauser, R. V., & Cawley, J. (2008). Beyond BMI: the value of more accurate measures of fatness and obesity
in social science research. Journal of Health Economics, 27(2), 519–529.
https://doi.org/10.1016/j.jhealeco.2007.05.005
Caliendo, M., & Kopeinig, S. (2008). Some Practical Guidance for the Implementation of Propensity Score
Matching. Journal of Economic Surveys, 22(1), 31–72.
https://doi.org/10.1111/j.1467-6419.2007.00527.x
Fernald, L. C., Gertler, P. J., & Neufeld, L. M. (2008). Role of cash in conditional cash transfer programmes for child health, growth, and development: an analysis of Mexico’s Oportunidades. The Lancet, 371(9615), 828–837. https://doi.org/10.1016/S0140-6736(08)60382-7
Fernald, L. C., Gertler, P. J., & Neufeld, L. M. (2009). 10-year effect of Oportunidades, Mexico’s conditional cash transfer programme, on child growth, cognition, language, and behaviour: a longitudinal follow-up study.
The Lancet, 374(9706), 1997–2005. https://doi.org/10.1016/S0140-6736(09)61676-7
Fernald, L. C. H., Gertler, P. J., & Hou, X. (2008a). Cash Component of Conditional Cash Transfer Program Is Associated with Higher Body Mass Index and Blood Pressure in Adults. The Journal of Nutrition,
138(11), 2250–2257. https://doi.org/10.3945/jn.108.090506
Fernald, L. C. H., Gertler, P. J., & Hou, X. (2008b). Oportunidades program participation and body mass index, blood pressure, and self-reported health in Mexican adults. Preventing Chronic Disease, 5(3), A81. Fiszbein, A., Schady, N., Ferreira, F. H. G., Grosh, M., Keleher, N., Olinto, P., & Skoufias, E. (2009). Conditional
Cash Transfers : Reducing Present and Future Poverty (World Bank Publications). The World Bank.
Retrieved from http://ideas.repec.org/b/wbk/wbpubs/2597.html
González-Flores, M., Heracleous, M., & Winters, P. (2012). Leaving the Safety Net: An Analysis of Dropouts in an Urban Conditional Cash Transfer Program. World Development, 40(12), 2505–2521. https://doi.org/10.1016/j.worlddev.2012.05.020
Hernandez, D., Gomez de Léon, J., & Vasquez, G. (1999). Mas oportunidades para las familias pobres:
evaluacion de resultados del programa de educacion, salud et alimentacion, primeros avances. Mexico
City: Secretaria de Desarrollo Social.
Hoddinott, J., & Bassett, L. (2008). Conditional Cash Transfer Programs and Nutrition in Latin America:
Assessment of Impacts and Strategies for Improvement (SSRN Scholarly Paper No. ID 1305326).
Rochester, NY: Social Science Research Network. Retrieved from
http://papers.ssrn.com/abstract=1305326
Hoddinott, J., & Skoufias, E. (2004). The Impact of PROGRESA on Food Consumption. Economic Development
and Cultural Change, 53(1), 37–61. https://doi.org/10.1086/423252
Leroy, J. L., García-Guerra, A., García, R., Dominguez, C., Rivera, J., & Neufeld, L. M. (2008). The Oportunidades program increases the linear growth of children enrolled at young ages in urban Mexico.
Levasseur, P. (2015). Causal effects of socioeconomic status on central adiposity risks: Evidence using panel data
from urban Mexico. Social Science & Medicine, 136–137, 165–174.
https://doi.org/10.1016/j.socscimed.2015.05.018
Levasseur, P. (2018). Implementing a regression discontinuity design to explore the heterogeneous effects of obesity on labour income: the case of Mexico. Journal of Public Health, 1–13. https://doi.org/10.1007/s10389-018-0925-5
Levine, J. A. (2015). Solving obesity without addressing poverty: Fat chance. Journal of Hepatology, 63(6), 1523– 1524. https://doi.org/10.1016/j.jhep.2015.07.029
McLaren, L. (2007). Socioeconomic status and obesity. Epidemiologic Reviews, 29, 29–48.
https://doi.org/10.1093/epirev/mxm001
Monteiro, C. A., Conde, W. L., & Popkin, B. M. (2001). Independent effects of income and education on the risk of obesity in the Brazilian adult population. The Journal of Nutrition, 131(3), 881S-886S.
Monteiro, Carlos A, Moura, E. C., Conde, W. L., & Popkin, B. M. (2004). Socioeconomic status and obesity in adult populations of developing countries: a review. Bulletin of the World Health Organization, 82(12), 940–946. https://doi.org//S0042-96862004001200011
Orozco, M., & Hubert, C. (2005). La focalizacion en el Programa de Desarrollo Humano Oportunidades de
Mexico (No. 32761) (p. 1). The World Bank. Retrieved from
http://documents.banquemondiale.org/curated/fr/734501468121495959/La-focalizacion-en-el-Programa-de-Desarrollo-Humano-Oportunidades-de-Mexico
Ravallion, M., Galasso, E., Lazo, T., & Philipp, E. (2005). What Can Ex-Participants Reveal about a Program’s Impact? Journal of Human Resources, XL(1), 208–230. https://doi.org/10.3368/jhr.XL.1.208
Runge, C. F. (2007). Economic consequences of the obese. Diabetes, 56(11), 2668–2672.
https://doi.org/10.2337/db07-0633
Skoufias, E. (2005). PROGRESA and its impacts on the welfare of rural households in Mexico (Research report No. 139). Washington, D.C.: International Food Policy Research Institute (IFPRI). Retrieved from http://ebrary.ifpri.org/cdm/ref/collection/p15738coll2/id/80436
Skoufias, E., Davis, B., & de la Vega, S. (2001). Targeting the Poor in Mexico: An Evaluation of the Selection of Households into PROGRESA. World Development, 29(10), 1769–1784. https://doi.org/10.1016/S0305-750X(01)00060-2
Smith, K. V., & Goldman, N. (2007). Socioeconomic differences in health among older adults in Mexico. Social
Science & Medicine, 65(7), 1372–1385. https://doi.org/10.1016/j.socscimed.2007.05.023
Sobal, J., & Stunkard, A. J. (1989). Socioeconomic status and obesity: a review of the literature. Psychological
TABLES
Table 1: Logit estimates used for matchings, average marginal effects
Prob(participant vs.
nonparticipant) Prob(stayer vs. leaver)
25-35 years old -0.00807 -0.146 (-1.000) (-1.414) 35-45 years old 0.00883 0.0267 (1.125) (0.266) 45-65 years old -0.0223*** 0.0776 (-2.674) (0.733) Sex (male) 0.0156** 0.0942 (2.550) (1.219) Primary education -0.0177*** -0.0764 (-2.733) (-0.878) Secondary education -0.0359*** -0.0819 (-4.508) (-0.793)
Informal salaried worker 0.0144* -0.111
(1.867) (-1.176)
Formal salaried worker -0.0360*** -0.152
(-3.269) (-1.030)
Self-employed worker 0.0116 0.0148
(1.264) (0.138)
Worked in 2005/06 -0.0211*** -0.0934
(-2.838) (-1.084)
Labor income of the HH-Q2 0.0267*** 0.133
(3.223) (1.214)
Labor income of the HH-Q3 0.0152* 0.422***
(1.897) (4.094)
Labor income of the HH-Q4 -0.00181 0.0707
(-0.215) (0.774)
Owned assets index -0.0177*** -0.00714
(-7.366) (-0.249)
Number of children 0.0242*** 0.0556**
(10.37) (2.110)
Demographic dependency ratio -0.0287*** -0.0755 (-3.767) (-0.744)
Treated in 2002 0.327***
(4.056) Infrastructural development index -0.0105*** -0.0413 (-3.592) (-1.000)
Constant -0.0121 0.00141
(-0.703) (0.00629)
Total observations 4,814 310
Number of untreated individuals 4,437 135
Number of treated individuals 377 175
Pseudo-R2 16.44 17.86
Notes: (1) HH’s income quartiles are sample-specific: from the whole sample in column 1 and from a subsample only including 2005/06’ participants (stayers and leavers) in column 2.
(2) z-statistics are in brackets: *** p<0.01, ** p<0.05, * p<0.1.
(3) : ref.= No education. : ref.= inactive, unoccupied et unpaid workers.
Table 2: Average treatment effect on the treated (ATET) regarding anthropometric indicators in urban areas BMI (kg/m²) WHtR (cm/cm) Stayer vs. Nonparticipant Leaver vs. Nonparticipant Stayer vs. Nonparticipant Leaver vs. Nonparticipant Baseline (2005/06) Untreated 27.241 27.241 0.563 0.563 Treated 27. 154 27. 114 0.574 0.556 Gap -0.127 -0.127 0.011 -0.006 Follow-up (2009/12) Untreated 28.284 28.284 0.582 0.582 Treated 26.991 28.376 0.571 0.586 Gap -1.294** -0.092 -0.011 0.004 Difference-in-differences -1.206*** 0.219 -0.022** 0.010 (DD) (-2.64) (0.40) (-2.53) (0.91) Triple difference (DDD) -1.426** -0.033** (-2.05) (-2.28) Total observations 6,939 6,896 6,810 6,768 Number of untreated 6,704 6,704 6,579 6,579 Number of treated 235 192 231 189
Notes: (1) The whole model is bootstrapped with 1,000 replications and standard-errors are cluster robust at the household level. Robust t-statistics (for the DD) and z-t-statistics (for the DDD) are in brackets: *** p<0.01, ** p<0.05, * p<0.1.
(2) Matched observations are weighted using the propensity scores estimated in the previous matching procedures.