HAL Id: hal-01176699
https://hal.archives-ouvertes.fr/hal-01176699
Submitted on 15 Jul 2015
HAL is a multi-disciplinary open access
archive for the deposit and dissemination of
sci-entific research documents, whether they are
pub-lished or not. The documents may come from
teaching and research institutions in France or
abroad, or from public or private research centers.
L’archive ouverte pluridisciplinaire HAL, est
destinée au dépôt et à la diffusion de documents
scientifiques de niveau recherche, publiés ou non,
émanant des établissements d’enseignement et de
recherche français ou étrangers, des laboratoires
publics ou privés.
Kurtz, Jonathan Weber, Laure Tougne
To cite this version:
Manuel Grand-Brochier, Antoine Vacavant, Guillaume Cerutti, Camille Kurtz, Jonathan Weber, et al..
Tree leaves extraction in natural images: Comparative study of pre-processing tools and segmentation
methods. IEEE Transactions on Image Processing, Institute of Electrical and Electronics Engineers,
2015, 24 (5), pp.1549-1560. �10.1109/TIP.2015.2400214�. �hal-01176699�
Tree leaves extraction in natural images:
Comparative study of pre-processing tools
and segmentation methods
Manuel Grand-Brochier, Antoine Vacavant, Guillaume Cerutti, Camille Kurtz, Jonathan Weber, Laure Tougne
Abstract—In this paper, we propose a comparative study of various segmentation methods applied to the extraction of tree leaves from natural images. This study follows the design of a mobile application, developed by Cerutti et al. (published in ReVeS Participation - Tree Species Classification Using Random Forests and Botanical Features. CLEF 2012), to highlight the impact of the choices made for segmentation aspects. All the tests are based on a database of 232 images of tree leaves depicted on natural background from smartphones acquisitions. We also propose to study the improvements, in terms of performance, by using pre-processing tools such as the interaction between the user and the application through an input stroke, as well as the use of color distance maps. The results presented in this paper shows that the method developed by Cerutti et al. (denoted Guided Active Contour), obtains the best score for almost all observation criteria. Finally we detail our online benchmark composed of 14 unsupervised methods and 6 supervised ones. Index Terms—Tree Leaves Segmentation, Guided Active Con-tour, Comparative Study, Distance Map, Pre-Processing Tools.
I. CONTEXT ANDMOTIVATION
In the context of the ReVeS Project (ANR-10-CORD-005), we have developed a mobile application, called Folia, and freely accessible on AppStore!, designed to identify tree species, based on the analysis of the shape of their leaves. One of the key steps of this application lies in the capacity and reliability of the extraction of the leaf in the image taken by the user. In response to a growing need to extract information from an image, for applications such as object recognition, video surveillance or assisted surgery in medical application, creating or optimizing segmentation tools still represents a real challenge. Since the early 70s and the emergence of computer science, many scientific and industrial researches have created various segmentation methods based on thresholds, non-linear modeling tools, clustering algorithms, or iterative deformations for example. It therefore becomes increasingly difficult to
Manuel Grand-Brochier is with the ISIT, UMR 6284 CNRS/Auvergne University, France, [email protected]
Antoine Vacavant is with the ISIT, UMR 6284 CNRS/Auvergne University, France, [email protected].
Guillaume Cerutti is with the LIRIS, UMR 6505 CNRS/Lyon University, France, [email protected]
Camille Kurtz is with the LIPADE, University Paris Descartes, France, [email protected]
Jonathan Weber is with the LORIA, UMR 7503 CNRS/Universit´e de Lorraine, France, [email protected]
Laure Tougne is with the LIRIS, UMR 6505 CNRS/Lyon University, France, [email protected]
determine which method fits best the needs of the user for a given application. The evaluation of segmentation algorithms is therefore an important element when choosing a method, as shown in recent articles [Mart01, Vojo13, Khan13, Soar13].
In order to analyze and validate choices opted in our appli-cation, we present in this article a comparative study of various segmentation methods. The aim is to highlight the performance of Guided Active Contour, a new segmentation approach developed by Cerutti et al. [Ceru13], and the usefulness of two pre-processing tools: the color distance map and the input stroke, on all analyzed methods. All tests proposed in this article focus on the extraction of tree leaves, however, it can be easily extended to other contexts of extraction of objects in a natural or complex environment.
After the state of the art (Section II), we detail the imple-mentation and the tools, composing our benchmark, used for our comparative study in Section III. Section IV is dedicated to the overall results, their interpretations and various illustra-tions. The conclusion is preceded by a brief presentation of our web-application presenting our benchmark in Section V.
II. STATE OF THE ART
There exists in the literature a variety of segmentation methods. We propose to focus on main ones, which we used throughout our comparative study. The first edge segmentation methods have appeared in the 70s and they were based on thresholding gradients or histograms [Otsu79, Marr80, Wang84, Cann86]. These methods rely on the reduction of a grayscale image into a binary image and for some, on the assumption that it contains only two classes of pixels. The aim is to determine an optimal threshold to separate foreground and background classes. Subsequently, Kass et al. [Kass87] introduced in 1987 the active contour (or snakes), aimed to deform an initial contour in order to better define the edge of the object to segment. Then, variations have been proposed, based on parametric models [Zimm02, Chan01] or coupled with tools such as B-splines [Brig00] for example. Other methods are based on clustering of regions, in order to isolate each object in the image. We can cite Split & Merge and MeanShift approaches [Horo74, Chen95, Coma02, Li10]. More recently, various improvements have been proposed [Lync06, Horv06, Kurt12]. In 1989, Greig et al. [Grei89] publish a method of image analysis based on the theory of graphcuts. The use of graphs was taken [Boyk01, Roth04, Felz04] to produce a segmentation based on region growing.
By using the analogy between image and topographic relief, Beucher et al. [Beuc79], and more recently Salman [Salm06], have proposed approaches based on watershed. Improvements have recently been made by Couprie et al. [Coup09] to opti-mize the performance of watershed and diversify its use. New approaches, emerging from ten years, are based on intelligent clustering of pixels. These superpixels methods are presented in [Acha12] and are quantitatively compared (in particular [Jian00], [Veda08] and [Levi09]) to highlight the performance of the SLIC (Simple Linear Iterative Clustering) approach. Based on these results, this method has been included, for example, in a segmentation tool of cellular structure [Lucc10], in medical imaging.
Nowadays, many segmentation methods exist and according to the specific use, it is difficult to choose between such methods. Moreover, optimizing their parameters is often a real challenge. To obtain better results, some authors proposed to add pre-processing steps to the segmentation workflow. In this context, Weber et al. proposed various works such as [Webe11], highlighting a segmentation technique based on quasi-flat zones. The novelty lies in the use of morphological tools, guided by the user, which apply the segmentation process on a pre-processed image (i.e. an over-segmentation of the image in quasi-flat zones). In our comparative study, we focus both on the segmentation of tree leaves and on adding initialization tools such as an input stroke or a distance map. Concerning the segmentation of tree leaves, research is emerging from the past fifteen years. The existing methods are first based on analysis on white background [Kuma12, Vall12], and on the use of pairs of images in order to apply a background extraction process [Teng11]. Thereafter some method of segmentation of tree leaves are oriented towards the analysis on natural background based on a single image [Neto06, Casa12, Yani14]. In order to propose an original method, Cerutti et al. introduced in [Ceru13] the Guided Active Contour method (denoted by GAC), dedicated to the segmentation of tree leaves on natural background. Regarding the initialization tools, the use of new technologies such as smartphones or touch screen, allows the user to interact with the image to provide additional high-level informations through input strokes. Another optimization is based on the choice of a color distance map measuring the similarity of the pixels in the image to the colors of the leaf, and used to enhance the contours and identify the various components of the image. The latter can be based on Gaussian, linear regression, geodesic distance or local mean for example. We can also cite an approach based on minimum barrier distance calculation [Kars12, Stra13]. The latter is notably used since 2012 in an application of interactive segmentation applied to medical imaging [Malm12].
III. SETTING UP OUR STUDY
In order to provide a detailed comparative study, we rely on the tree leaves database and a set of observation criteria extracted from the literature. The various optimization possi-bilities are characterized by the study of pre-processing tools, based for its part on the use of color distance maps and input stroke.
A. Databases
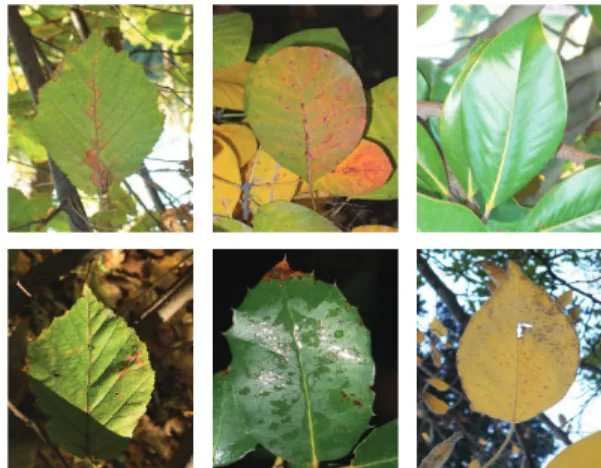
Our tree leaves database, presented in [Gran13] and illus-trated in Figure 1, is composed of 232 natural images of tree leaves 1 with ground truth that we have defined manually.
These images are photographs taken from the Pl@ntLeaves database [Go¨ea11]. They are simple or palmately lobed leaves on natural background. As it can be seen in Figure 1 this
Fig. 1: Sample images from the database with colorimetry, illumina-tion problems or defects.
database contains leaves in natural conditions with colorimetry changes, illumination problems, as well as defects.
B. Methods studied
We propose in our study a comparison of fourteen seg-mentation methods. We tested traditional approaches, such as: Thresholding [Otsu79], MeanShift [Chen95, Coma02], Pyramidal MeanShift [Li10], Graphcut [Boyk01], Watershed [Beuc93], Snakes [Chan01], B-splines Snake [Brig00], Grab-cut [Roth04] and Felzenszwalb [Felz04], whose parameters and configurations are those described in their respective article. To which are added five new approaches that are detailled here in after.
SLIC [Acha12] is a superpixel approach based on a cluster-ing of pixels and an user initialisation (in particular the number of superpixels), to extract segmented area. Figure 2 illustrate this method and the segmentation resulting. The selection of
Fig. 2: Example of segmentation obtained with SLIC algorithm. Left to right: initial image, SLIC with 200 superpixels, clusters selection, final segmentation.
clusters is based on the iterative analysis of nearest neighbors to keep those with similar characteristics and exclude others.
For all results presented with this approach, we studied a number of superpixels ranging from 100 to 300 (as mentioned by the author), to obtain for each image the best segmentation. Kurtz’s algorithm [Kurt12] is based on a hierarchical mul-tiresolution top-down strategy. This algorithm starts by cluster-ing the image content into a collection of coarse image patches sharing similar image color characteristics. Each one of this patch is then represented as a hierarchical structure using a Binary Partition Tree (BPT) derived from the Mathematical Morphology theory. Consequently, the image content can be considered as a forest of BPTs. Once this forest has been built, the next step of the algorithm consists of progressively segmenting each one of these trees. To this end, each cluster of BPTs is pruned (using an interactive cutting-tree strategy) producing a global segmentation of the image.
Weber’s algorithm [Webe11] is based on two steps. The particularity of this approach is that most of the computational effort is first made during on offline step to produce an over-segmentation of the image. Then the online interactive step involves user feedback to efficiently return objects of interest. Offline segmentation is achieved by computing quasi-flat zones from the image data. Online process is performed through a marker-based approach where the user draws scribbles over tree leaf. User feedback introduced during this online process may even result in a refinement of the initial oversegmentation. Power Watershed [Coup09] is based on the principle of energy minimization of some methods such as Graphcut for example. By introducing this step in a Watershed approach Couprie et al. obtained a more accurate analysis of the neigh-borhood of the points, which is used to refine the segmentation. The Power Watershed leads to a multilabel, scale and contrast invariant, unique global optimum obtained in practice in quasi-linear time.
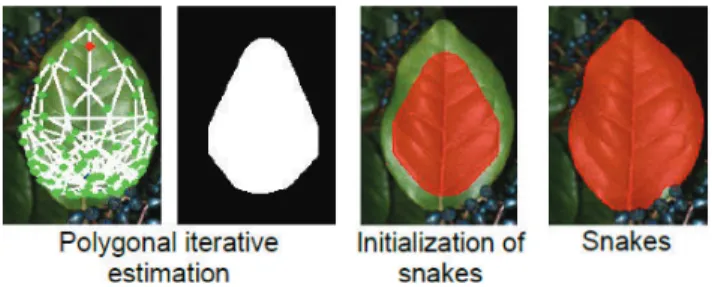
Finally, as detailed in [Ceru13], GAC consist of a two-step segmentation process, illustrate in Figure 3. First optimizing
Fig. 3: Illustration of GAC segmentation process.
iteratively a polygonal model (designed to account for the global shape of the leaf) to the content of the image. Starting from this estimation, active contours then evolve, guided by a general energy term (denoted by E), for a contour Γ delineating a region Ω(Γ), which can be expressed as:
E(Γ) = αELea f(Γ) + βEShape(Γ) + γEGradient(Γ)
+δESmooth(Γ) − ωEBalloon(Γ), (1)
with ELea f the dissimilarity energy based on the color distance
map, EShape the shape energy that ”guides” the contour by
constraining it to remain close to the polygon, EGradient the
gradient energy to fit the actual leaf border, ESmooth the
smoothing energy, EBalloon the balloon energy and α, β, γ,
δ, ω are weighting values in R.
Our study is therefore based on approaches with different possibilities of uses (see Table I). One method requires a continuous user interaction, and thirteen approaches can be used automatically (usually with input numerical parameters). To do this, for traditional interactive methods such as Graphcut or Grabcut, we set up automatically the target at the center of the image and the background in the corner. Finally, six of them can include an initial guiding shape in their pipeline.
TABLE I: Summary of methods studied and their possible uses (Automatic, with Graphical initialisation, with User interaction).
ref. Automatic Graphical User init. interact. Thresholding [Otsu79] !
MeanShift [Coma02] ! Pyr. MeanShift [Li10] ! Graphcut [Boyk01] ! Watershed [Beuc93] !
Snakes [Chan01] ! ! B-splines Snake [Brig00] ! ! Grabcut [Roth04] ! ! Felzenszwalb [Felz04] !
Kurtz [Kurt12] !
Weber [Webe11] ! ! Power Watershed [Coup09] !
SLIC [Acha12] ! ! GAC [Ceru13] ! !
C. Observation criteria
To analyse the quality of the segmentation result (accuracy, information extracted, etc), we opt for nine well known observation criteria. The Precision, the Recall and the Dice index (or F-measure), characterize the overall quality of the segmentation area. The Manhattan (or Matching) index allows to study the similarity rate of the entire image. The Jaccard (or Tanimoto) index, studies the similarity rate between two segmentation areas. These first five criteria are based on statistical tests of true or false positives (respectively denoted by TP and FP) and true or false negatives (respectively denoted by TN and FN). The Precision and the Recall are defined by:
Precision= T P
T P+ FP and Recall= T P
T P+ FN ; (2) the Dice index by:
Dice index= 2.0 ×Precision× Recall
Precision+ Recall ; (3) the Manhattan index by:
Manhattan index= T P+ T N
T P+ FP + T N + FN , (4) and the Jaccard index by:
Jaccard index= T P
T P+ FP + FN . (5) The other criteria are: the Hamming measure that calculates the number of disparities between two images, and is defined by: MH(I1⇒ I2) = n −
∑
R2∈I2 max R1∈I1 |R2∩ R1| , (6)where R1 and R2 are segmentation areas in images I1 and I2,
respectively, and n is the number of pixels of one image; the Hausdorff distance, which can be defined by the maximum gap between two segmentation areas:
dH(R1, R2) = max{ sup y∈R2 inf x∈R1 δ(x, y), sup x∈R1 inf y∈R2 δ(x, y)} , (7) in a metric space (E,δ); the mean absolute distance (denoted by MAD) that defines the average deviation of contour points between the ground truth (R1) and segmented area (R2),
defined by: MAD(R1, R2) = 1 M M
∑
m=1 (∥xm− ym∥, xm∈ R1, ym∈ R2) , (8)where xmand ymare contour points of R1 and R2respectively.
The contour points xm are determined by observing the
in-tensity changes in the neighborhood of each pixel of the first image and we then map each of them with its nearest neighbor among all the contour points ym from the second image; and
the structural similarity (denoted by SSIM [Wang04]) for the structural information extracted, defined by:
SSIM(R1, R2) =
(2m1m2+ k1)(2cov1,2+ k2)
(m2
1+ m22+ k1)(σ21+ σ22+ k2)
, (9) m1 and m2 are the average of R1 and R2, σ21 and σ22 are the
variance, cov1,2is the covariance, k1and k2are two coefficient
proportional to the dynamic range of the pixel values.
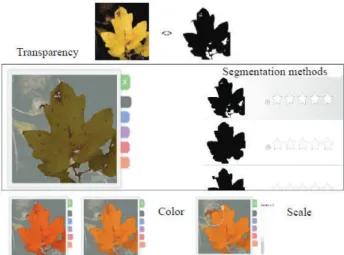
D. Details of color distance maps
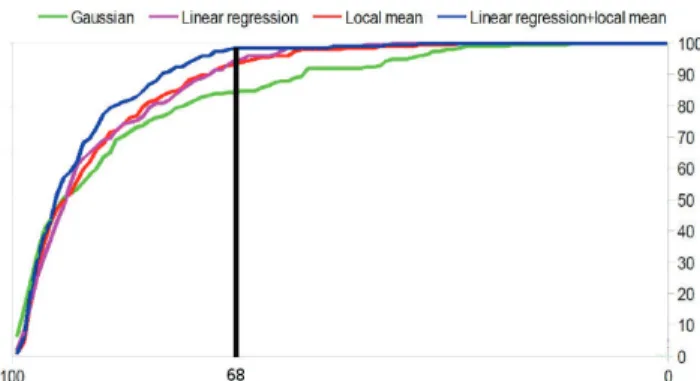
The use of the color distance map allows to enhance the image contrast and therefore the contours. This process is based on two assumptions: the object is in the center of the image and the background is in the corners. This process is characterized by five seedpoints respectively one for the center and four for the corners. The principle is to study the colors and variations around these points. Figure 4 shows three types of distance map: the first based on coupling global distance and local color [Ceru13] (denoted by GLC), only using one seedpoint (in the center); the second based on a geodesic distance (denoted by GD), using the five seedpoints; and the last one based on an approach of minimum barrier distance [Kars12, Stra13] (denoted by MBD), using a single seedpoint. The tool proposed by Cerutti et al. [Ceru13] is based on a model of global linear regression and on a local adaptive mean color with an evidence-based combination of them. This choice is justified by the fact that leaves may contain various colors, whose average deviation from the inside of the leave is greater than the deviation between the leave and the background. In Figure 5 we propose to study the number of images (as a percentage of the number of images constituting the database) obtained at a given Jaccard index. Our comparative analysis is based on four models: one Gaussian, a linear regression, a local mean and a combination of linear regression/local mean. We can observe that the tool proposed by Cerutti et al. allows us to obtain the best Jaccard index for 100% of the images (black line in Figure 5). The
Fig. 4: Examples of color distance maps: (left to right) initial image, coupling global distance/local color (GLC), geodesic distance (GD), minimum barrier distance (MBD).
Fig. 5: Rate of images obtained (y-axis, in %) depending on the value of Jaccard index (x-axis, in %), for four color distance estimations.
dissimilarity map is defined by the distance of every pixel x in the image to the color model:
dLinReg(x) = ∥(Lx, ax, bx) − (Lx, ˆa(Lx), ˆb(Lx))∥2 , (10)
in the L*a*b colorspace, where ˆa(Lx) = a0+ a1Lxand ˆb(Lx) =
b0+b1Lxare two affine fonctions defining the brightness value
estimated. The local adaptative mean color is estimated using a propagation scheme, that updates the local estimated color by considering the 8 nearest neighbours (denoted by N8) of
pixel x and is defined by: ∀y ∈ N8(x), ( ¯Ly, ¯ay, ¯by) =
!
αB + (1 − α)C, if ∥B −C∥2<θ
C, otherwise ,
(11) with B= (Lx, ax, bx), C = ( ¯Lx, ¯ax, ¯bx) and ¯k is the average
value of k in the neighborhood. The final map is based on the combination of the elements detailed above, according to the theory of evidence defined by Shafer [Shaf76]. This algorithm uses the basic belief assignments for each pixel to determine its belonging with a minimum degree of uncertainty.
The two other color distance maps are defined on subsets space of the image points. The principle lies in estimating the shortest distance between a point of the object to be extracted and the background. In [Stra13], the barrier cost function of a path is the difference of the maximum and minimum intensity along the path. The minimum barrier distance between two points is defined by the barrier cost of the cheapest path with
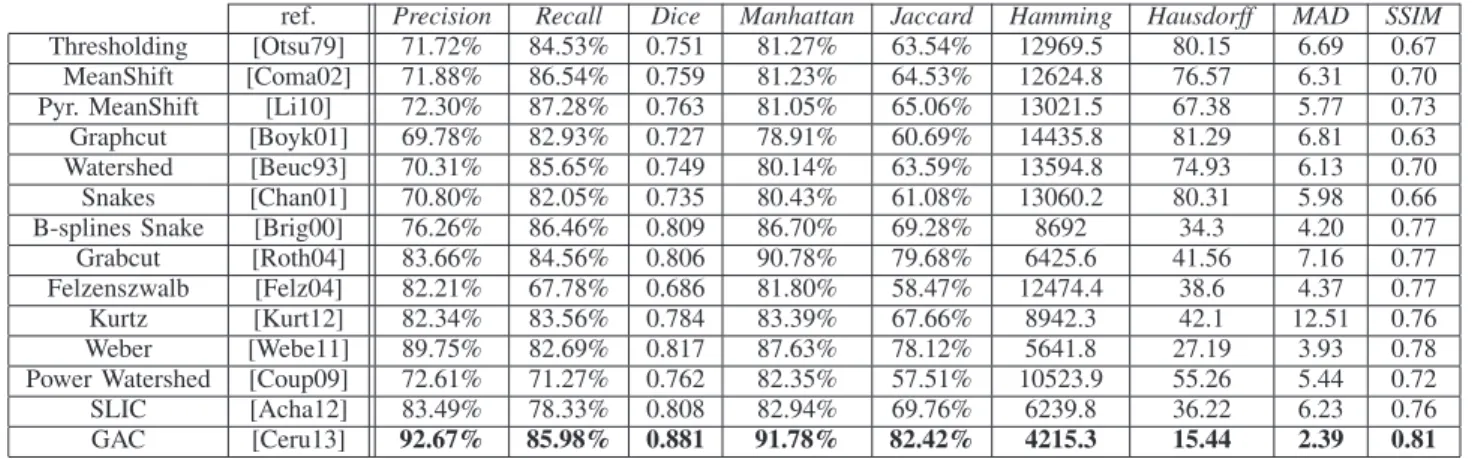
TABLE II: Average Precision, Recall, Dice index, Manhattan index, Jaccard index, Hamming measure, Hausdorff distance, MAD and SSIM of 232 images. Thirteen segmentation methods are presented, with NO input stroke and with NO color distance map.
ref. Precision Recall Dice Manhattan Jaccard Hamming Hausdorff MAD SSIM Thresholding [Otsu79] 71.72% 84.53% 0.751 81.27% 63.54% 12969.5 80.15 6.69 0.67 MeanShift [Coma02] 71.88% 86.54% 0.759 81.23% 64.53% 12624.8 76.57 6.31 0.70 Pyr. MeanShift [Li10] 72.30% 87.28% 0.763 81.05% 65.06% 13021.5 67.38 5.77 0.73 Graphcut [Boyk01] 69.78% 82.93% 0.727 78.91% 60.69% 14435.8 81.29 6.81 0.63 Watershed [Beuc93] 70.31% 85.65% 0.749 80.14% 63.59% 13594.8 74.93 6.13 0.70 Snakes [Chan01] 70.80% 82.05% 0.735 80.43% 61.08% 13060.2 80.31 5.98 0.66 B-splines Snake [Brig00] 76.26% 86.46% 0.809 86.70% 69.28% 8692 34.3 4.20 0.77 Grabcut [Roth04] 83.66% 84.56% 0.806 90.78% 79.68% 6425.6 41.56 7.16 0.77 Felzenszwalb [Felz04] 82.21% 67.78% 0.686 81.80% 58.47% 12474.4 38.6 4.37 0.77 Kurtz [Kurt12] 82.34% 83.56% 0.784 83.39% 67.66% 8942.3 42.1 12.51 0.76 Weber [Webe11] 89.75% 82.69% 0.817 87.63% 78.12% 5641.8 27.19 3.93 0.78 Power Watershed [Coup09] 72.61% 71.27% 0.762 82.35% 57.51% 10523.9 55.26 5.44 0.72 SLIC [Acha12] 83.49% 78.33% 0.808 82.94% 69.76% 6239.8 36.22 6.23 0.76 GAC [Ceru13] 92.67% 85.98% 0.881 91.78% 82.42% 4215.3 15.44 2.39 0.81
between the points. In [Kars12], the vectorial minimum barrier distance (MBD) was introduced. This method can be used to compute distance transforms on color images. The cost of a pathπ is given by a path-cost function
C
( f , π). Let Π be theset of all paths between p and q in (Zn,α). The path-cost
distance between p and q is ρA(p, q) = min
π∈Π
C
( f , π) . (12) The minimum barrier distance as defined in [Stra13] is ob-tained by settingC
( f , π) = " max i [ f (pi)] − minj [ f (pj)] # . (13) With the notation ⃗f= ( f1, f2, f3) for RGB-values, we used thefollowing path-cost function for color images:
C
$⃗f,π% = m∑
k=1 max i, j & &fk(pi) − fk(pj) & & . (14) Note that this path-cost function corresponds to the L1diam-eter in RGB-space of the points in the path (see [Kars12] for details).
E. Input stroke
Our study focuses on segmentation methods that can be used in smartphones applications. Consequently, user interaction has a significant advantage. Therefore, for methods allowing it, we propose to add an input stroke, illustrated in Figure 6, allowing the user to locate the leaf in the image and to initialize process. For GAC and SLIC approaches, this mark is used to have an a priori knowledge on the local color, and for other methods, it allows to initialize the determination of the contour.
IV. RESULTS ANDDISCUSSION
Our comparative study is divided into different steps. First of all, we study the performance obtained by each method without pre-processing tools. To analyze the possible opti-mizations, we then present the results obtained with the use of color distance maps, finally we add user knowledge through input strokes. We also study the influence of segmentation approaches (with or without additional processings) for the description of tree leaves.
Fig. 6: Sample images of tree leaves and their respective input stroke.
A. Initial results
The first results, presented in Table II, show the performance obtained for each method, without color distance map or input stroke. From a general point of view, the Guided Active Contour approach provides the highest scores for all criteria. More precisely, the average similarity rate (defined by the Precision, the Recall and the Jaccard index) is increased by nearly 17.25% on average compared to the other methods. The quality coefficient (given by the Dice index) is increased by 15.61%. One of these consequences is the improvment of the robustness to contrast problems. We propose in Figure 7 an illustration of this problem for three segmentation results.
Fig. 7: Example of contrast problem for three segmentation methods: (left to right) ground truth, Pyr. MeanShift, Watershed and GAC.
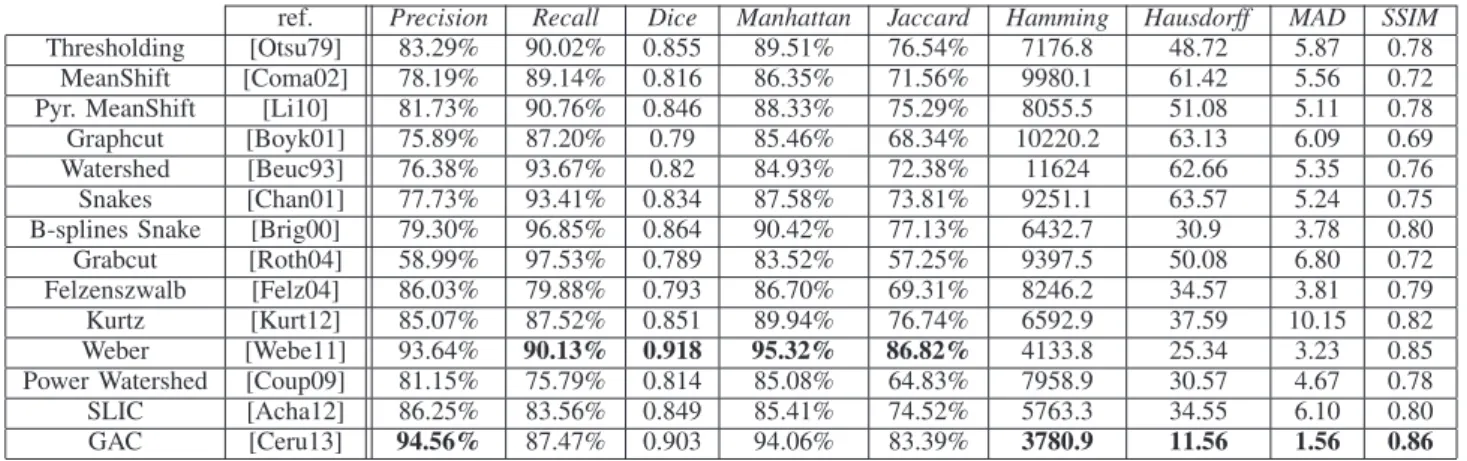
TABLE III: Average Dice index, Manhattan index, Hamming measure, Hausdorff distance, MAD and SSIM of 232 images. Thirteen segmentation methods are presented, with NO input stroke and WITH color distance map based on global distance and local color.
ref. Precision Recall Dice Manhattan Jaccard Hamming Hausdorff MAD SSIM Thresholding [Otsu79] 83.29% 90.02% 0.855 89.51% 76.54% 7176.8 48.72 5.87 0.78 MeanShift [Coma02] 78.19% 89.14% 0.816 86.35% 71.56% 9980.1 61.42 5.56 0.72 Pyr. MeanShift [Li10] 81.73% 90.76% 0.846 88.33% 75.29% 8055.5 51.08 5.11 0.78 Graphcut [Boyk01] 75.89% 87.20% 0.79 85.46% 68.34% 10220.2 63.13 6.09 0.69 Watershed [Beuc93] 76.38% 93.67% 0.82 84.93% 72.38% 11624 62.66 5.35 0.76 Snakes [Chan01] 77.73% 93.41% 0.834 87.58% 73.81% 9251.1 63.57 5.24 0.75 B-splines Snake [Brig00] 79.30% 96.85% 0.864 90.42% 77.13% 6432.7 30.9 3.78 0.80 Grabcut [Roth04] 58.99% 97.53% 0.789 83.52% 57.25% 9397.5 50.08 6.80 0.72 Felzenszwalb [Felz04] 86.03% 79.88% 0.793 86.70% 69.31% 8246.2 34.57 3.81 0.79 Kurtz [Kurt12] 85.07% 87.52% 0.851 89.94% 76.74% 6592.9 37.59 10.15 0.82 Weber [Webe11] 93.64% 90.13% 0.918 95.32% 86.82% 4133.8 25.34 3.23 0.85 Power Watershed [Coup09] 81.15% 75.79% 0.814 85.08% 64.83% 7958.9 30.57 4.67 0.78 SLIC [Acha12] 86.25% 83.56% 0.849 85.41% 74.52% 5763.3 34.55 6.10 0.80 GAC [Ceru13] 94.56% 87.47% 0.903 94.06% 83.39% 3780.9 11.56 1.56 0.86
index, the Hausdorff distance and the Hamming measure, are also higher than those of other approaches. Performances are improved of: 1.1% (relative to GrabCut) to 16.3% (relative to Graphcut) for Manhattan index; 43.3% (relative to Weber approach) and 81.1% (relative to Graphcut) for Hausdorff distance; and 25.3% (relative to Weber approach) to 70.8% (relative to Graphcut) for Hamming measure. These three criteria notably characterize problems of under- and over-segmentation. The Figure 8 shows the consistency and im-provement brought by the Guided Active Contour method. The last two criteria (the MAD and the SSIM) are used to
Fig. 8: Example of over-segmentation problem for three segmentation methods: (left to right) ground truth, Snakes, MeanShift and GAC.
study respectively the shape of the segmentation based on the analysis of contour points, and the quantity of informa-tion extracted relatively to the ground truth. The observainforma-tion remains the same, the performance offered by the GAC are on average higher by almost 61.9% for MAD and 12.2% for SSIM compared to other methods. Therefore the Guided Active Contour approach considerably improves the extraction of tree leaves. Nevertheless, despite improved performance, this segmentation method has some limitations, as shown in the Figure 7 and 8 with particular problems of under-segmentation. In order to overcome these defects we propose to study the impact of a pre-processing step for defining a color distance map.
B. Influence of the color distance maps
We presented in a previous article [Gran14] three different distance maps based on: geodesic distance; an approach of minimum barrier distance; coupling global distance and local
color, and a preliminary study of their respective influence on the segmentation methods. It follows that the use of the tool implemented by Cerutti and al. [Ceru11] significantly improves the performance of all approaches, as shown in Figure 10 for B-splines Snakes and Guided Active Contour approaches for example. Table III presents these results, with the addition of the four latest methods tested and three additional criteria.
From a general point of view, one can note that the performance have been improved, both for the quality of segmentation (8% average increase for the Dice index), and for the shape of the segmented area (15% improvement for the MAD). The problems of under- or over-segmentation were reduced (respectively by 18% and 21% for the Hamming measure and the Hausdorff distance). These improvements lead to the extraction of a more relevant information, which results in an average increase of 6% of the SSIM.
We also note that the approach proposed by Weber et al. obtains, on average, higher performances than the GAC method for few criteria (Dice index for example), as it can be observed in Figure 9.
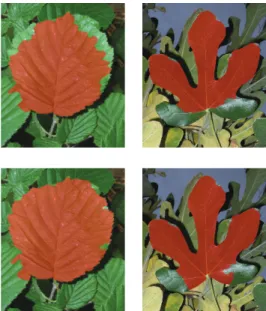
Initial image GAC (0.929) Weber (0.827)
Initiale image GAC (0.883) Weber (0.968)
Fig. 9: Segmentation results (and Dice index resulting) obtained for distance maps based on coupling Global Distance/Local Color, for Weber and Guided Active Contour approaches.
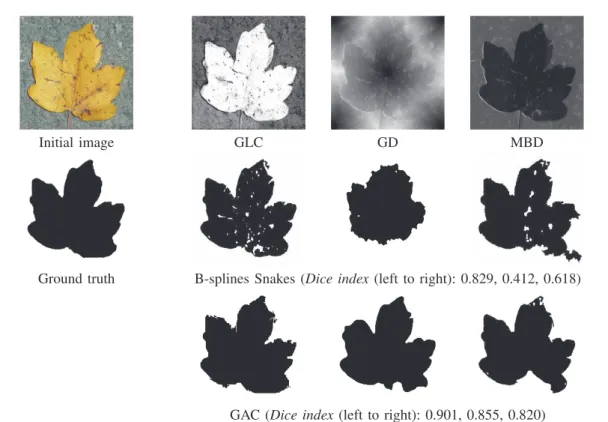
Initial image GLC GD MBD
Ground truth B-splines Snakes (Dice index (left to right): 0.829, 0.412, 0.618)
GAC (Dice index (left to right): 0.901, 0.855, 0.820)
Fig. 10: Segmentation results obtained for distance maps based on (left to right) : coupling Global Distance/Local Color, Geodesic Distance, Minimum Barrier Distance, for B-splines Snakes and Guided Active Contour approaches.
TABLE IV: Average Dice index, Manhattan index, Hamming measure, Hausdorff distance, MAD and SSIM of 232 images. Five segmentation methods are presented, WITH input stroke and WITH color distance map based on coupling global distance and local color.
ref. Precision Recall Dice Manhattan Jaccard Hamming Hausdorff MAD SSIM Snakes [Chan01] 86.98% 90.08% 0.876 91.43% 79.59% 6094.2 40.92 5.12 0.81 B-splines Snake [Brig00] 80.11% 96.23% 0.866 90.67% 77.44% 6211.3 29.13 3.45 0.81 Grabcut [Roth04] 63.49% 96.61% 0.715 66.41% 60.79% 20580.4 61.3 6.44 0.62 Weber [Webe11] 94.81% 91.65% 0.925 95.34% 87.27% 2947.5 22.62 2.49 0.86 SLIC [Acha12] 87.39% 84.77% 0.861 87.12% 76.28% 5466.2 29.94 5.72 0.81 GAC [Ceru13] 95.16% 90.79% 0.927 95.45% 86.99% 2872.7 10.82 1.06 0.87
However, the approach developed by Cerutti et al. defines better the contours of the segmented area (MAD), is less inconsistency (under- or over-segmentation) and allows us to extract more precise information (Precision and SSIM). Concerning the other criteria, the difference appears mainly from images with lobed leaves. Indeed, we were able to realize that for those specific cases, the approach of Weber et al. defines better each lobe. Operating on a smartphone application, an interaction with the user is possible. Therefore, in order to overcome the problem of defining some lobed leaves, we propose to add a second pre-processing tool based on an input stroke.
C. Influence of the input strokes
This second pre-processing tool enhances the performance of four of the five methods that use it. Table IV shows a decrease of scores for Grabcut method, and improvement for the other approaches. Methods implemented by Weber et al. and Cerutti et al. get the best performances with an average
increase ranging from 0.8% to 2.6% for the segmentation qual-ity (Dice index). Regarding the shape of the segmentation and the information extracted, the improvements are respectively by 23% (for Weber’s method) to 32% (for GAC) for the MAD and by 1.2% for the SSIM. We also observe that the input stroke allows GAC to overcome Weber approach on some measures. Indeed, this latter has now lower scores for Dice and Manhattan indices. It nevertheless stays ahead for Recall and Jaccard index.
The analysis of segmentation results shows that under-segmentation problems have been reduced, particularly for the lobed leaves, as shown in Figure 12. We can see that there are still some imperfections, however the contribution of the input stroke is undeniable and essential to overcome the under-segmentation problem.
This tool is still dependent on the user and its visualization of the tree leaf. Indeed, we can observe in Figure 13 that for the same initial image, two different input strokes give two different results. Therefore, the user must ensure that the input stroke is consistent, so that the result is optimal.
Initial image No pre-processing + GLC + Input stroke
Ground truth Grabcut (Dice index (left to right): 0.594, 0.661, 0.723)
GAC (Dice index (left to right): 0.876, 0.911, 0.934)
Fig. 11: Segmentation results obtained after the successive addition to the original image, a color distance map (GLC) and an input stroke, for Grabcut and Guided Active Contour approaches.
Fig. 12: Examples of (top) shape and under-segmentation problems and (bottom) improvement by the addition of an input stroke, for Guided Active Contour.
Throughout Section IV we have shown that the use of Guided Active Contour method coupled with two pre-processing tools, allows us to obtain the best overall perfor-mance for the problem of extracting tree leaves (as shown in Figure 11). The smartphone application proposed in our project relies on these segmentation to describe and classify leaves. We propose to study the impact of this approach on the description of leaves.
Fig. 13: Examples of initial image with (top) good input stroke / (bottom) bad input stroke and the resulting segmentation, for Guided Active Contour.
D. Impact on the description of tree leaves
In our work, the description of a tree leaf is based on measuring the curvature scale space [Mokh92] (denoted by CSS) for defining concave and convex contours. The curva-ture measurement is calculated on the contour by estimating derivatives with increasing neighborhoods. For the point(x, y),
the curvature at a given scale is defined by: c(x, y) =x
′· y′′− y′· x′′
(x′2+ y′2)32
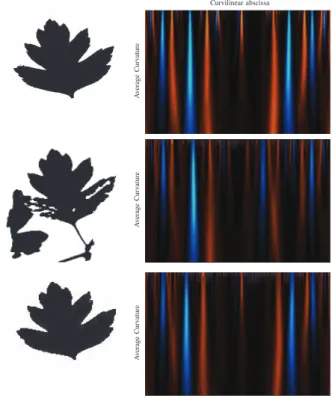
(15) The resulting histogram, shown in Figure 14, is used to describe the shape of the leaf and highlight the number of lobes (number of lines) and thickness (length of lines). Calculations
Curvilinear abscissa A v erage Curv ature
Fig. 14: Examples of description of tree leaf (left) and the resulting histogram based on measuring the CSS (right). Each line represents the curvature at a given scale.
relating to CSS are detailed in [Ceru13]. To analyze and characterize the quality and accuracy of the description, we propose to rely on the earth mover distance [Rubn98] (denoted by EMD). This latter is defined by :
EMD(p, q) =∑
m
i=1∑nj=1Ci j∥pi− qj∥
min(ωp,ωq)
, (16)
where Ci j is the amount of weight of pi matched to qj, and
ωp, ωq are the corresponding weights of the points. This
distance is generally used to evaluate dissimilarity between two images or two histograms, in our case between ground truth and segmentation method studied. The results obtained are shown in Figure 15, thereby summarizing the average EMD and standard deviation.
Fig. 15: Average earth mover distance and standard deviation ob-tained by each segmentation method studied (supervised or not).
The study of this graph allows us to highlight the best results offered by the use of the segmentation from GAC approach, with a value closer to 0.3 for the EMD and a lower standard deviation, characterizing a more accurate description.
Figure 16 illustrates the impact of segmentation on the CSS calculation. We can observe that the right side of CSS from Felzenswalb approach (second line) is different than the ground truth (first line). These results confirm the conclusions
Curvilinear abscissa A v erage Curv ature A v erage Curv ature A v erage Curv ature
Fig. 16: (Top to bottom) CSS histograms obtained with ground truth segmentation, with Felzenszwalb approach and finally with GAC.
set out in the previous section. Indeed, the problem of over-segmentation for Felzenszwalb’s approach causes a modifica-tion (shift) of the histogram and therefore a worse descripmodifica-tion. This problem is lessened with better segmentation, such as provided by the GAC method. Currently, there are still some problematic cases. For example, in Figure 17, we can observe a GAC segmentation, having a Dice index equal to 0.91. The
Curvilinear abscissa A v erage Curv ature A v erage Curv ature
Fig. 17: (Top to bottom) CSS histograms obtained with ground truth segmentation and with GAC.
problem lies in the under-segmentation of the central lobe, which deteriorates the computation of the CSS. Indeed, the resulting histogram is shifted, or has a different number of ”peaks”, and we obtained an EMD equal to 1.076 (reminder: average value of the EMD for the GAC is 0.311). We are currently exploring various possible optimizations to manage these sensitive cases.
E. Additional results
1) Standard deviation: We demonstrated that the addition of pre-processing tools can improve the performance of seg-mentation methods. For supervised approaches (Snakes, B-splines Snake, Grabcut, Weber and GAC), we propose to study their stability through the standard deviations obtained for all observation criteria. For better readability, we present, in Figure 18, three of the nine criteria studied. We can note that
Fig. 18: Standard deviation for three observations criteria. We focus on the supervised segmentation methods (with input stroke).
for the observation criteria, the method developed by Cerutti et al. is the most stable with the lowest standard deviation. Our second observation concerns the largest deviation obtained by the MAD measure, which characterizes the shape of the segmentation. Therefore, future work will focus on optimizing the definition of contours of the segmented area.
2) Computation time: Tests were performed on laptop with Intel! i7-3610QM CPU (2.30Ghz), 8Go RAM and the average size of the images is 450× 800 pixels. In terms of computation time the guided active contour has a higher cost than conventional methods. Indeed, these approaches usually require fast calculation and few or no iteration. Values are approximately equal to (in seconds): 0.09 for Thresholding, 0.6 for MeanShift, 1.5 for Snakes, 2.4 for Grabcut, 8 for Power Watershed or also 60 for B-spline Snake. However, in view of its performance and its use of interactive smartphone, our method preserves an acceptable computation time around 3.5 seconds per segmentation.
V. DATA SHARING ANDWEB INTERFACE
All methods and observation criteria presented in this article compose our benchmark dedicated to the study and validation of segmentation approaches. The database proposed for tests is made up of tree leaves, however, a generalization to other
images is obviously possible. In order to share this benchmark and make it scalable, we have developed a website (Figure 19), which is available at: http://liris.univ-lyon2.fr/reves. Various
Fig. 19: Example of our website page dedicated to the analysis, voting and ranking for all segmentation methods included in our benchmark. Various display options are available, such as scale change or readjustment of the segmented region.
options are available to the user: expand the database with new images, at first limited to tree leaves; analyze, grade and rank each segmentation method, allowing us to collect various statistics related to the observations presented in this article; extract comparative results by selecting only appro-priate methods; or also propose new observation criteria or new segmentation approaches. The user can add an executable in our benchmark, leading to the update of all comparative statistics.
VI. CONCLUSION
We presented in this paper a comparative study of thirteen methods of segmentation applied to a problem of extraction of tree leaves in smartphone images. We firstly highlighted the performance obtained by the Guided Active Contour approach, developed in our project by Cerutti et al.. Improving the accu-racy and quality of segmentation, but with defects (particularly related to the under-segmentation), we then analyzed the con-tributions of two pre-processing steps: the use of color distance maps and the interaction application/user through an input stroke. This analysis allowed us to highlight the relevance of the choices made for the distance map (coupling global distance and local color), and the interest to interact with the user, both for the GAC method and for all other approaches. This work is currently underway through the development of our website, which will provide a scalable benchmark, dedicated to the analysis and validation of segmentation tools. This web-based platform will initially focus on the extraction of tree leaves and then will be generalized to other applications such as medical imaging, for example.
ACKNOWLEDGMENT
This work is part of ReVeS2 project (REconnaissance de VEgetaux pour des interfaces Smartphones) supported by the French National Agency for Research with the reference ANR-10-CORD-005.
REFERENCES
[Acha12] R. Achanta, A. Shaji, K. Smith, A. Lucchi, P. Fua and S. Ssstrunk, SLIC Superpixels compared to state-of-the-art superpixel methods. Pattern Analysis and Machine Intelligence, 2012, vol. 34(11), p. 2274-2282. [Beuc79] S. Beucher and C. Lantujoul, Use of watersheds in
contour detection. International Workshop on Image Processing: Real-time Edge and Motion Detection, 1979.
[Beuc93] S. Beucher and F. Meyer, The morphological approach to segmentation: the watershed transformation. Optical Engineering, 1993, p. 433-481.
[Boyk01] Y. Boykov and M. Jolly, Interactive graph cuts for op-timal boundary and region segmentation. International Conference on Computer Vision, 2001, vol. 1, p. 105-112.
[Brig00] P. Brigger, J. Hoeq and M. Unser, B-spline snakes: a flexible tool for parametric contour detection. IEEE Transactions on Image Processing, 2000, vol. 9(9), p. 1484-1496.
[Cann86] J. Canny, A computational approach to edge detection. IEEE Transactions on Pattern Analysis and Machine Intelligence, 1986, vol. 8(6), p. 679-698.
[Casa12] D. Casanova, J. Florindo, W. Goncalves and O. Bruno, IFSC/USP at ImageCLEF 2012: Plant Identification Task. Online Working Notes/Labs/Workshop, 2012. [Ceru13] G. Cerutti, L. Tougne, J. Mille, A. Vacavant and D.
Co-quin, Understanding leaves in natural images - a model approach for tree species identification. Computer Vi-sion and Image Understanding, 2013, vol. 117(10), p. 1482-1501.
[Chan01] T. Chan and L. Vese, Active Contours Without Edges. IEEE Transactions on Image Processing, 2001, vol. 10(2), p. 266-277.
[Chen95] Y. Cheng, Mean Shift, Mode Seeking, and Clustering. IEEE Transactions on Pattern Analysis and Machine Intelligence, 1995, vol. 17(8), p. 790-799.
[Coma02] D. Comaniciu and P. Meer, Mean Shift: A robust approach toward feature space analysis. IEEE Trans-actions on Pattern Analysis and Machine Intelligence, 2002, vol. 24(5), p. 603-619.
[Coup09] C. Couprie, L. Najman, L. Grady and H. Talbot, Power Watersheds: A new Image Segmentation Framework Extending Graph Cuts, Random Walker and Optimal Spanning Forest. International Conference on Com-puter Vision, 2009, p. 731-738.
[Felz04] P. Felzenszwalb and D. Huttenlocher, Efficient Graph-Based Image Segmentation. International Journal on Computer Vision, 2004, vol. 59(2), p. 167-181. [Go¨ea11] H. Go¨eau, P. Bonnet, A. Joly, N. Boujemaa, D.
Barthelemy, J. Molino, P. Birnbaum, E. Mouysset and M. Picard, The clef 2011 plant images classification task, 2011.
[Gran13] M. Grand-Brochier, A. Vacavant, G. Cerutti, K. Bianchi and L. Tougne, Comparative Study of Segmentation Methods for Tree Leaves Extraction. Visual Interfaces for Ground Truth collection in computer vision Appli-cations, 2013, vol.7.
2http://liris.univ-lyon2.fr/reves/content/en/index.php
[Gran14] M. Grand-Brochier, A. Vacavant, R. Strand, G. Cerutti and L.Tougne, About the impact of pre-processing tools on segmentation methods, Applied for tree leaves ex-traction. International Conference on Computer Vision Theory and Applications, 2014.
[Grei89] D. Greig, B. Porteous and A. Seheult, Exact maximum a posteriori estimation for binary images. Journal of the Royal Statistical Society, 1989, vol. 51, p. 21-279. [Horo74] S. Horowitz and T. Pavlidis, Picture segmentation by
a directed split and merge procedure. International Conference on Pattern Recognition, 1974, p. 424-433. [Horv06] J. Horvath, Image segmentation using fuzzy c-means.
Symposium on Applied Machine Intelligence, 2006. [Jian00] Jianbo Shi and Jitendra Malik, Normalized cuts and
image segmentation. IEEE Transactions on Pattern Analysis and Machine Intelligence, 2000, vol. 22(8), p. 888-905.
[Kars12] A. Karsnas, R. Strand and P. Saha, The vectorial Minimum Barrier Distance. International Conference on Pattern Recognition, 2012, p. 792-795.
[Kass87] M. Kass, A. Witkin and D. Terzopoulos, Snakes : Ac-tive contour model. International Journal on Computer Vision, 1987, p. 321-331.
[Khan13] A. M. Khan and S. Ravi, Image Segmentation Methods: A Comparative Study. International Journal of Soft Computing and Engineering, 2013, vol. 3(4), p. 84-92. [Kuma12] N. Kumar, Leafsnap: a computer vision system for auto-matic plant species identification. European Conference on Computer Vision, 2012, p. 502-516.
[Kurt12] C. Kurtz, N. Passat, P. Ganc¸arski, A. Puissant, Extrac-tion of complex patterns from multiresoluExtrac-tion remote sensing images: A hierarchical top-down methodology. Pattern Recognition, 2012, vol. 45(2), p. 685-706. [Levi09] A. Levinshtein, A. Stere, K. Kutulakos, D. Fleet, S.
Dickinson and K. Siddiqi, Turbopixels: fast superpixels using geometric flows. IEEE Transactions on Pattern Analysis and Machine Intelligence, 2009, vol. 31(12), p. 2290-2297.
[Li10] S. Li, H. Chang and C. Zhu, Adaptative pyramid mean shift for global real-time visual tracking. Image and Vision Computing, 2010, vol. 28(3), p. 424-437. [Lucc10] A. Lucchi, K. Smith, R. Achanta, V. Lepetit and P. Fua,
A fully automated approach to segmentation of irregu-larly shaped cellular structures in EM images. Medical Image Computing and Computer Assisted Intervention, 2010, vol. 6362(2), p. 463-471.
[Lync06] M. Lynch, O. Ghita and P. Whelan, Automatic segmen-tation of the left ventricle cavity and myocardium in MRI data. Computers in Biology and Medicine, 2006, vol. 36(4), p. 389-407.
[Malm12] F.Malmberg, R. Strand, J. Kullberg, R. Nordenskjold and E. Bengtsson, Smart Paint - A New Interactive Segmentation Method Applied to MR Prostate Seg-mentation. Medical Image Computing and Computer Assisted Intervention, 2012.
[Marr80] D. Marr and E. Hildreth, Theory of Edge Detection. Biological Sciences, 1980, vol. 207(1167), p. 187-217. [Mart01] D.Martin, C. Fowlkes, D. Tal and J.Malik, A database of human segmented natural images and its application to evaluating segmentation algorithms and measuring ecological statistics. International Conference on Com-puter Vision, 2001, vol. 2, p. 416-423.
[Mokh92] F. Mokhtarian and A. Mackworth, A theory of multi-scale, curvature-based shape representation for planar curves. IEEE Transactions on Pattern Analysis and Machine Intelligence, 1992, vol. 14 (8), p. 789-805. [Neto06] J. Neto, G. Meyer and D. Jones, Individual leaf
ex-tractions from young canopy images using Gustafson-Kessel clustering and a genetic algorithm. Computers and Electronics in Agriculture, 2006, vol. 51, p. 66-85. [Otsu79] N. Otsu, A threshold selection method from gray-level
[Roth04] C. Rother, V. Kolmogorov and A. Blake, ”Grabcut”: interactive foreground extraction using iterated graph cuts. Special Interest Group on GRAPHics, 2004, p. 39-314.
[Rubn98] Y. Rubner, C. Tomasi and L. Guibas, A metric for distributions with applications to image databases. In-ternational Conference on Computer Vision, 1998, p. 59-66.
[Salm06] N. Salman, Image segmentation based on watershed and edge detection techniques. International Arabe Journal of Information Technology, 2006, vol. 3(2), p. 104-110. [Shaf76] G. Shafer, A Mathematical Theory of Evidence.
Prince-ton University Press, 1976.
[Soar13] J. Soares and D. Jacobs, Efficient segmentation of leaves in semi-controlled conditions. Machine Vision and Applications, 2013, vol. 24(8), p. 1623-1643. [Stra13] R. Strand, K. Ciesielski, F. Malmberg and P. Saha, The
minimum barrier distance. Computer Vision and Image Understanding, 2013, vol. 117(4), p. 429-437. [Teng11] C. Teng, Y. Kuo and Y. Chen, Leaf segmentation,
classification, and three-dimensional recovery from a few images with close viewpoints. Optical Engineering, 2011, vol. 50(3).
[Vall12] N. Valliammal and S. Geethalakshmi, Plant Leaf Seg-mentation Using Non Linear K means Clustering. In-ternational Journal of Computer Science Issues, 2012, vol. 9(1), p. 212-218.
[Veda08] A. Vedaldi and S. Soatto, Quick shift and kernel methods for mode seeking. European Conference on Computer Vision, 2008.
[Vojo13] H. Vojodi, A. Fakhari and A. Moghadam, A new evaluation measure for color image segmentation based on genetic programming approach. Image and Vision Computing, 2013, vol. 31(11), p. 877-886.
[Wang84] S. Wang and R. Haralick, Automatic multithreshold selection. Graphical Models and Image Processing, 1984, vol. 25, p. 46-67.
[Wang04] Z. Wang, A. Bovik, H. Sheikh and E. Simoncelli, Image quality assessment: From error visibility to structural similarity. IEEE Transactions on Image Processing, 2004, vol. 13(4), p. 600-612.
[Webe11] J. Weber, S. Lefevre and P. Gancarski, Interactive video segmentation based on quasi-flat zones. Image and Signal Processing and Analysis, 2011, p. 265-270. [Yani14] B. Yanikoglu, E. Aptoula and C. Tirkaz, Automatic
plant identification from photographs. Machine Vision and Applications, 2014, p. 1-15.
[Zimm02] C. Zimmer, E. Labruyere, V. Meas-Yedid, N. Guillen and J. Olivo-Marin, Segmentation and tracking of mi-grating cells in videomicroscopy with parametric active contours: a toll for cell-base drug testing. Medical Imaging, 2002, vol. 21(10), p. 1212-1221.
Manuel Grand-Brochier Manuel Grand-Brochier received the Ph.D. Degree in Electronic and Sys-tem, IT and Vision for Robotics from the Blaise Pascal University of Clermont-Ferrand, France, in 2011. These research topics were focused on image analysis, spatial and spatio-temporal description of points of interest, for image registration and medical imaging. He also did a Post-Doc at LIRIS from Lumiere Lyon 2 University of Lyon, France, on a thematic of comparative analysis of segmentation tools dedicated to the tree leaves extraction on natural background. Since September 2013, he joined the CaVITI research team based at ISIT laboratory from the Auvergne University of Clermont-Ferrand, France as an Assistant Professor.
Antoine Vacavant Antoine Vacavant obtained the Master’s degree from the Universit Lyon 1, France, in 2005, and the PhD degree in computer science from the Universit Lyon 2 in 2008. He is now asso-ciate professor at the Universit d’Auvergne Clermont 1. Head of the Licence Professionnelle Image et Son, he gives courses of image rendering, software engineering and object/event based programming in the IUT of Le Puy en Velay. Antoine Vacavant is also member of the ISIT lab, UMR 6284 UdA/CNRS / research team CaVITI (Cardio-Vascular Interven-tional Therapy and Imaging). His main research topics are discrete and computational geometry, image analysis, segmentation and computer vision, applied in medical imaging issues such as liver tumor detection and tracking.
Guillaume Cerutti Guillaume Cerutti was born in 1986. He obtained the Engineer degree from Tele-com ParisTech, Paris, France and the M.S. degree in Computer Science from the Royal Institute of Technology (KTH), Stockholm, Sweden, in 2009. He received his Ph.D. in Computer Science from the University of Lyon 2, in 2013. He now works as a post-doctoral research fellow at INRIA, Montpellier, France.
Camille Kurtz Camille Kurtz obtained the MSc and PhD from the University of Strasbourg, France, in 2009 and 2012. He was a post-doctoral fellow at Stanford University, (CA) USA, between 2012 and 2013. He is now an assistant professor at the University Paris Descartes, France. His scientific in-terests include image analysis, data mining, medical imaging and remote sensing.
Jonathan Weber Jonathan Weber obtained the Ph.D. Degree in Computer Science from the Uni-versity of Strasbourg, France, in 2011. He is now an associate professor at the University of Lorraine, France. He is member of the QGAR research team of LORIA Laboratory. His research works are focused on image/video processing using mathematical mor-phology tools. More precisely, he’s interested in segmentation, template-matching and pattern recog-nition problems applied to various type of data : image, video, satellite image, document image, ...
Laure Tougne Pr. L. Tougne was born in 1971. She received her Ph.D. in 1997 in Computer Science from the Ecole Normale Suprieure of Lyon, France. From 1997 to 2005, she was Associated Professor at the University of Lyon 2. Since 2005, she is Professor in Computer Science at the University of Lyon 2. Her research topics concern image and video analysis, discrete geometry and mobility.