Analysis of email and phone queuing systems in a world-wide
contact center network
By
Kristopher Carter
B.S., Mechanical Engineering, Georgia Institute of Technology (2005)
Submitted to the MIT Sloan School of Management and the Department of Aeronautics and
Astronautics in Partial Fulfillment of the Requirements for the Degrees of
Master of Business Administration
MASSACHUSTS INSETrEOF TEGHNOtOGY
AND
Master of Science in Aeronautics &
Astronautics
LIBRARIES
In conjunction with the Leaders for Manufacturing Program at t e
Massachusetts Institute of Technology
June 2008
© 2008 Massachusetts Institute of Technology. All rights reserved
Signature of Author
Department of Aeronautics & Astronautics &
Sloan School of Management
May 9, 2008
Certified by
U
DeboraNighti~4ale,
Thesis Supervisor
Professor of the Practice, Aeronautics & Astronautics apd Engineering Systems Division
Certified by
Stephen Graves, Thesis Supervisor
Abraham Siegel Rrofessorgof Maiagement, lM1T Sloan School of Management
Accepted by
=%
-
1
David L. Darmofal, )rfessor of Aeronautics & Astronautics
Associate Department Head
Chair, Committee on Graduate Students
Accepted by
Debbie Berechman
Executive Director of MBA Program, MIT Sloan School of Management
Analysis of email and phone queuing systems in a world-wide
contact center network
By Kristopher Carter
Submitted to the MIT Sloan School of Management and the
Department of Aeronautics & Astronautics on May 9, 2008 in Partial Fulfillment of the Requirements for the Degrees of Master of Business Administration and
Master of Science in Aeronautics & Astronautics
ABSTRACT
Contact centers are operated by companies to answer customer inquiries via phone calls or email. Customers often equate the service they are provided while interacting with a contact center to the quality of a company's product offering. Therefore, a major concern is what service level the company should choose to provide. One means of measuring service level is speed of response (how quickly a customer inquiry is answered). In general, faster response requires more customer service agents for a given volume of inquiries. Phone response times are usually measured in minutes or seconds. Email response times are usually measured in hours or days. This paper examines customer expectations regarding email and phone inquiry response time, and examines various models for planning staffing requirements to meet these response times.
The expectations for response time to phone calls are found to be stable, having not changed much in the last few decades. The expectations for response time to email inquiries have been increasing though, with customers demanding much faster response in the last few years. Many customers now expect response to their emails within hours rather than days, with a significant number now expecting response as quickly as one hour.
The challenges of implementing faster response times to email are examined using a case study at a major online retailer. A model is also introduced for email service level planning, that allows for the fact that typical response times are much longer than for phone calls. Thesis Supervisor: Deborah Nightingale
Title: Professor of the Practice, Aeronautics & Astronautics and Engineering Systems Division Thesis Supervisor: Stephen Graves
Acknowledgments
Albert Massa, Tom Weiland, and Tim Collins at Amazon.com provided guidance and support throughout the internship. They were welcoming and provided the resources necessary for this project to succeed.
My thesis advisors, Stephen Graves and Deborah Nightingale provided critical and useful feedback and ideas before and throughout the project and the thesis writing effort. I am very grateful for their help and expert guidance.
The Leaders for Manufacturing faculty, staff, and my student peers are a wealth of information and support. I have made lifelong friends here, and I will always treasure the experience.
Most of all I want to thank my wife, Jennifer, and my children for their love and support during this life-changing journey. I could not have done this without you.
Biographical Note
Kris Carter was born in Statesboro, Georgia. He attended Idaho State University and the Georgia Institute of Technology, where he graduated with a Bachelor of Science degree in Mechanical Engineering. He spent the early part of his career in service industries, at companies such as ADT Security Systems, Witness Systems, and Rollins Incorporated. He came to the Leaders for Manufacturing program from Arlington, Texas and Bell Helicopter-Textron, where he was an engineer.
Kris is a private pilot and has a passion for aviation and small airplanes. He is looking forward to moving with his family to his new hometown in suburban Chicago after completing LFM.
Table of Contents
Acknowledgments 5 Biographical Note 7 Table of Contents 9 Table of Figures 11 Table of Tables 13 Table of Equations 15 1. Introduction 171.1. Amazon.com Company Background 17
1.2. Project Context 17
1.3. Problem Statement 19
1.4. Approach 19
1.5. Chapter Outline 19
2. Determining "World Class" service levels 21
2.1. "World Class" phone service levels 22
2.2. "World Class" email service levels 25
2.2.1. Email automatic acknowledgement 27
3. Analysis 29
3.1. Erlang-C Model 29
3.2. Staffing Optimization Model 31
3.3. Phone 32
3.4. Email 33
3.5. Alternative Email modeling method 37
3.6. Key findings 39
4. Conclusions 41
4.1. Implementation Challenges 41
4.1.1. Stakeholder mapping 41
4.1.2. Three Lens Analysis 43
4.1.2.1. Background 43 4.1.2.2. Strategic Design 45 4.1.2.3. Cultural 46 4.1.2.4. Political 48 4.2. Recommendations 49 References 50
Table of Figures
Figure 1: Phone Service Level (Opus Solutions, 2006) 22
Figure 2: Utilization vs. Service Level (Phone) 24
Figure 3: DoubleClick Email survey (DoubleClick, 2004) 26
Figure 4: State Transition Diagram for M/M/m system (Larson & Odoni, 2007) 30
Figure 5: Sample staffing optimization results for an example day 32
Figure 6: Sample arrival patterns for email and phones 35
Figure 7: Sample day email and phone demand 35
Figure 8: Required Headcount for 1, 6, 12, and 24 hour service levels 38
Figure 9: Utilization vs. SL for 1, 6, 12, and 24 hour service levels 39
Table of Tables
Table 1: JupiterResearch/Ilpsos Insight Consumer Survey (11/06), n = 2,104 (US only) 25 Table 2: JupiterResearch/Ipsos Insight Consumer Survey (12/05), n = 2,228 (US only) 26
Table of Equations
Equation 1: (Larson & Odoni, 2007) 30
Equation 2: Sum of probabilities is 1 30
Equation 3: Assumed Control rule 38
1. Introduction
This thesis is one product of a six month internship done at Amazon.com, starting in February 2007 and ending in August 2007, as part of the requirements of the Leaders for Manufacturing Program at the Massachusetts Institute of Technology.
This chapter presents Amazon's background, the context in which the project takes place, a statement of the central problem that is examined, and explanation of the general approach that was used to examine this problem.
1.1.
Amazon.com Company Background
Amazon.com (Amazon) was founded in 1994 by Jeff Bezos, who is still the CEO and largest individual shareholder. Amazon.com started doing business in July 1995 by selling books on the internet. Amazon went public on May 15, 1997. For the year 2006, Amazon's revenue was $10.7 Billion. Amazon's product categories now include toys, consumer electronics, apparel, jewelry, grocery, tools, outdoor equipment, health and beauty, home and garden, and digital downloads in addition to books, music and other media products. Amazon now has a branded website in 7 countries, and delivers products all over the world.
1.2.
Project Context
Amazon.com, its affiliates and partners receive several million customer contacts each year. Customers initiate these contacts via phone or e-mail and one of Amazon's customer service agents (CSAs) respond to them. Their global contact center network employs several thousand CSAs and consists of many nodes, including both Amazon and co-source partner sites.
and several hundred thousand independent merchants making it the most complex e-commerce platform in the world.
The metrics that Amazon uses to manage this part of its business include service level (i.e. the percent of inquiries answered in a specified amount of time), first contact resolution (FCR), average handle time, average speed to answer, average hold time, and cost per contact. This thesis will primarily examine email and phone response time (service level).
It is accepted (Rust, Moorman, & Dickson, 2002) that improvements in customer service experience increase customer spend and shopping frequency. The directional part of that relationship is well established, but the magnitude of revenue increase associated with a given customer satisfaction improvement is not. Customer satisfaction itself can be difficult to quantify. Amazon's proxy metric for customer satisfaction with its contact centers is Expressed Dissatisfaction Rate (EDR). EDR is reported as the number of customers who respond to a post-contact survey indicating they were not satisfied with the contact divided by the total number of surveys sent. However, EDR is primarily a contact resolution metric, and only indirectly a customer satisfaction metric, because it asks only one question: "did we solve your problem or answer your question?". The question used to measure EDR does not ask the customer if they were satisfied with the interaction. Customer satisfaction is influenced by many factors; speed and accuracy are two of the more easily quantifiable factors. EDR primarily measures accuracy, which is probably more important to customers than speed. Service level is a measure of the percent of customer contacts that are answered within a
specified amount of time. Service level is speed related, and so improvements in service level may not impact EDR significantly. Service level is a significant factor in customer satisfaction though, and improvements will be viewed favorably by customers, as long as accuracy is not
sacrificed to get there. Service level is also directly related to the number of abandoned calls (callers that disconnect their call before it is answered) experienced, and to the maximum delay that customers endure.
1.3. Problem Statement
Amazon has set a goal to identify and achieve "world class" service levels for their email customer service contacts. This thesis will examine all subsets of Amazon's world-wide customer service operation that are served by phone and email (chat is excluded) to determine what is an appropriate "world class" service level, and how the company would make the necessary organizational and technical changes to achieve that level of service.
1.4. Approach
Available customer experience surveys focusing on contact center experience from a wide range of industries were examined to determine trends regarding customer expectations of
service level for phone and email contacts, with emphasis on email expectations. "World class" was arbitrarily determined by trying to match the expectations of approximately 90 percent (or greater) of the customers surveyed.
Once we determined "World Class" service levels, we then built models to analyze the impact a specific service level would have on Amazon's contact center network. Adjustments to both phone and email service levels were considered. For comparability reasons, agent performance and processes were held constant when examining new service levels.
1.5. Chapter Outline
Chapter 2 is an examination of how "World Class" service levels were determined for both phone and email.
Chapter 3 is an explanation of the analysis used to determine the estimated impact of "World Class" service levels on the Amazon contact center network. Two models used to estimate the impact of different email service levels are also introduced in Chapter 3.
2.
Determining "World Class" service levels
This chapter presents the relevant findings regarding "world class" service levels for the two primary channels that Amazon uses to provide customer service to its customers. These two channels are phone and email. Service level (SL) is defined as the percentage of contacts (phone calls or emails) that are answered in a specified amount of time. In the realm of phone call centers, this specified amount of time is usually measured in minutes or seconds. In the realm of emails, this specified amount of time is usually measure in days or hours. In both cases, it is assumed that all contacts (including those that are not answered within the targeted service time) are handled on a first-in first-out (FIFO) basis, as is standard industry practice.
For phone service level, we determined the "world class" standard to be 90 percent of calls answered in 60 seconds. For email service level, we determined the "world class" service level to be 100 percent of emails answered within 1 hour. The rationale for these choices is
2.1. "World
Class"
phone
service levels
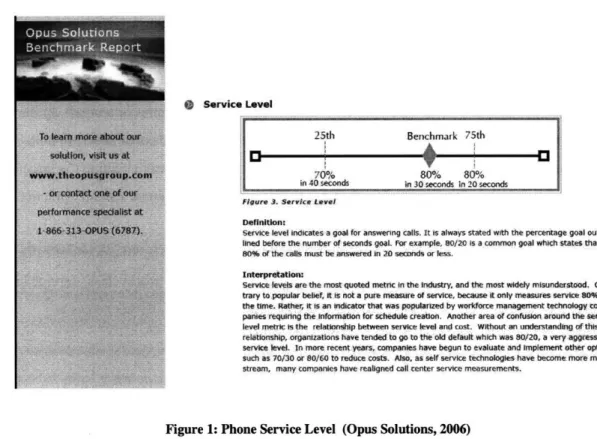
( Service Level
25th Benchmark 75th
70%n 80% 80%
in 40seconds n 30 seconds in 20 seconds
Fliure 3. Service Level
Definition:
Service level indicates a goal for answering calls, It is always stated with the percentage goal
out-lIned before the number of seconds goal. For example, 80/20 is a common goal which states that
80% of the cals must be answered in 20 seconds or less.
Interpretatlon:
Service leels are the most quoted metric in the industry, and the most widely misunderstood.
Con-trary to popular belief, it is not a pure measure of service, because it only measures service 80% of
the time. Rather, t is an indcator that was popularized by woridfrce management technology com-pan es requiring the enformation for schedule creation. Anoth area of confusion around the service
level metrics the relationship between service level and cost. without an unterstanding of this
relationship, organizations have tended to go to the old default which was 80/20, a very aggresslve
service level. in more recent years, companies have begun to evaluate and Implement other options such as 70/30 or 80160 to reduce costs. Also, as self service technologies have become more main-stream, many companies have realgned call center service measurements.
Figure 1: Phone Service Level (Opus Solutions, 2006)
Phone service level insights are based on research from Forrester Research (Forrester is an independent technology and market research company), Opus Solutions (Opus Solutions is a performance optimization company), and my own industry experience (since 1992). Opus Solutions conducted a benchmarking study (Opus Solutions, 2006), the results of which are shown in Figure 1, that concluded that 80 percent of calls answered within 30 seconds is the
current benchmark, while 80 percent of calls answered within 20 seconds is the 75h percentile
of company practices (i.e. in their survey, 75 percent of companies provide a service level in
which they answer less than 80 percent of calls in 20 seconds or answer 80 percent of calls in greater than 20 seconds). Forrester's research is the result of benchmarking studies across several hundred contact centers serving multiple industries. Forrester commented that "Most organizations target 80% of calls answered within 20 to 50 seconds." (Herrell, 2007). 22
Typical top service levels for phones are 80/20 (answer 80 percent of calls within 20 seconds); this standard has been stable for several decades, but may be showing some recent signs of
slipping slightly to something more along the lines of 80/30. Amazon prefers to state its phone service level metrics as the percent of calls answered within 60 seconds, and would therefore prefer a "world class" service level metric stated as %/60 rather than %/30 or %/20. This preference is completely arbitrary from a performance point of view, and companies often choose their preferred metric to closely align with other commonly used internal metrics in order to keep performance reporting and management simpler. It is difficult to translate these "World Class" service level standards to a fixed %/60 metric because the translation depends on the volume of calls answered in that specific call center. For example, at volume A, an
80/20 service level might be equivalent to 90/60, but at volume B, an 80/20 service level might be equivalent to 85/60. In Amazon's environment, for the scenarios considered in this study, the translation from 80/20 to %/60 worked out to be approximately equivalent to 90% in 60
seconds based on their expected 2007 volumes.
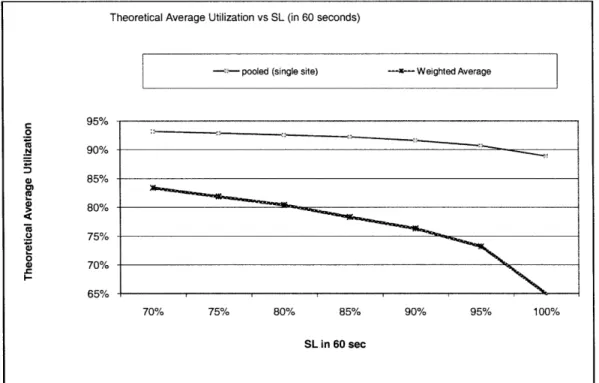
Another way to find an "ideal" service level may be to look for a point of diminishing returns when measuring service level versus agent utilization. Agent utilization is a good proxy for labor cost within a call center. The more highly a call center utilizes each of its agents, the fewer of them they will need to service a specified call volume, so as agent utilization goes down, labor costs will go up. The graph in Figure 2 shows theoretical utilization versus service level for two different scenarios (the pooled line is fictional, it is an idealized case of what could be achieved if Amazon ran as one big virtual call center; the weighted average line is representative of Amazon's environment today). On the x axis is the percent of calls answered within 60 seconds; on the y axis is the theoretical average utilization level for the agents. As we increase the percent of calls answered within the service target, the achievable utilization level drops, which results in higher labor costs. Figure 2 was generated by using Erlang-C
(explained in chapter 3) to model Amazon's call volume at various service levels. Lots of factors influence the utilization curve, including call volume and distribution, the average time required to handle each contact, and the service level time (service level time is x where SL is defined as %/x, e.g. 80/60) one is considering. In Amazon's current environment (the weighted 23
average curve), and considering a 60 second service level time, there is an inflection point
around 95%/60 (on the x axis), as can be seen visually in Figure 2. If one wants the most "bang
for the buck", it may make sense to position just below this point.
For the purposes of this thesis, we assumed, based on the evidence presented in the previous paragraphs, that 80 percent of calls answered in 20 seconds was considered "world class" phone service. In Amazon's current environment, an equivalent service level is 90 percent of
calls answered in 60 seconds.
Figure 2: Utilization vs. Service Level (Phone)
Theoretical Average Utilization vs SL (in 60 seconds)
-- pooled (single site) -- x Weighted Average
0 0 90% S 85% 80% .o 75% o S 70% 65%-65% 70% 75% 80% 85% 90% 95% 100% SL in 60 sec . . . .
-2.2. "World Class" email service levels
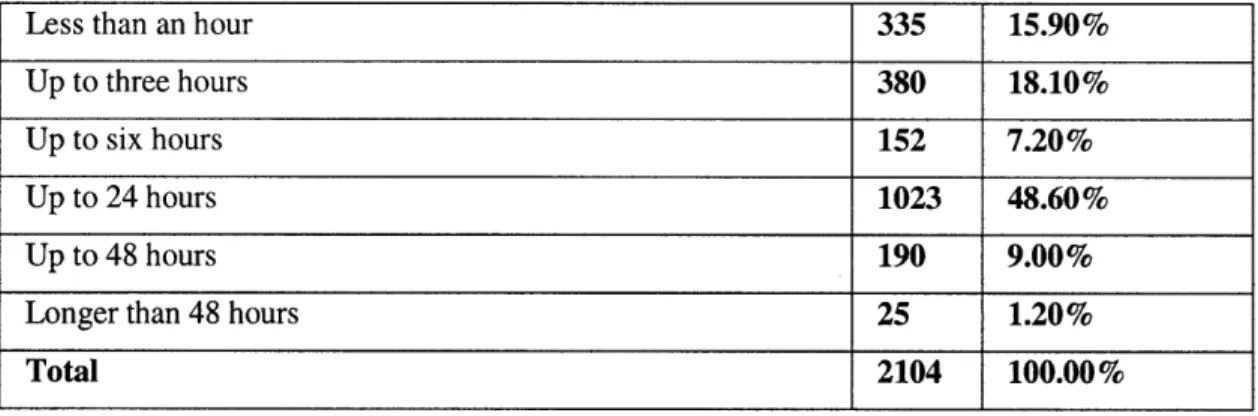
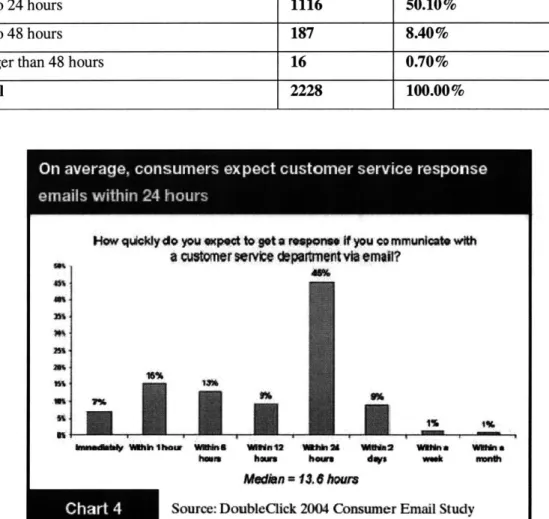
Email service levels have been evolving over the last several years as consumer expectations have been accelerating (McGeary, 2006). Studies from Jupiter Research (Gomez, 2007) and DoubleClick (DoubleClick, 2004) that examined consumer expectations regarding acceptable response time from emailed customer service inquiries suggests that by responding in 24 hours, one would be failing to meet the expectations of approximately 40% of customers. Table 1 shows a November 2006 study done by Jupiter Research (Jupiter is an independent technology and market research company). According to this survey, 41.2% of consumers would not be satisfied with a 24 hour response. These numbers closely match a similar survey they did in 2005, as shown in Table 2. DoubleClick also found similar consumer expectations in a 2004 consumer email study, as shown in Figure 3.
Table 1: JupiterResearch/Ipsos Insight Consumer Survey (11/06), n = 2,104 (US only)
Q: Regardless of whether you have contacted customer service in the past six months, how long do you think is acceptable to wait to receive a response to your e-mail inquiry from customer service? (Select one)
Less than an hour 335 15.90%
Up to three hours 380 18.10%
Up to six hours 152 7.20%
Up to 24 hours 1023 48.60%
Up to 48 hours 190 9.00%
Longer than 48 hours 25 1.20%
Table 2: JupiterResearch/Ipsos Insight Consumer Survey (12/05), n = 2,228 (US only)
Q: Regardless of whether you have contacted customer service in the past six months, how long do you think is acceptable to wait to receive a response to your e-mail inquiry from customer service? (Select one)
Less than an hour 310 13.90%
Up to three hours 402 18.00%
Up to six hours 199 8.90%
Up to 24 hours 1116 50.10%
Up to 48 hours 187 8.40%
Longer than 48 hours 16 0.70%
Total 2228 100.00%
On veag, onumes xpctcutoer eric rspns
How quloy do you We to t a IpQMWs iN you 4ommmunlcat with
a cusomer sevvkie soatment via emall?
El's~f
il
s 1IIom Vmnts AWtn 1 VaMMa 2 ale2 U a w
tmum htms hewur dwys wek I
Medin = 13.6 t her
Source: DoubleClick 2004 Consumer Email Study
au'es a
annes
Figure 3: DoubleClick Email survey (DoubleClick, 2004)
Chart 4
0
mmIeI I % seMN'According to these studies, if a company were to respond in 6 hours, they would still be failing to meet the expectations of approximately 22%-34% (varies by survey) of customers. This
same research suggests that 14%-22% of customers expect an email response in an hour or less. Experts at JD Power (Bennewitz, 2007) and Forrester (Herrell, 2007) also indicated that
"world-class" response time is somewhere around 2 hours. For the purposes of this thesis, we assumed that "world class" service should satisfy 90% or greater of consumers' expectations and we will therefore use one hour as the "world class" standard.
2.2.1.
Email automatic acknowledgement
Many companies send an automatic acknowledgement of every email inquiry sent to customer service. This gives the customer a receipt of their inquiry and presumably reduces customer uncertainty with this asynchronous communication channel. Jupiter Research found (McGeary, 2007) that only 39% of surveyed sites that offered email as a channel acknowledged receipt of those inquires by replying to senders with automated responses. Automatic acknowledgments are a low cost (relative to using actual contact center personnel) to give customers some feedback regarding their inquiry. Many companies use the automatic acknowledgement message to communicate self-service paths for their customers and to set expectations regarding email response times.
3. Analysis
This chapter presents the models used to analyze Amazon's world-wide contact center network. I first introduce a model commonly used to analyze queuing systems such as contact centers. I then discuss the staffing optimization model used to turn the queuing model's outputs into "real world" staffing requirements. I also present an alternative email modeling technique that we used to examine other possible service level scenarios (other than 1 hour). Finally, I discuss how these models were used to predict the impact of new service levels to Amazon's contact center network.
3.1.
Erlang-C Model
Contact centers have long used an Erlang C queuing model for modeling the staffing requirements for incoming phone calls (Brown, et al., 2002). In its most simple form, a call center is usually modeled as a first in first out (FIFO), single queue system with multiple identical servers (agents) and unlimited sources (customers) that arrive in a Poisson manner and that have exponentially distributed service times. The Erlang model makes certain assumptions that do not perfectly mirror reality, but allow a reasonable approximation to it. The model assumes "steady state" conditions, which certainly is not true, but is a reasonable approximation over a half hour interval. The model also assumes zero abandoned calls, which is not always a good assumption; this will usually result in a forecast that is slightly more conservative than reality, but in most cases the difference is small.
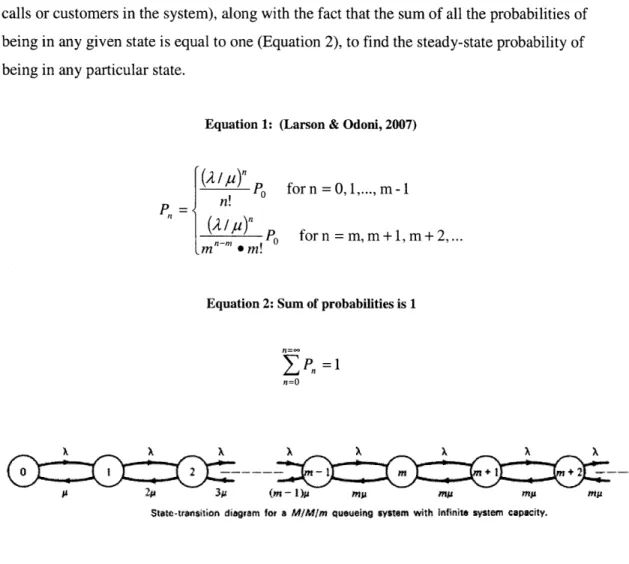
In queuing system terminology, this system is referred to as an M/M/m system, where the first M refers to the arrival type (M stands for Markovian, or negative exponential interarrival times), the second M refers to the service type (negative exponential service times), and the final m refers to the number of servers (agents). The probability density function (pdf) for the call interarrival times is negative exponential with mean I/X, where X is the arrival rate. The probability density function (pdf) for call service times (handle time) is also negative exponential with mean 1/p (where p is the service rate). The state transition diagram for this 29
type of system is shown in Figure 4. We can use Equation 1 (where n is the total number of calls or customers in the system), along with the fact that the sum of all the probabilities of being in any given state is equal to one (Equation 2), to find the steady-state probability of being in any particular state.
Equation 1: (Larson & Odoni, 2007)
for n = 0,1,..., m - 1 for n = m, m +1, m + 2,...
Equation 2: Sum of probabilities is 1
n=oo
-Pn =1
n=O
20 3 (m-l t M M M m1
Stiate-Lansition diagram for a M/Mirn queueing System with Infinite system capacity.
Figure 4: State Transition Diagram for M/M/m system (Larson & Odoni, 2007)
There is an Erlang-C add-in for excel available at http://www.erlang.co.uk/excel.htm. This add-in can be used to compute the number of servers (agents) needed for a given call arrival rate and service rate to achieve a desired mean service time (e.g. 60 seconds) at a service level that is specified in the form of a percent (e.g. 90%). Note: I am using "service time" to describe the amount of time a customer has to wait after entering the queue but before being served. If you break up a day's call volume into small enough segments (e.g. 30 minutes), you can approximate steady state arrival rates and use this Erlang-C add-in to determine the number of agents needed to staff each of these segments (e.g. each half hour of the day) to achieve a
specified service level (e.g. 90% in 60 seconds). This can also be done at the weekly level, breaking the week's call volume into small segments (e.g. 30 minutes). This can become the basis for a recurring weekly staffing plan if the volume were steady from week to week. If volume is not steady from week to week, then a forecast is needed, but the principle of breaking up the weekly volume into small segments and using the Erlang-C add-in to predict staffing remains equally applicable.
3.2. Staffing Optimization Model
Once one has determined the required headcount for each half hour interval throughout a week, a staffing plan can be put together to meet these minimums yet still comply with staffing constraints. Typical staffing constraints might include a 40 hour work week (no part time shifts) for each agent, 8 hour or 10 hour per day, consecutive days off, fixed starting times (e.g. 7am and 3pm), 1 hour lunch breaks, periodic 15 minute breaks, etc.. These constraints can make a significant difference in how closely one is able to match the required headcount curve. The solution to this problem can be determined by solving an optimization problem (Aksin, Armony, & Mehrotra, 2007). At Amazon, the staffing plan is determined by a staffing optimization model. The model determines the minimum number of scheduled employees to meet the headcount required for each interval (or some % of the required headcount, if specified), given certain staffing constraints.
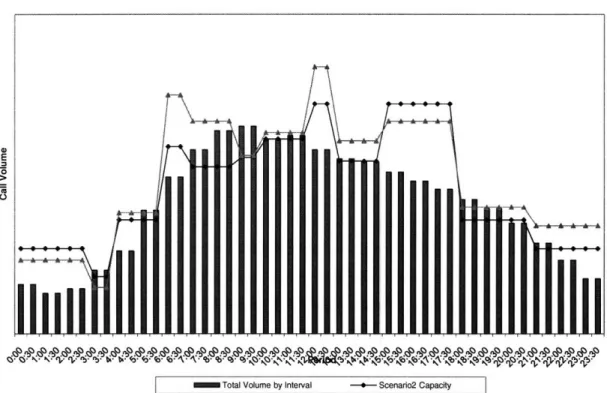
Figure 5 shows a sample result of attempting to staff to a required headcount for one example day of the week. The red bars are the total call volume expected during that 30 minute interval. The lines labeled scenario 1 and scenario 2 are the approximate call capacity provided by two different staffing plans which differ based on what constraints were imposed. If more relaxed constraints were used (e.g. part time shifts), the staffing plan could much more closely mirror the required headcount curve (the tops of the bars). In both cases, the optimization routine was allowed to staff somewhat below the minimum for each specific interval. This would sacrifice service level performance for that specific interval, but might still provide sufficient
half-hour interval, but managed for a weekly or daily metric, so these tradeoffs are routinely made.
0
E 0o0
U
I Total Volume by Interval - Scenario2 Capacity
Figure 5: Sample staffing optimization results for an example day
3.3. Phone
We can use the Erlang-C model to analyze different phone service levels, as this is the primary method used to analyze current service levels. Once a "world class" service level was
determined, the new service level could just be applied to the existing staffing models. The Erlang model used required a demand pattern for calls for each half-hour interval for each day of the week. This demand pattern was already available for phone calls at Amazon for each of their business segments and in each of their operating countries. A forecast of volume by week was also necessary, but already existed.
To move from their existing service level standard of 80 percent of calls answered within 60 seconds (80/60) to a new 90/60 standard required them to staff more people for each shift. It did not require them to change the way that they scheduled employees nor how they managed their queuing or forecasting systems. It was simply a matter of using the Erlang-C model to determine which intervals throughout the week would require additional staff in order for them to meet a 90/60 standard. The quality (how closely it matched the required headcount curve produced by the Erlang-C model) of the solution provided by the staffing model did not significantly change in this case. For example if the Erlang-C model called for 10% additional headcount to change from a 80/60 to a 90/60 service level, then the staffing optimization model also called for -10% additional. One main caveat is that this only holds true when you are considering moderate changes in medium sized, or larger, groups of agents. There are not specific definitions of what constitutes a moderate change or a medium sized group, but queuing systems and optimization models produce more consistent results as the size of the problem increases. If you are trying to staff for a very small group (e.g. less than ten
simultaneously staffed agents), then a slight increase or decrease in service level might cause a relatively large change in required headcount because people can only be added in integer increments (you can't add 0.5 of a person for a small time interval), thereby causing at least a
10% staffing change. This same phenomenon occurs with the staffing optimization model as it is forced to make large output changes (number of staffed shifts) to cover small input changes (required headcount). In each case, these problems become less pronounced as the size of the problem (number of people needed) gets larger. For example, if you are staffing 100
simultaneous agents, and you change, you can make changes of 1% (by adding or subtracting 1 person).
3.4. Email
Prior to my arrival, Erlang-C had not been used to plan staffing levels for email traffic at Amazon. Amazon had previously operated to a 80% in 24 hour service level standard for email. The existing planning model therefore only required estimates of daily traffic, and staffing was similarly planned at the daily level. They intentionally held a backlog of emails
and attempted to manage that backlog so that it equaled approximately the next day's projected email volume. It did not matter when during the day the email volume came in, nor did it matter when during the day they responded to the email, as long as the number of new emails equaled the number of email answered. This planning method is sufficient if one holds to a 24 hour service level. If any more aggressive service level is to be planned for, a staffing plan at a daily level is not sufficient because it lacks granularity at anything less than 24 hour
increments. Research on "world class" service levels suggested that a service level as
aggressive as one hour might be recommended; therefore a more precise demand pattern was required.
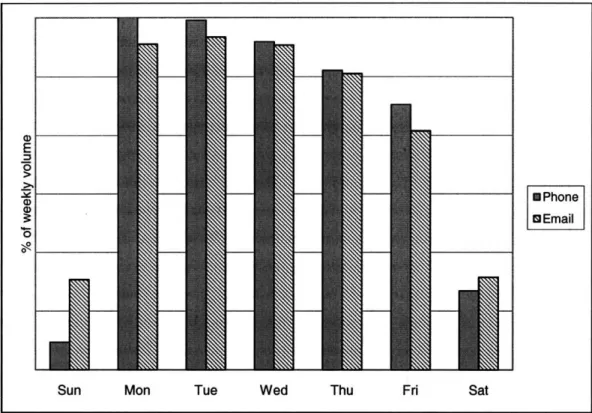
Since email traffic had not previously required it, there were no demand patterns with which to plan sub-daily staffing profiles. Historical data was available however, so demand patterns (to the half-hour interval) for each of Amazon's business segments and in each of their operating countries could be constructed. Once we constructed the demand patterns, the planning process was similar to the one used for phones. Figure 6 shows how email volume arrives similarly to phone volume, but is slightly smoother over the week. Figure 7 shows a sample day's arrival pattern for email and phone, again the pattern is similar but smoother (less variable).
Figure 6: Sample arrival patterns for email and phones
Figure 7: Sample day email and phone demand
U Phone *Email
Sun Mon Tue Wed
-
Phone --- Email
0:00 3:00 6:00 9:00 12:00 15:00 18:00 21:00 0:00
Time of day
One major difference between evaluating phone and email service levels using Erlang-C is that the service level timeframe is significantly different. A typical phone service level might be
95% of phone calls answered in 60 seconds. A typical email service level might be 80%-100% answered within 1-24 hours. From an Erlang-C point of view, a one hour, or even ten minute, service level is a very easy target. This means that you will get the same answer, as far as the number of employees required to service a given call volume, whether you set the service time to ten minutes, 1 hour, or 9 hours. The basic reason for this is that the Erlang-C model assumes that you will finish all volume (no callers abandon the queue) during the specified time interval you are considering. In order to approximate steady state conditions, we use half-hour intervals. If you are considering service level times in excess of a half-hour, the answer is the same because the model assumes that all calls will be completed in less than the time interval (i.e. half-hour). This model therefore does not work well to explain how work is currently being done with regards to email. If you attempt to analyze a moderately long service level (anything greater than 9 hours) using the excel Erlang-C add-in, the model will fail to give an answer due to a software limitation.
Despite the inadequacy described above of using an Erlang-C model for service times that exceed the service interval, it can be still useful to model the email volume using the Erlang-C method. It still shows how volume arrives throughout the day, and how you would need to staff to that volume in order to assure fast response. This modeling method is however much more applicable to a one hour service level than something longer than that. When the required service time greatly exceeds the service interval, the assumption of no abandons starts to make less sense. An email cannot abandon the queue in the traditional sense where the service request would leave the system (e.g. a caller hanging up because they get tired of waiting), but an email can in essence abandon the time interval being considered and is then dealt with at a later time (e.g. in the next interval). For example, if I have 10 emails that arrive between 12:00
and 12:30, and I give myself a service level target of 5 hours, I could respond to 1 email each
half hour and still meet my service level target. From the Erlang-C model's point of view, if I receive 10 emails between 12:00 and 12:30, it assumes that I will handle all 10 before exiting the time period we are considering (because it assumes no abandons, therefore all 10 requests must be served). So, if I dealt with 1 email in the first half-hour, 9 would then "abandon" that 36
time period. This problem is minor when considering a 1 hour service level over the course of a 24 hour day, but gets more significant as we begin to consider longer service levels, and it certainly does not work for a 24 hour service level.
3.5. Alternative Email modeling method
When modeling a one hour email service level, the Erlang-C method is sufficient, but not great. When modeling a longer service level, something else is needed to allow for the fact that not all of a given interval's email demand has to be satisfied in that interval. We desire a model that could compare service levels of one, six, twelve, and twenty-four hours; this could not be
accomplished with the Erlang-C model being used.
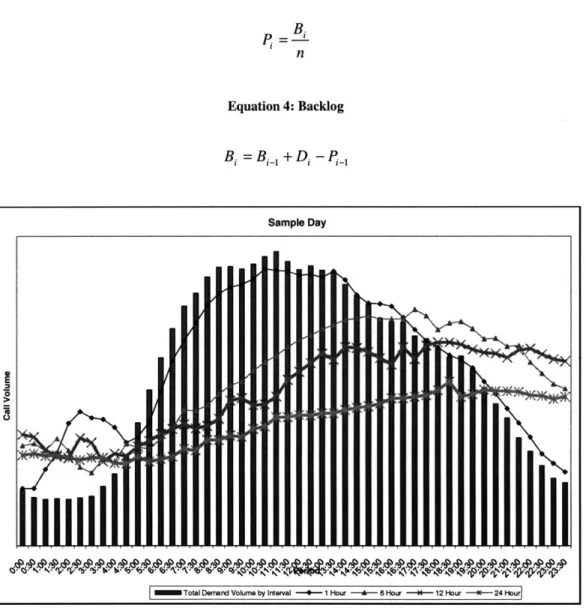
A model was developed that determines the amount of production required for a given interval by dividing the raw demand of that interval, plus any unfulfilled requests from the previous interval, by the total number of intervals in the service time requirement. Equation 3 shows the
assumed control rule, where Pi is the required production for the interval, n is the number of intervals in the service window and Bi is the backlog at the beginning of the interval. Bi is further defined by Equation 4, where Di is the expected demand for the interval being
considered. For example, if one desires to find the required production for each interval when using a six hour service level, you would divide the adjusted demand of that interval (which includes the actual demand of that interval plus any unfulfilled demand from the previous interval) by twelve since there are twelve half-hour intervals in six hours. This process of calculating demand is circular for the week, and therefore must be seeded at some point. I chose to seed the demand calculation at the first interval for a week (Sunday morning at midnight) by adding the forecast demand for that interval to an estimate of the backlog coming from the previous interval (Saturday night at 11:30 pm). This model still starts with the forecast demand used in the Erlang-C model, still gives required headcount for each interval
(just calculated using a different method), and still needs to be run through the staffing optimization model to get a weekly staffing plan. The longer the service level allowed, the
of the 1-hour staffing curve in Figure 8 is an example of how staffing constraints (such as the timing of lunch breaks) and the need to find a globally optimum solution (for a weekly shift), can cause a failure to closely follow the demand curve.
Equation 3: Assumed Control rule
Pi Bi
n
Equation 4: Backlog
I Total Demand Volume by Interval --- 1 Hour -- - 6 Hour -- 12 Hour - -- 24 HourJ
Figure 8: Required Headcount for 1, 6, 12, and 24 hour service levels
Sample Day B, = B,_ + D, -
P_-6~Pd~P~P~·rs~P,~s~rP~;rP,~9,cfZj~9,~s~,~~;I~S~;?S~g~;?P,~S,61P,~J~f~f~·;~S~~·d!?5! ~Pg,3~IP~;n~p~9,i"
~bi:y ~ h; r~
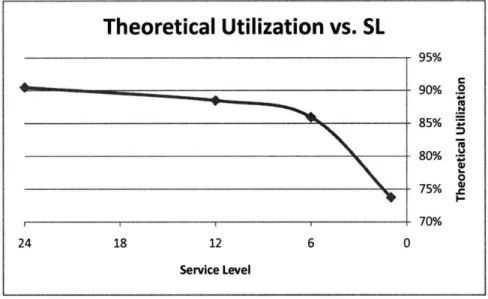
After running Amazon's network through this alternative model at various service levels and finding solutions for the total number of staff required to meet each service level, an average theoretical agent utilization can be calculated. Figure 9 shows some example results which map theoretical utilization against service level. Similar to Figure 2, one might use this type of graph to get a quick estimate of where a point of inflection is, and therefore what service level might give the most "bang for buck". In this case, it seems that somewhere around six hours might be a sweet spot. Figure 9 also shows that a move from a 24 hour service level to a 12 hour service level only drops utilization by a few percentage points, even though the service level improved by a factor of two.
Theoretical Utilization vs. SL
9CO/ 90% .0 N 85% ° 80% -75% .-70% 12 24 Service LevelFigure 9: Utilization vs. SL for 1, 6, 12, and 24 hour service levels
3.6. Key findings
The key findings of the analysis done in chapter 3 are shown graphically in Figure 2 for phones and in Figure 9 for email. Both of these figures show a nonlinear tradeoff between service level and utilization (a proxy for cost). Providing customers with short wait times (high service levels) becomes increasingly more expensive. This analysis also demonstrates, as shown in Figure 9, that a large change in wait time can be made for a relatively small change in cost if
39
you are currently on the left side of the graph (e.g. moving from a 24 hour service level to a 12 hour service level).
4. Conclusions
4.1.
Implementation Challenges
This subchapter examines this organizational change initiative using tools such as stakeholder mapping and a "three lens analysis". The goal is to better understand impediments to
implementation.
4.1.1.
Stakeholder mapping
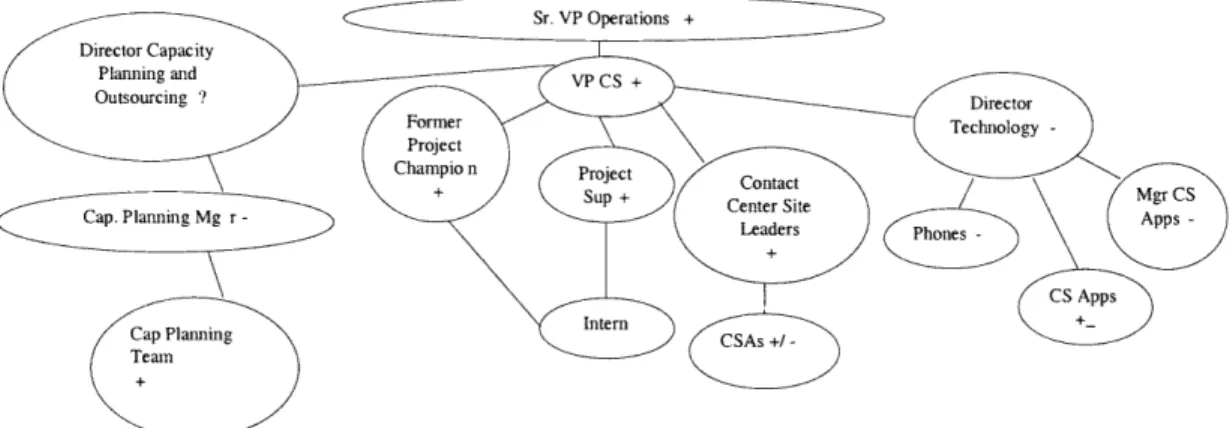
Approximately halfway through the internship, I used a framework called a stakeholder analysis to evaluate the change initiative, and how it was perceived by key stakeholders within the organization. This analysis represents a snapshot in time; many circumstances may have changed after this was undertaken. Figure 10 is a graphical way of showing links between stakeholders and whether or not they are supporting the project or hindering it. In Figure 10 '+' indicates support, '-' indicates resistance, and '?' indicates an unknown state, it's for a large group to have supportive factions as well as resistant factions (e.g. CSAs). Table 3 shows similar information, but in a tabular format. Table 3 also shows the current state and desired state of each stakeholder to facilitate project success.
Table 3: Stakeholder Analysis
Stakeholders Perceptions No Let It Help It Make It Commitment Happen Happen Happen
SVP Operations New to company, wants to drive lean culture X O
VP WWCS and Engaged, but overextended. X O
Project Champion
Project Supervisor Helpful and engaged. X O
Former Project No longer very involved. Has offered to have monthly meetings. X, O Champion
Director CS Very protective of technical resources. If project requires technical
Technology resources, he will probably instinctively resist. Project WILL X O require technical resources.
Mgr CS Apps Unknown O
Mgr CS Telephony Wants to help, but resource constrained. Will resist requests for X O additional features in new Telephony apps.
CS Apps Helpful. Good source of information. Seemingly unencumbered by X O politics and resource haggling.
Director Global Unknown quantity. X O
Outsourcing
Mgr WW Capacity Seems resistant to ideas that will complicate his models. X O Planning
Capacity Planning Helpful. X O
Engineer
Site Leaders Supportive, but pulled thin. Will need them to be active. X O
CSAs Wary of change. X 0
X=Current State O=Desired State
4.1.2. Three Lens Analysis
Approximately halfway through the internship, I authored a paper that analyzed the project using a framework introduced at the Sloan School of Management called a "three lens"
analysis. A "three lens" analysis tries to look at a change initiative within an organization using a strategic design lens, a cultural lens, and a political lens. The important findings from my three lens analysis are included below. This analysis represents a snapshot in time; some
circumstances changed after this was written and this part of the analysis does not try to capture those changes.
4.1.2.1. Background
Amazon's worldwide customer service group handles millions of contacts per year from their customers. These contacts are handled in a multi-node network that includes internally-run sites, as well co-sourcers around the world. Approximately 50% of volume is handled by
co-sourcers. Contacts are approximately 50% email, and 50% phone calls for the network, though this balance varies considerably by site.
One of Amazon's stated goals for the year was to figure out what world-class service levels are, and then be in a position to achieve those service levels by year-end. When they refer to world-class service levels, they are referring to their speed of answer for any given contact. This became my project; define world-class service levels, analyze what will be required for the company to get there, and help them begin implementation. Much of the implementation will occur after I leave.
Defining world-class service levels was relatively easy, it took approximately a month of research. I found that Amazon's current standard for phone answer speed, 80% of calls answered within 60 seconds, should be enhanced to 90% of calls answered within 60 seconds. This change required them to staff a few more people at certain times of the day, but didn't require them to change the way they think about phone service levels in any appreciable way; few people were surprised at this recommendation. For email service levels, I found that their current standard of answering 80% of inbound emails within 24 hours would need to be improved to 90% answered within 1 hour. This proposed change seemed shocking and extremely difficult for many. They would now have to staff email according to the arrival pattern, which they had not previously had to do. This proposed change seemed huge.
It took a considerable education initiative to convince people that they already knew how to staff to an arrival pattern, every phone contact center in the world had been doing it for decades, and that email wouldn't be appreciably different. But, before I could convince the various stakeholders that this was in fact an achievable goal, I had to set about building an email arrival pattern from their archival data and creating staffing models given their shift constraints. This detailed modeling took quite a bit of time. I have presented these analyses and
recommendations to the VP of Worldwide customer service and his staff. I have also presented the recommendations to the Sr. VP of Operations. So far, once I get through presenting the details of why this answer makes sense, what it will cost, how it can be done, etc... resistance subsides. Although I have been leading the research and analysis phases of the project so far, I 44
have suggested it would be in their best interest to assign a project leader responsible for implementation after I leave. I would act as an advisor to that project team as they complete their analysis and begin implementation.
4.1.2.2. Strategic Design
Amazon's customer service organization has a goal, which has been elevated to the senior leadership team, to be performing at "world-class" service levels (from a speed perspective) by year end. They decided that it was important to enhance their reputation for customer service, and this is one of several initiatives aimed at improving their standards. This makes it much easier, in some ways, to convince them that this project is on the right course. Still, the project increases costs, at least in the short term. Increases in costs are never an easy sell. With this type of project, it is difficult to tie it directly to a forecasted increase in top-line growth. Fortunately, since they had already convinced themselves that higher service levels were needed, despite some cost increases, I haven't had to try to tie it to top-line growth. It also helps that the cost increases that I'm forecasting are modest.
Another aid to this change initiative is that Amazon claims to be the world's most customer centric company, and has tried to do what was right for the customer. Jeff Bezos (Founder and CEO) has used this rationale to justify many projects and decisions over the years that didn't seem to make sense at first. An example is when Jeff decided that Amazon should allow third parties to sell their products on Amazon's website, often times directly competing with Amazon's own product listings. Jeff felt that it made more sense for the customer to have all options presented, and that by doing so, Amazon would win trust and long-time customers. That decision, and many more like it, have worked and allowed Amazon to continue double digit growth every year.
Amazon designed its contact center network to diversify risk of outages, to keep costs down, to help meet demand spikes, and to control quality. This design has led to certain tradeoffs, most of which end up requiring more people to provide a given service level. For instance, if they 45
answered all of their Amazon.com (US traffic) calls in one place, they could do it with less people than they do currently. But instead, they answer those calls at multiple internal and
co-sourced sites. This provides some redundancy if they have problems at one node, reduces cost by off-shoring some of the work, helps them ramp-up for the holiday peaks, and allows them to
control quality by having the internal sites (which can be monitored more closely) set the standard. These tradeoffs generally make it harder to implement large change initiatives because you are dealing with multiple groups around the world that each have their own fears, staffing constraints, etc... Fortunately, there is a strong coordinating presence based out of Seattle.
As part of the implementation phase, I have proposed making some changes to how they currently split up the work. I have not suggested eliminating any sites, but I have proposed changing the work-mix in some cases. For instance, they currently handle work for their Endless.com business unit (a shoe and accessories business) in all three domestic sites. I have suggested that they restrict that to only two sites. They will still get redundancy, 24 hour coverage, and enough capacity with two sites. But, by removing one site from the mix, they reduce the total number of agents required to staff for a given number of contacts. I have also recommended that they leverage their network more for certain types of work. For instance, they currently do not have 24 hour coverage for certain (escalated contacts) emails in the UK. Since I'm suggesting that they answer emails within 1 hour of receipt, they would now need 24 hour coverage. I suggested that they allow one of their other sites that does have coverage during that time to handle the contacts. Little training would be required, as that particular site already handles this type of contact for US customers.
4.1.2.3.
Cultural
Amazon claims to be data driven, they also claim to be the world's most customer-centric company. These two things come into ionflict somewhat in regards to this project. There is pretty good data to support that the proposed service levels are "world-class", but less data available to support a business decision to meet these new levels. It would be nice if we could 46
show that higher service levels will definitely lead to top line growth and that an improvement of x in service level will lead to y growth, unfortunately this relationship is vague. It comes down to Amazon's willingness to make a decision they believe is right for the customer, and hope that customers will reward them for it. They have shown a willingness to do this in the past, and it appears they are willing to do it again this time. Amazon's customer-centric culture has shown through in several meetings. Once it became clear that this was the direction in which we were moving, some of the attendees got excited that we would be setting a new
standard for customer service and causing other players in the industry to chase us.
Amazon's history with contact centers is very different than the reality in most contact centers, including to some degree Amazon's current experience. When Amazon first started in the 90s, the contact centers were staffed with highly educated people (college degrees, some advanced degrees), and they were given great responsibility and authority. They also had their own permanent desks, were salaried, and had reasonable shifts with consecutive days off. The current VP of customer service started as a call center agent with Amazon, and worked his way up. Most contact centers in the industry are staffed with less educated people (college degrees are rare), who have little responsibility or authority. Agents usually have to share their desk
across shifts, or just sit at any empty desk upon arrival for their shift; they often have to start on a midnight shift, and only work up to day shift after they have gained seniority; they also tend to work in any group that needs them and for which they are trained. Today, Amazon's contact
centers more resemble industry norms, but they still have permanently assigned seats and group supervisors, and fairly benign (consecutive days off, at least one weekend day off, etc...) shifts. These cultural artifacts translate to shift constraints that make it more difficult to staff a 24/7 center, especially for groups with low volume. I did not overtly propose changing any of these remaining cultural artifacts; I just modeled with those constraints. I think that these
service level changes (if adopted) will accelerate the change towards industry norms though, because they will run into seating capacity constraints sooner than they would otherwise.
Amazon prides itself on having a very high hiring bar, and so it appears that the default assumption is that if you are in the room then your opinion is worth consideration. I have been introduced to the team as being an intern from the Leaders for Manufacturing program at MIT 47
(many know people that came through this program, and those people are generally respected at Amazon), and that I am helping Amazon figure out how to meet its goal of performing at "world-class" service levels. In most cases, the people I have encountered have shown respect for my opinions, research, and analysis. That doesn't mean everyone has lined up behind this initiative, but I've been surprised at the level of respect I've received at Amazon. Many cultures dismiss interns as only marginally relevant; Amazon hasn't seemed to do that in my case.
While on this internship, I attend weekly meetings of the world-wide customer service team, where site leaders meet (virtually) with the VP and his Seattle team. In these meetings, it has been made clear that we are still pursuing our goal of reaching "world-class" service levels by year-end; there have also been previews of what those levels are likely to be, but no official word yet that these are the actual new standard. I have asked that the new service levels be put on their weekly metric deck so that we can start to measure ourselves against it, and also to help communicate the new goals.
4.1.2.4. Political
There is a new sheriff in town in Amazon's operations organization. The previous operations head, who had lead operations for approximately seven years, moved over to lead part of their retail organization. The new Sr. VP of Operations comes from Solectron, and GE prior to that. Customer Service reports to Operations, and is still getting used to the stylistic differences between the two leaders. This project has received strong support from the new head of
Operations. Amazon likes to think of itself as a data-driven culture that is egalitarian, but it still is influenced by hierarchy, especially when the person at the top is new and somewhat
unknown. For now, this is working as an aid to this project.
There has been some resistance to this proposal so far, most significantly from the capacity planning and global outsourcing groups. The capacity planning group is responsible for planning the number and timing of associates needed at each internal site. The global 48
outsourcing group is responsible for managing the relationship with the co-sourcers. These groups would be required to rework several existing plans and relationships in the next few months. This resistance has largely seemed to evaporate lately as they now appear to have
moved into an acceptance phase as the ambiguity surrounding the project has waned.
For the most part, the site leaders haven't expressed strong opinions yet. They will ultimately be the ones responsible for executing to the new standard, but they seem willing to go with the
flow once the new standard is rolled out. The reality is that it doesn't change their management challenges significantly to have to manage to a higher standard, provided they can staff to it. The two major exceptions to this generalization are the site leader in Hyderabad India, and the
site leader in Japan. The Japanese site leader's concern is that his site is currently not 24/7, and
he doesn't have co-sourcer backup. The Hyderabad site leader's concern is that he is an email only shop, and as such has not had to staff to an arrival pattern at all. He currently can have two equally sized shifts, or a larger day shift and a smaller night shift. This new plan will require him to have a larger night shift, and a smaller day shift. Both of these concerns are justified, and are some of the real operations challenges that will be faced during
implementation.
4.2.
Recommendations
To achieve "world class" service levels with no regard for the costs required to attain those levels, the recommendation would be to answer 80% of phone calls within twenty seconds, and to answer all email within one hour. Due to cost considerations and organizational willingness to change, the organization may wish to consider setting those service levels as future goals,
with more modest immediate goals. In this light, the most pressing issue is email response speed because the current phone service level is not that far off the mark, but email service level has a long way to go. A six hour, or even a twelve hour email service level would offer a significant step forward with regard to email responsiveness at a more modest price.
References
Bennewitz, M. (2007, March 19). JD Power weighs in. (K. Carter, Interviewer)
Brown, L., Gans, N., Mandelbaum, A., Sakov, A., Shen, H., Zeltyn, S., et al. (2002). Statistical
Analysis of a Telephone Call Center: A Queueing-Science Perspective. The Wharton Financial
Institutions Center.
DoubleClick. (2004). Fifth Annual Consumer Email Study. DoubleClick.
Feinberg, R. A., Kim, I.-S., Hokama, L., Ruyter, K. d., & Keen, C. (2000). Operational determinants of caller satisfaction in the call center. International Journal of Service Industry
Management, 11 (2), 131-141.
Gans, N., Mandelbaum, A., & Koole, G. (2003). Telephone Call Centers: Tutorial, Review, and Research Projects. Manufacturing & service operations management, 5 (2), 79-141.
Gomez, R. (2007, March 19). Amazon Inquiry/: Feedback regarding completed Inquiry -
1-BGU1XZ on Customer Service SLAs/ Marie Bennewitz. (M. Bennewitz, Interviewer)
Herrell, E. (2007, March 12). Response to your Forester Inquiry (1-BGUlXZ). (A. Nakamoto, Interviewer)
Larson, R. C., & Odoni, A. R. (2007). Urban Operations Research. Belmont: Dynamic Ideas. Aksin, Z., Armony, M., & Mehrotra, V. (2007). The Modem Call Center: A Multi-Disciplinary Perspective on Operations Management Research. Production and Operations Management,
16 (6), 665-688.
Marr, B., & Neely, A. (2004). Managing and Measuring for Value: The Case of Call Centre
Performance. Cranfield School of Management and Fujitsu.
McGeary, Z. (2006). The State of Customer Service, 2006; Trends in Consumers' Attitudes and
Behavior. Jupiter Research.
McGeary, Z. (2007). US Customer Service & Support Metrics, December 2006. Jupiter Research.
Opus Solutions. (2006). Benchmark Report: Contact Center. Opus Solutions.
Rust, R. T., Moorman, C., & Dickson, P. R. (2002). Getting Return on Quality: Revenue Expansion, Cost Reduction, or Both? Journal of Marketing , 7-24.
Appendices
From: Bennewitz, Marie
Sent: Monday, March 19, 2007 1:26 PM
To: Carter, Kris
Subject: JD Power weighs in
I spoke to two people at JDP today - they don't have hard, diagnostic data of the type we are looking for but both
analysts I spoke to had some knowledge and opinions that I thought I'd pass on.
Companies are "all over the map" and even the ones who are good hesitate to make promises that are too aggressive. They seem to feel that top performers in email response do so within two hours, but that only 5 - 10% of companies make that. In fact, they feel that not even 50% of companies make a 24-hour response.
Anyway, I think I have turned over all the stones and the info from Jupiter is the best there is. BTW one of the JD Power guys put me on to this site:
http://www.apqc.org/portal/apqc/site;jsessionid=45MMHK10MOCMBQFIAJIC FEQ
In case that is interesting or helpful.
Marie Bennewitz