HAL Id: hal-00330840
https://hal.archives-ouvertes.fr/hal-00330840
Submitted on 1 Jan 2002HAL is a multi-disciplinary open access archive for the deposit and dissemination of sci-entific research documents, whether they are pub-lished or not. The documents may come from teaching and research institutions in France or abroad, or from public or private research centers.
L’archive ouverte pluridisciplinaire HAL, est destinée au dépôt et à la diffusion de documents scientifiques de niveau recherche, publiés ou non, émanant des établissements d’enseignement et de recherche français ou étrangers, des laboratoires publics ou privés.
Distributed under a Creative Commons Attribution| 4.0 International License
Effect on nitrate concentration in stream water of
agricultural practices in small catchments in Brittany:
II. Temporal variations and mixing processes
L. Ruiz, S. Abiven, C. Martin, P. Durand, Véronique Beaujouan, Jérôme
Molenat
To cite this version:
L. Ruiz, S. Abiven, C. Martin, P. Durand, Véronique Beaujouan, et al.. Effect on nitrate concentration in stream water of agricultural practices in small catchments in Brittany: II. Temporal variations and mixing processes. Hydrology and Earth System Sciences Discussions, European Geosciences Union, 2002, 6 (3), pp.507-514. �hal-00330840�
Effect on nitrate concentration in stream water of agricultural
practices in small catchments in Brittany :
II. Temporal variations and mixing processes
L. Ruiz, S. Abiven, C. Martin, P. Durand, V. Beaujouan and J. Molénat
Institut National de la Recherche Agronomique, Unité Sol, Agronomie et Spatialisation, 4 rue de Stang Vihan, 29000 Quimper, France Email for corresponding author: [email protected]
Abstract
In catchments with impervious bedrock, the nitrate concentrations in streamwater often show marked seasonal and small inter-annual variations. The inter-annual trends are usually attributed to changes in nitrogen inputs, due to changes in land use or in nitrogen deposition whereas seasonal patterns are explained in terms of availability of soil nitrate for leaching and of seasonality of nitrogen biotransformations. The companion paper showed that inter-annual variations of nitrogen in streamwater are not directly related to the variations of land use. The aim of this study is to describe nitrate concentration variations in a set of very small adjacent catchments, and to discuss the origin of the inter-annual and seasonal trends. Data from four catchments at the Kerbernez site (South Western Brittany, France) were used in this study. Nitrate concentrations in streamwater were monitored for eight years (1992 to 1999) at the outlet of the catchments. They exhibit contrasting inter-annual and seasonal patterns. An extensive survey of agricultural practices during this period allowed assessment of the amount of nitrogen available for leaching. The discharges measured since 1997 show similar specific fluxes but very different seasonal dynamics between the catchments. A simple, lumped linear store model is proposed as an initial explanation of the differences in discharge and nitrate concentration patterns between the catchments. The base flow at the outlet of each catchment is considered as a mixture of water from two linear reservoirs with different time constants. Each reservoir comprises two water stores, one mobile contributing to discharge, the other, immobile, where nitrate moves only by diffusion. The storm flow, which accounts for less than 10 % of the annual flux, is not considered here. Six parameters were adjusted for each catchment to fit the observed data: the proportion of deep losses of water, the proportion of the two reservoirs and the size and initial concentration of the two immobile stores. The model simulates the discharge and nitrate concentration dynamics well. It suggests that the groundwater store plays a very important role in the control of nitrate concentration in streamwater, and that the pattern of the seasonal variation of nitrate concentration may result from the long term evolution of nitrogen losses by leaching. Keywords: nitrate, diffuse pollution, groundwater, seasonal variations, agricultural catchment, simulation model
Introduction
Recently, hydrological and biogeochemical monitoring of catchments has become a common approach to studying water resource issues. This is particularly the case for nitrogen, N, the concentrations of which in streamwater usually show small year-to-year variations and marked seasonal variations: they increase in winter, when the vegetation uptake is minimal and the drainage is high. While the annual concentrations are often related to the atmospheric deposition or the agricultural input over the year, seasonal variations are attributed to the availability of soil nitrate for leaching (Neill, 1989; Johnes and Burt, 1993;
Reynolds and Edwards, 1995). This depends on the cropping system and on the internal soil nitrogen cycle which buffers strongly the inorganic nitrogen concentration in the soil solution (Burt et al., 1988; Mariotti, 1997; Worrall and Burt, 2001).
This interpretation assumes that the mean residence time of nitrogen in shallow groundwater systems is much less than one year (Burt and Arkell, 1987). However, this may not always be true. Ruiz et al. (2002), show that inter-annual variations of nitrogen in streamwater are not related directly to the changes in land use and suggest that groundwater may constitute an important store for nitrogen. Actually, in
L. Ruiz, S. Abiven, C . Mar tin, P. Durand, V. Beaujouan and J. Molénat
numerous catchments, the nitrate concentrations are much higher and much more variable in the water leaving the soil than in the river. Molenat et al. (2001) have shown that the nitrate concentration in the shallow aquifer, which supplies water to the stream in the Kervidy catchment in Brittany (France), is almost constant throughout the year. The frequency and spectral analysis of the input/output signal in different catchments show that the mean residence times may vary from one month to one year (Molenat et al., 2000); a similar analysis applied to the Plynlimon catchments in Wales shows that the travel time of chloride and sodium is very variable and may be very long, resulting in a very damped response of the streamwater chemistry to highly variable rainfall inputs (Kirchner et al., 2000, Neal and Kirchner, 2000).
In the hypothesis that nitrogen in streamwater is transport-rather than supply-limited, different processes can account for the seasonal variations observed. For some authors, the seasonal variations in nitrogen in streamwater are controlled principally by particular parts of the system, such as riparian wetlands (Hill, 1996), the hyporheic zone (Grimaldi and Chaplot, 2000), or deep groundwater (Mariotti, 1986; Pauwels, 1994). Sometimes, seasonal variations are interpreted as a consequence of the major water pathways being shallower in winter than in summer. The EMMA method (Christophersen et al., 1990), for example, assumes that variations of streamwater chemistry result from the mixing, in variable proportions, of different type of waters (“endmembers”). The “flushing hypothesis” (Creed et al., 1996; Boyer et al., 1996; Creed and Band, 1998) is slightly different: most of the nitrate is assumed to be stored in the unsaturated zone of the catchment, and is flushed out during wet conditions when the water table rises to reach this store. Although the basic mechanisms of the transfer of solutes, and especially of the most reactive ones, through catchments are known, the way they combine in time and space remains uncertain. Based on detailed observations of the discharge and nitrate variations in small adjacent rural catchments on granite bedrock, the present paper illustrates the variability of the seasonal patterns and proposes a simple exploratory model to analyse them.
Material and methods
The Kerbernez catchment network, comprising six first-order basins and one second first-order basin, have been described in the companion paper (Ruiz et al., 2002). The present paper considers the results obtained on four catchments only: Coat Timon (0.57 km²), Le Puits (0.37 km²), Kerbernez (0.12 km²) and Kerrien (0.095 km²). The two last named are subcatchments of Le Puits, and their
outlets are 13 m above sea level. The altitude of outlets of Coat Timon and Le Puits is 8 m above sea level. The average agricultural excess nitrogen was estimated, using the mass balance equation for each parcel, at 90 kg ha–1yr–1 (Ruiz et
al., 2002).
Daily water drainage and daily nitrogen leaching were calculated for each catchment over the period using the model of Burns (1974), assuming that all the nitrogen in excess is available in the top soil layer at the beginning of the drainage period each year. Drainage water dynamics were consistent with results obtained from lysimeters installed at the site (Simon and Le Corre, 1996).
Results
TEMPORAL VARIATIONS IN DISCHARGE
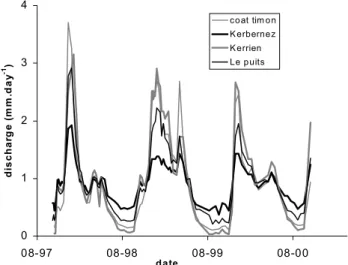
Discharge at the Le Puits outlet shows high seasonal variations and large peaks are observed throughout the year, corresponding to storm events. In such a small catchment, these peaks generally do not last for more than a few hours before discharge returns to base flow. On average, the quick flow associated with storm events represents only 10% of the total annual flux. More than 90% of the nitrate output is exported with base flow as nitrate concentration is generally diluted strongly during these storm events (Cooper and Roberts, 1996). Therefore, to a first approximation, storm events were neglected and base flow only was considered. The pattern of the temporal variations of specific base flow discharge (Fig. 1) is similar for all four catchments: the higher discharge is reached in early winter, and the minimum is observed in late autumn. However, the range of these seasonal variations differs among the four catchments. The
0 1 2 3 4 08-97 08-98 08-99 08-00 date di s c har g e ( m m .d a y -1) coat tim on Kerbernez Kerrien Le puits
Fig. 1. Specific discharge (mm.day-1) for the Kerbernez, Kerrien,
Kerrien catchment shows a high specific discharge in winter but it almost dries out in autumn. On the other hand, the Kerbernez catchment maintains a relatively high discharge during periods of low flow, but discharge remains moderate in winter. Le Puits and Coat Timon catchments behave intermediately.
TEMPORAL VARIATIONS OF NITRATE
(a) 0 30 60 90 120 10-91 10-93 10-95 10-97 10-99 NO 3 ( m g .l -1) (d) 0 30 60 90 120 10-91 10-93 10-95 10-97 10-99 NO 3 ( m g .l -1 ) date (c) 0 30 60 90 120 10-91 10-93 10-95 10-97 10-99 NO 3 ( m g .l -1) date (b) 0 30 60 90 120 10-91 10-93 10-95 10-97 10-99 NO 3 ( m g .l -1)
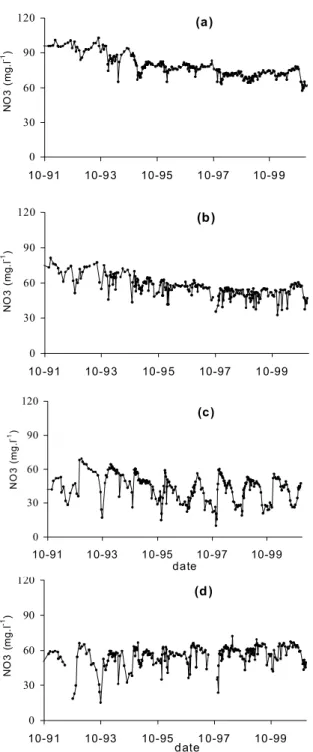
Fig. 2. Measured nitrate concentrations (mg NO3l–1) for the
Kerber-nez (a), Le Puits (b), Coat-Timon (c) and Kerrien (d) catchments
CONCENTRATIONS
Nitrate concentrations of base flow at the catchment outlets during the last decade show inter-annual trends and seasonal variations (Fig. 2). The inter-annual trends are not very marked. Concentrations have decreased slowly on the Kerbernez and Le Puits catchments since 1993, but they have been relatively steady on the two other catchments throughout the study period. The contrast between this relative stability and the important annual variations of the calculated concentration of drainage water is discussed by Ruiz et al. (2002).
The range of seasonal variations can be very important, in particular in Coat Timon and Kerrien catchments. Two different patterns are observed. For the Kerrien, Coat Timon and Le Puits catchments, the nitrate concentration peaks in winter, then decreases to a minimum in autumn. This pattern is commonly described in the literature in various environments (Burt et al., 1988; Evans et al., 1996). However, for the Kerbernez catchment, although the amplitude of the variation is very weak, the lowest concentrations occur in the winter months; thereafter, they increase gently to a maximum in autumn. This pattern has seldom been reported (Kemp and Dodds, 2001). Betton et
al. (1991), analysing data from a routine water quality survey
in 743 British sites, observed that 80% of the sites exhibited a seasonal variation with the maximum occurring in winter months, while for a few percent the maximum occurred in summer or autumn. Some authors have tried to relate the hydrological and hydrochemical behaviour of catchments to their morphology and geology (Watremez and Talbo, 1999). The results presented here show that adjacent catchments, very similar as regard to climate, size, bedrock and soils, can exhibit marked differences in their hydrology and in the seasonal variations of nitrate concentrations in streamwater.
Modelling temporal variations of
nitrate concentration
RATIONALE AND MODEL DESCRIPTION
Among the numerous hypotheses that can be generated to explain the differences of hydrology and hydrochemistry of these catchments, the simplest ones should be tested first. A simple hypothesis to explain the seasonal nitrate variations is to consider the streamwater as a mixture, in varying proportions, of two types of water with different concentrations. To make this hypothesis compatible with the differences in the hydrological responsiveness of the catchments, one has to assume that the two types of water
L. Ruiz, S. Abiven, C . Mar tin, P. Durand, V. Beaujouan and J. Molénat
correspond to two hydrological stores with different sizes and/or different discharge laws.
A simple, lumped linear two-stores model was built to test this hypothesis. Each catchment is modelled as the juxtaposition of two independent stores, A and B. Each store receives the same amount of water (ϕW, mm) and nitrogen (ϕN, g.m-2) from recharge (calculated daily with Burns’
(1974) model). They comprise two water reservoirs; one immobile, of constant volume V´ (mm), could be assimilated into microporal water, the other represents mobile water, whose volume V (mm) increases with drainage input and decreases following a linear law. For each day (i), the water balance for the A store is :
VA(i) = VA(i–1) + ϕW(i) – QA(i–1) (1)
QA(i) = αA VA(i) (2)
where αA is a constant drainage coefficient (day–1) and Q A(i)
is the specific water flow out of the compartment A on day i (mm). Since nitrogen is assumed to equilibrate within a day between the two reservoirs, the nitrogen concentration CA (g l–1) of the store, and therefore of the water flow is :
CA(i) = ( MA(i–1) + ϕN(i) – ( QA(i–1) . CA(i–1) ) ) / (VA(i)+V´A) (3)
where MA is the total amount of nitrogen (g m–2) in the store.
In summary, the two stores of a catchment are defined by the volume of immobile water V´A and V´B and by the value of the draining coefficient, one having a ‘quick’ discharge coefficient (αA) and the other a ‘slow’ draining coefficient
(αB<αA). The ‘quick’ and ‘slow’ terms must not be
misunderstood: the model aims to simulate the base flow variations only; the ‘fast’ store does not model the quick flow occurring during storm events.
In addition, each catchment is characterised by two constants: P (%), controlling the relative contribution of each store to the base flow, and L(%), representing the percentage of deep losses. The daily base flow Q(i) and the nitrogen concentration C(i) at the outlet of each catchment is considered as a mixture of water flowing from both stores : Q(i) = ( P/100 . Q A(i) + (1-P)/100 . Q B(i) ) . (100–L)/100 (4) C(i) = ( (Q A(i) .CA(i) ) + (Q B(i) .CB(i) ) ) / ( Q A(i) + Q B(i) ) (5) The whole model comprises six calibrated parameters (V´A; V´B; αA; αB; P, L), and four initialised variables (CA; CB ;
VA; VB ).
MODEL CALIBRATION
Simulations were run from 1st August 1993 to 31st December 2000, and parameters were calibrated on the last three years for discharge data and on the whole period for nitrate data. Table 1 presents the optimised values of the parameters for the different catchments. Significant deep losses had to be assumed to account for the observed water budgets. This is consistent with the fractured nature of the granite bedrock. The fitted proportion of deep losses (L) were 40% for the Kerbernez and Kerrien, 35% for Le Puits and 30% for Coat Timon catchments. The greatest losses occur from the catchments with the highest outlet altitude. To reduce the calibration degrees of freedom, the same values of αA and αB were adapted for all of the catchments,
respectively 3.10–2 and 15.10–5 day–1. The main fitting
parameter for the hydrological aspect of the model is the proportion (P) of the “quick” store in the catchment. The optimised values obtained for P are 45% for Kerbernez, 70% for Le Puits, 85% for CoatTimon and 90% for Kerrien catchments.
Discharge simulations for the four catchments are presented in Fig. 3. The model accounts satisfactorily for the broad range of seasonal variations in discharge for the different catchments. However, it anticipates the increase in discharge at the end of autumn. This may be due to the transit time through the vadose zone above the water table, which is not considered in the model.
The simulation of nitrate concentration in streams is presented in Fig. 4. Inter-annual variations are simulated by the model correctly. The model accounts for the decrease of nitrate concentrations in the Kerbernez and Le Puits catchments, and for the continuous increase of the nitrate concentration in the Kerrien catchment throughout the study period.
The dynamics of the seasonal variations of nitrate concentrations are also captured by the model which simulated the two opposite patterns observed (maximum nitrate in winter or in autumn), as well as some of the particular shapes observed in successive years. However, some important discrepancies remained, probably because of the excessive simplicity of the hydrological part of the model. For example, simulated nitrate concentrations in the Kerrien and Coat Timon catchments rise earlier in autumn than is observed in practice and this difference is probably linked to the over estimation of simulated discharge during that period. Other discrepancies question the validity of the model to some extent, particularly for the Le Puits catchment, for which the seasonal variations are poorly reproduced; this is not a first order catchment, and the hypothesis of two water stores may not be relevant in this case.
(a) 0 1 2 3 4 5 10-97 10-98 10-99 10-00 di sc ha rg e ( m m .da y -1 ) (b ) 0 1 2 3 4 5 10-97 10-98 10-99 10-00 d is cha rg e ( m m .da y -1 ) (c) 0 1 2 3 4 5 10-97 10-98 10-99 10-00 di sc ha rg e ( m m .da y -1 ) d ate (d ) 0 1 2 3 4 5 10-97 10-98 10-99 10-00 d isch a rg e ( m m .d a y -1 ) date (a) 0 30 60 90 120 10-91 10-93 10-95 10-97 10-99 NO 3 ( m g. l -1 ) (b ) 0 30 60 90 120 10-91 10-93 10-95 10-97 10-99 NO 3 (m g. l -1 ) (c) 0 30 60 90 120 10-91 10-93 10-95 10-97 10-99 NO 3 (m g. l -1 ) d ate (d ) 0 30 60 90 120 10-91 10-93 10-95 10-97 10-99 NO 3 (m g. l -1 ) d ate
Fig. 4. Simulated (grey line) and observed (black points) concentrations (mgNO3.L-1) for the Kerbernez (a), Le Puits (b), Coat Timon
(c) and Kerrien (d) catchments
Fig. 3. Simulated (grey line) and observed (black points) discharges (mm.day-1) for the Kerbernez (a), Le Puits (b), Coat Timon
L. Ruiz, S. Abiven, C . Mar tin, P. Durand, V. Beaujouan and J. Molénat
Discussion and conclusion
Numerous models are based on the assumption that stream flow is produced mainly by two water stores, one flowing rapidly and generating storm flow, the other with a slower draining coefficient generating base flow (Whitehead et al., 1998; Wade et al., 2002). The model presented here is different: it shows that base flow dynamics in contrasting catchments can be simulated easily by a two linear store model. This simple concept allows a very accurate simulation of the different patterns of seasonal variations of nitrate concentration in streamwater observed across the different catchments.
In its present state, the model has mainly a heuristic interest: it suggests a hierarchy of the processes controlling nitrate losses to the stream that is slightly different from that commonly assumed. It stresses the importance of the buffering capacity of the catchments (through the high fitted values of the immobile water volumes; Table 1) and of the mixing of waters with very different residence times. In that respect, the model agrees well with recent findings using completely different approaches (Kirchner et al., 2000, Molenat et al., 2002). This buffering capacity has been included in recent catchment nitrogen models, such as INCA and TNT, as a large store of immobile or slow moving soilwater and/or groundwater (Beaujouan et al., 2001; Wade
et al., 2002). The operational implication of this result is
that the changes in agricultural nitrogen inputs resulting from remediation policies may take several years to affect, noticeably, the nitrogen concentration in streams. However, it is necessary to consider this result with care because the average time response of the system resulting from this calibration is of the same order of magnitude as the length of the monitoring record.
The model so far has strong limitations: the nitrogen input to the topsoil is not calculated dynamically, but applied in one day; the two stores are supposed to have the same recharge; all the parameters are calibrated and cannot be adequately constrained.
The challenge is now to determine the degree of physical meaning of such a model. The two stores could correspond to two different aquifers, e.g., fractured granite and sandy weathering material. If so, are they juxtaposed laterally, superimposed vertically, or imbricated randomly? Are they really well defined and independent, or is there a continuous gradient of transmissivity and concentrations? This is the second heuristic interest of the model — to stimulate and guide further field investigations.
In spite of these uncertainties, this approach is of potential value for a rapid diagnosis of the long-term evolution of the nitrate concentrations in catchments. If it is true that the seasonal variations result from the mixing of two stores with different time constants, the range and timing of these variations reflect the state of the system: the larger is the range of variations, the more different are the concentrations of the stores, which suggests a quick evolution of the input of nitrogen in the system; if the concentration peaks in winter, when the contribution of the rapid store is highest, this store must have the highest concentration, which suggests that the input increases. This could explain why this type of pattern is more commonly found, especially in intensively farmed areas (Betton et al., 1991). Starting from this point, if the inputs are reduced, one should first observe a decrease in the range of the seasonal variations, and then an inversion of the type of variations, with peaks in autumn when the slow store would become more concentrated due to a slower response to the input changes.
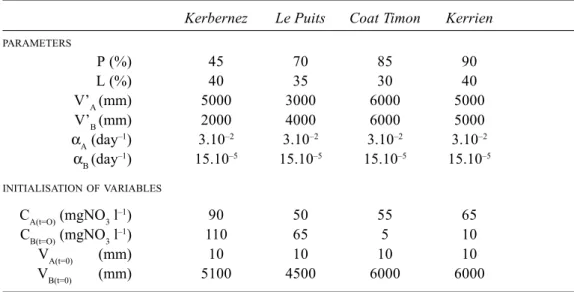
Table 1. optimised values of the parameters and initialised variables for the different catchments Kerbernez Le Puits Coat Timon Kerrien
PARAMETERS P (%) 45 70 85 90 L (%) 40 35 30 40 V’A (mm) 5000 3000 6000 5000 V’B (mm) 2000 4000 6000 5000 αA (day–1) 3.10–2 3.10–2 3.10–2 3.10–2 αB (day–1) 15.10–5 15.10–5 15.10–5 15.10–5 INITIALISATIONOFVARIABLES CA(t=O) (mgNO3l–1) 90 50 55 65 CB(t=O) (mgNO3l–1) 110 65 5 10 VA(t=0) (mm) 10 10 10 10 VB(t=0) (mm) 5100 4500 6000 6000
Although the recently developed nitrogen models try to take the heterogeneity and the buffering capacity of the catchments into account (Beaujouan et al., 2001; Wade et
al., 2002), this study illustrates the interest of a continuous
research and monitoring effort on long term catchment dynamics.
Acknowledgements
This work was supported by the European Commission (INCA project EVK1-1999-00011). The authors would like to thank Y. Quéré, M. Leroy and M. Faucheux for field and laboratory work, the ‘Lycée horticole de Kerbernez’ and all its staff for facilitating the access to the site and the farmers, who were always cooperative and keen to provide information and allow the access to the fields.
References
Beaujouan, V., Durand, P. and Ruiz, L., 2001. Modelling the effect of the spatial distribution of agricultural practices on nitrogen fluxes in rural catchments. Ecol. Modelling, 137, 91–103. Betton, C., Webb, B.W. and Walling, D.E., 1991. Recent trends in
NO3-N concentration and loads in British rivers. In Sediment
and stream water quality in a changing environment: trends and explanation, Proceedings of the Vienna Symposium, August
1991. IAHS Publ. n° 203, 169–180.
Boyer, E.W., Hornberger, G.M., Bencala, K.E. and McKnight, D., 1996. Overview of a simple model describing variation of dissolved organic carbon in an upland catchment. Ecol. Model.,
86, 183–188.
Burns, I.G., 1974. A model for predicting the redistribution of salts applied to fallow soils after excess rainfall or evaporation.
J. Soil Sci., 25, 165–178.
Burt, T.P. and Arkell, B.P., 1987. Temporal and spatial patterns of nitrate losses from an agricultural catchment. Soil Use Manage.,
3, 138–142.
Burt, T.P., Arkell, B.P., Trudgill, S.T. and Walling, D.E., 1988. Stream nitrate levels in a small watershed in south west England over period of 15 years (1970-1985). Hydrol. Process., 2, 267– 284.
Christophersen, N., Neal, C., Hooper, R.P., Vogt, R.D. and Andersen, S., 1990. Modeling streamwater chemistry as a mixture of soilwater end-members. A step towards second generation acidification model. J. Hydrol., 116, 307–320. Cooper, D.M. and Roberts, G., 1996. Nitrate leaching from a small
catchment in central England, Soil Use Manage., 12, 181–189. Creed, I.F. and Band, L.E., 1998. Exploring functional similarity in the export of nitrate-N from forested catchments : A mechanistic modeling approach. Water Resour. Res., 34, 3079– 3093.
Creed, I.F., Band, L.E., Foster, N.W., Morrison, I.K., Nicolson, J.A., Semkin, R.S. and Jeffries, D.S., 1996. Regulation of nitrate-N release from temperate forests: a test of the nitrate-N flushing hypothesis. Water Resour. Res., 32, 3337–3354.
Evans, C.D., Davies, T.D., Wigington, Jr., Tranter, M. and Kretser, W.A., 1996. Use of factor analysis to investigate processes controlling the chemical composition of four streams in the Adirondack Mountains, New York. J.Hydrol., 185, 297–316.
Grimaldi, C. and Chaplot, V., 2000. Nitrate depletion during within catchment: effects of exchange processes between streamwater, the hyperheic and riparian zone. Water Air Soil Pollut., 124, 95–112.
Hill, A.R., 1996. Nitrate removal in stream riparian zones. J.
Environ. Qual. 25, 743–755.
Johnes, P.J. and Burt, T.P., 1993. Nitrate in surface waters. In:
Nitrate, Processes, Patterns and Management, T.P. Burt, A.L.
Heathwaite and S.T. Trudgill (Eds.), Wiley, Chichester, UK, 269–317.
Kemp, M.J. and Dodds, W.K., 2001. Spatial and temporal patterns of nitrogen concentrations in pristine and agriculturally-influenced prairie streams. Biogeochem., 53, 125–141. Kirchner, J.W., Feng, X. and Neal, C., 2000. Fractal stream
chemistry and its implications for contaminant transport in catchments. Nature, 403, 524–527.
Mariotti, A., 1986. La dénitrification in situ dans les eaux souterraines, principes et méthodes de son indentification: une revue. J. Hydrol., 88, 1–23.
Mariotti, A., 1997. Quelques réflexions sur le cycle biogéochimique de l’azote dans les agrosystèmes. In: Maîtrise
de l’azote dans les agrosystèmes, G. Lemaire and B. Nicolardot
(Eds.), INRA, France, 9–22.
Molénat, J., Davy, P., Gascuel-Odoux, C. and Durand, P., 2000. Spectral and cross-spectral analysis of three hydrological systems. Phys. Chem. Earth (B), 25, 391–397.
Molénat, J., Durand, P., Gascuel-Odoux, C., Davy, P. and Gruau, G., 2002. Mechanisms of nitrate transfer from soils to stream in an agricultural watershed of French Brittany. Water Air Soil
Pollut., 133, 161–183.
Neal, C. and Kirchner, J.W., 2000. Sodium and chloride levels in rainfall, mist, streamwater and groundwater at the Plynlimon catchments, mid-Wales: inferences on hydrological and chemical controls. Hydrol. Earth Syst. Sci., 4, 295–310. Neill, M., 1989. Nitrate concentrations in river waters in the
south-east of Ireland and their relationship with agricultural practice.
Water Res., 23, 1339–1355.
Pauwels, H., 1994. Natural denitrification in groundwater in the presence of pyrite: preliminary results obtained at Naizin (Brittany, France). Miner. Mag., 58A, 696–697.
Reynolds, B. and Edwards, A., 1995. Factors influencing dissolved nitrogen concentrations and loadings in upland streams of the UK. Agr. Water Manage., 27, 181–202.
Ruiz, L., Abiven, S., Durand, P., Martin, C., Vertès, F. and Beaujouan, V. 2002. How nitrate concentration in stream water is affected by agricultural practices in small agricultural catchments: I. Annual nitrogen budgets for six small catchments in western Brittany (France). Hydrol. Earth Syst. Sci., this issue. Simon, J.C. and Le Corre, L., 1996. Recueil de données – Site de Quimper Kerfily. In: Trente ans de lysimétrie en France,
1960-1990, INRA (Ed.), 205–228.
Wade, A. J., Durand, P. , Beaujouan, V. , Wessels, W. , Raat, K. , Whitehead, P. G. , Butterfield, D., Rankinen, K. and Lepisto, A., 2002. A nitrogen model of European catchmentss: INCA, ew model structure and equations. Hydrol. Earth Syst. Sci.,6, 559–582.
Watremez, P. and Talbo, H., 1999. Typologie des bassins versants bretons. In: Pollutions diffuses : du bassin versant au littoral -Actes de colloques, 23, 24 septembre 1999 Saint-Brieuc, Ploufragan, IFREMER (Ed.), 210–219.
Whitehead, P. G., Wilson, E. J. and Butterfield, D., 1998. A semi-distributed Nitrogen Model for Multiple Source Assessments in Catchments (INCA): Part 1 - Model Structure and Process Equations. Sci. Total. Environ., 210/211, 547–558.
Worrall, F. and Burt, T.P., 2001. Inter-annual controls on nitrate export from an agricultural catchment — how much land-use change is safe? J. Hydrol., 243, 228–241.