HAL Id: hal-00298478
https://hal.archives-ouvertes.fr/hal-00298478
Submitted on 25 May 2007HAL is a multi-disciplinary open access
archive for the deposit and dissemination of sci-entific research documents, whether they are pub-lished or not. The documents may come from teaching and research institutions in France or abroad, or from public or private research centers.
L’archive ouverte pluridisciplinaire HAL, est destinée au dépôt et à la diffusion de documents scientifiques de niveau recherche, publiés ou non, émanant des établissements d’enseignement et de recherche français ou étrangers, des laboratoires publics ou privés.
Spectral studies of ocean water using DOAS
M. Vountas, T. Dinter, A. Bracher, J. P. Burrows, B. Sierk
To cite this version:
M. Vountas, T. Dinter, A. Bracher, J. P. Burrows, B. Sierk. Spectral studies of ocean water us-ing DOAS. Ocean Science Discussions, European Geosciences Union, 2007, 4 (3), pp.459-489. �hal-00298478�
OSD
4, 459–489, 2007 Spectral studies of ocean water M. Vountas et al. Title Page Abstract Introduction Conclusions References Tables Figures ◭ ◮ ◭ ◮ Back CloseFull Screen / Esc
Printer-friendly Version Interactive Discussion
EGU Ocean Sci. Discuss., 4, 459–489, 2007
www.ocean-sci-discuss.net/4/459/2007/ © Author(s) 2007. This work is licensed under a Creative Commons License.
Ocean Science Discussions
Papers published in Ocean Science Discussions are under open-access review for the journal Ocean Science
Spectral studies of ocean water using
DOAS
M. Vountas1, T. Dinter1, A. Bracher1, J. P. Burrows1, and B. Sierk2
1
Institute of Environmental Physics, University of Bremen, Otto-Hahn-Allee 1, 28359 Bremen, Germany
2
GFACG, TIGO Observatory, Concepci ´on, Chile
Received: 11 May 2007 – Accepted: 11 May 2007 – Published: 25 May 2007 Correspondence to: M. Vountas ([email protected])
OSD
4, 459–489, 2007 Spectral studies of ocean water M. Vountas et al. Title Page Abstract Introduction Conclusions References Tables Figures ◭ ◮ ◭ ◮ Back CloseFull Screen / Esc
Printer-friendly Version Interactive Discussion
EGU
Abstract
Methods enabling the retrieval of oceanic parameter from the space borne instrumenta-tion Scanning Imaging Absorpinstrumenta-tion Spectrometer for Atmospheric ChartographY (SCIA-MACHY) using Differential Optical Absorption Spectroscopy (DOAS) are presented. SCIAMACHY onboard ENVISAT measures back scattered solar radiation at a spectral
5
resolution (0.2 to 1.5 nm). The DOAS method was used for the first time to fit mod-elled Vibrational Raman Scattering (VRS) in liquid water and in situ measured phy-toplankton absorption reference spectra to optical depths measured by SCIAMACHY. Spectral structures of VRS and phytoplankton absorption were clearly found in these optical depths. Both fitting approaches lead to consistent results. DOAS fits correlate
10
with estimates of chlorophyll concentrations: low fit factors for VRS retrievals corre-spond to large chlorophyll concentrations and vice versa; large fit factors for phyto-plankton absorption correspond with high chlorophyll concentrations and vice versa. From these results a simple retrieval technique taking advantage of both measure-ments is shown. First maps of global chlorophyll concentrations were compared to the
15
corresponding MODIS measurements with very promising results. In addition, results from this study will be used to improve atmospheric trace gas DOAS-retrievals from visible wavelengths by including these oceanographic signatures.
1 Introduction
Ocean color sensors on board earth orbiting satellites provide a long-term record of
20
remotely sensed aquatic parameters. In practice such parameters are retrieved using appropriate radiance or reflectance ratios. Despite of their limitations these approaches have been very successful leading to significantly improved knowledge of inherent and apparent properties of sea water, chlorophyll concentration, and provided important information about the carbon cycle.
25
alterna-OSD
4, 459–489, 2007 Spectral studies of ocean water M. Vountas et al. Title Page Abstract Introduction Conclusions References Tables Figures ◭ ◮ ◭ ◮ Back CloseFull Screen / Esc
Printer-friendly Version Interactive Discussion
EGU tive approach using backscatter ultraviolet instrumentation utilizing Vibrational Raman
Scattering (VRS) spectral signature of liquid water. They clearly demonstrated the capability to evaluate oceanic chlorophyll content using VRS at a spectral resolution from GOME (Global Ozone Monitoring Experiment). Vountas et al.(2003) confirmed the coherence between VRS and chlorophyll concentration using Differential Optical
5
Absorption Spectroscopy (DOAS) analysis of GOME data .
In this study DOAS, which is a wide-spread technique in atmospheric trace gas re-trieval, is applied to backscatter measurements from the spaceborne instrument SCIA-MACHY (SCanning Imaging Absorption spectroMeter for Atmospheric CHartographY) to retrieve ocean parameters. SCIAMACHY is a follow-on mission of GOME with
ex-10
tended characteristics. It was launched on board ESA’s ENVIronmental SATellite, EN-VISAT, in 2002.
As for example shown in Vountas et al. (2003) VRS spectral signature can clearly be detected in oligotrophic waters due to larger penetration depths of light. Opposite behavior is shown in eutrophic waters such as large parts of the coastal zones. DOAS
15
retrievals in such regions will not show significant spectral structure from VRS because of increased absorption by dissolved matter and phytoplankton.
As direct and scattered UV-Vis. light penetrates the ocean surface and therefore interacts with phytoplankton the phytoplankton absorption spectra are imprinted on the backscattered radiance spectrum in the visible also. The molecules of the
photosyn-20
thetic pigments exhibit well structured absorption features in the visible wavelength range. Analogue to the VRS approach, a straightforward way to detect the phytoplank-ton biomass is therefore the DOAS evaluation of phytoplankphytoplank-ton absorption.
The objective of this publication is to show the potential of the DOAS analysis to re-trieve oceanic parameters (as fit factors) using two complementary methods taking into
25
account i) VRS spectral imprint in the UV and ii) the spectral fine structure of phyto-plankton absorption bands in the visible. Such evaluations require spectral resolution. Modern spaceborne spectrometers for analysis of atmospheric constituents, such as SCIAMACHY measure radiances at a spectral resolution around 0.2 nm (within the
OSD
4, 459–489, 2007 Spectral studies of ocean water M. Vountas et al. Title Page Abstract Introduction Conclusions References Tables Figures ◭ ◮ ◭ ◮ Back CloseFull Screen / Esc
Printer-friendly Version Interactive Discussion
EGU spectral intervals used in this study). On the other hand the instrument provides only a
rather coarse spatial resolution 30×60 km2 compared to established ocean color mis-sions like for example MODIS or SeaWiFS. In order to resolve scales of variability in the ocean at least a spatial resolution of 1 km2is necessary. Therefore this study aims to show the feasibility to retrieve valuable oceanic information from hyperspectral data
5
and provides the opportunity to further exploit spectral fine structure for other oceanic applications.
The publication is structured as follows: After giving some information about the SCIAMACHY instrument in Sect.2.1we describe briefly the DOAS method in Sect.2.2. While phytoplankton absorption spectra can be measured, VRS spectra have to be
10
modelled. Therefore Sect.2.3gives a description of a simple model to compute VRS spectra (which is a brief summary ofVountas et al., 2003). Finally both approaches are applied to SCIAMACHY backscatter measurements (Sect.3) and the retrieval of chlorophyll concentration is demonstrated (Sect.4).
2 Data sets and methods applied
15
2.1 SCIAMACHY
SCIAMACHY (Scanning Imaging Absorption Spectrometer for Atmospheric CHartog-raphY) (Bovensmann et al.,1999) was launched on board ESA’s ENVIronmental SATel-lite, ENVISAT, in 2002. The instrument is designed to measure a broad band of solar radiation, spanning from the UV to the near infrared. Apart from its broad spectral
20
coverage, a unique feature of SCIAMACHY is the ability to detect sunlight that has been transmitted, scattered and reflected in the Earth’s atmosphere in different ob-servation geometries. In particular, the spectrometer continuously alternates between limb and nadir modes, which allows the observation of the same volume of air under different viewing angles, facilitating the separation of stratospheric and tropospheric
25
OSD
4, 459–489, 2007 Spectral studies of ocean water M. Vountas et al. Title Page Abstract Introduction Conclusions References Tables Figures ◭ ◮ ◭ ◮ Back CloseFull Screen / Esc
Printer-friendly Version Interactive Discussion
EGU at high spectral resolution (in the UV-Vis.: 0.26–0.44 nm).
This study exclusively uses spectra measured in nadir-viewing. The main objective of SCIAMACHY, as well as the new Ozone Monitoring Instrument (OMI) on AURA and GOME-2 (Global Ozone Monitoring Experiment-2) on METEOSAT, is to determine the abundances of atmospheric trace gases. Although SCIAMACHY is primarily an
5
atmospheric mission, part of the detected solar radiation penetrates the ocean surface and picks up absorption and backscattering signals from sea water.
2.2 Differential Optical Absorption Spectroscopy (DOAS)
The DOAS method (Perner and Platt,1979) has proven to be a powerful, computionally fast and simple tool in atmospheric remote sensing. As already shown to be feasible
10
for GOME (Vountas et al.,2003) data we will apply and further develop DOAS retrievals of ocean parameters using SCIAMACHY data.
The DOAS technique usually exploits the sharp spectral features in backscatter radi-ance spectra that are caused either by absorption due to atmospheric constituents or spectral re-distribution features as induced by VRS in ocean waters (Vassilkov et al.,
15
2002;Vountas et al.,2003). Spectrally dynamic features are separated from the slowly varying attenuation due to scattering by subtracting a low-degree polynomial (typically of a degree of three) in a spectral fit procedure. However, depending on the size of the fitting window and the degree of the polynomial the algorithm is also able to retrieve broad spectral structures (Eisinger et al.,1996).
20
The DOAS retrieval involves the fitting and scaling of a set of spectra within a certain wavelength window, which can be composed of:
– atmospheric trace gas absorption cross-sections, – a polynomial,
– so-called pseudo-absorber spectra for example a reference spectrum for VRS in
25
liquid water and
OSD
4, 459–489, 2007 Spectral studies of ocean water M. Vountas et al. Title Page Abstract Introduction Conclusions References Tables Figures ◭ ◮ ◭ ◮ Back CloseFull Screen / Esc
Printer-friendly Version Interactive Discussion
EGU to the measured optical depth τ(λ, θ)= ln(I/I0). With I being the backscattered
radi-ance,I0the extraterrestrial irradiance.τ is a function of the wavelength λ and the solar
zenith angle θ (dependence omitted in the following). The fitting is formalized as a least-squares minimization: τ(λ) − L X i =1 Skσi(λ) − Saa(λ) − Svv(λ) − M X j=1 Sjrj(λ) − N X k=0 xkλk 2 → min. (1) 5
Here the input parameters to DOAS are:
– σi(λ) being the cross-sections for each atmospheric trace gas i (total number of
gases is L),
– a(λ): is the spectrum for phytoplankton absorption and
– v(λ): is a spectrum accounting for VRS (see below).
10
– M pseudo-absorber spectra rj(λ). Taking into account other pseudo-absorbers is often necessary and depends on the wavelength range investigated.
The output of DOAS are the fit factors for each spectrum and coefficients for each polynomial variable (here the wavelengthλ). Where Sk is the fit factor of the kth
at-mospheric absorber andSj the fit factor of thej th pseudo absorber. xl is thel th
poly-15
nomial coefficient (degree of the polynomial is N) accounting for spectral broadband features like Rayleigh and Mie scattering in atmosphere. The fit factor of chlorophyll absorption isSaand the one of VRS isSv.
The DOAS fit factors Sa and Sv contain specific information about ocean optical characteristics and will therefore be the target quantities in the following.
20
It should be noted that the DOAS method will lead to erroneous results if the refer-ence spectra used in the fit have spectral correlation, i.e. the fit algorithm will not be able to distinguish between similar spectral features.
As a scalar indicator of fit qualityχ2values are often used. Theχ2values are defined as the square of the wavelength-integrated fit residual weighted with the square of the
25
OSD
4, 459–489, 2007 Spectral studies of ocean water M. Vountas et al. Title Page Abstract Introduction Conclusions References Tables Figures ◭ ◮ ◭ ◮ Back CloseFull Screen / Esc
Printer-friendly Version Interactive Discussion
EGU 2.3 Optical properties of ocean water
Before we can use DOAS to determine the fit factorsSv andSato derive further infor-mation from them all relevant input spectra have to be selected carefully. Of particular importance arev(λ) and a(λ).
Determination ofv(λ): In order to account for VRS in DOAS retrievals an adequate
5
VRS spectrum has to be used in the analysis. Such a spectrum can be considered as a-priori information for the retrieval.
VRS is an inelastic scattering process which provides a mean wavenumber shift of 3357 cm−1. It involves two fundamental OH stretch vibration modes of the water
molecule that are further modified by hydrogen bonding and rotational fine structure.
10
These interactions induce a broad band of emissions around the mean wavenumber shift so that water Raman emissions occur over a band of ≈30–50 nm. In order to ac-count for this redistribution of photons a spectroscopic model of VRS has to be embed-ded in an adequate description of the interaction between light, water and atmosphere. This requires a coupled atmosphere-ocean radiative transport model.
15
As a first step we will have to define a reference spectrumv accounting for VRS in liquid water at a wavelengthλ as:
v(λ) = lnI
+VRS(λ)
I−VRS(λ). (2)
WithI+VRS being the modeled radiance taking into account VRS andI−VRS neglecting
it (Vountas et al., 2003). A prerequisite for taking into account VRS in DOAS-type
20
retrievals is therefore a precise knowledge of the quantitiesI+VRSandI−VRS.
The following paragraphs list the underlying spectra and assumptions necessary to create the reflectance being the central input for the determination ofI+VRSandI+VRS. The way how the reflectance is determined is shown elsewhere in detail (Vountas et al., 2003;Sathyendranath and Platt,1998).
25
OSD
4, 459–489, 2007 Spectral studies of ocean water M. Vountas et al. Title Page Abstract Introduction Conclusions References Tables Figures ◭ ◮ ◭ ◮ Back CloseFull Screen / Esc
Printer-friendly Version Interactive Discussion
EGU (1998) which is based on a modified Quasi-Single-Scattering Approximation. It takes
into account elastic backscattering and photon redistribution by VRS at the sea surface. This model has been incorporated into an atmospheric model, SCIATRAN (Rozanov et al.,1997,2005), by passing the reflectance function for a given chlorophyll concen-tration to the atmospheric model which computes the radiance or flux for a given
mea-5
surement geometry and atmospheric scenario. This hybrid model version will hence-forth be referred to as SCIATRAN-OC (OC: Ocean).
Apparent optical properties such as the reflectance require the knowledge of inher-ent optical properties (IOP) of the water body. With the exception of the VRS (back) scattering coefficient which is determined through a simple exponential expression both
10
IOPs, the total absorption coefficient at and the total backscattering coefficient bt will
depend solely on chlorophyll concentration [mg/m3], i.e. we consider case-1 waters (Morel and Prieur,1977). It should however be noted that measurements and corre-sponding parametrizations of IOPs in the UV are rare and often unreliable (Vassilkov et al., 2002b). Accordingly, errors in the IOPs will translate into the determination of
15
the VRS reference spectra.
For the determination of at two pure water absorption spectra from Buiteveld et al.
(1994) and Quickenden and Irvin (1980) have been used. In the UV-overlap region both spectra were smoothly spline-interpolated.
The (specific) phytoplankton absorption is taken from Bracher and Tilzer (2001).
20
These spectra were derived from in situ measurements of particulate absorption be-tween 300 and 750 nm on water samples from different biogeochemical provinces of the South Atlantic Ocean which were afterwards corrected for detritus absorption and normalized to chlorophyll concentration according to the method developed byYentsch (1962) and modified byBricaud and Stramski(1990) using theβ-correction ofMitchell
25
and Kiefer (1988).
Current operational schemes for determining phytoplankton biomass from ocean color data use a single bio-optical model. For instance OC4V4 byO’Reilly et al.(2000) is currently used to generate global maps of chlorophyll-a from both SeaWiFS and
OSD
4, 459–489, 2007 Spectral studies of ocean water M. Vountas et al. Title Page Abstract Introduction Conclusions References Tables Figures ◭ ◮ ◭ ◮ Back CloseFull Screen / Esc
Printer-friendly Version Interactive Discussion
EGU MODIS imagery. Global remote sensing algorithms, such as version four of the NASA
algorithm (OC4) are designed for use at global scales and are found to be less accu-rate at local and regional scales. This is because the simplified parameterization of seawater composition in terms of chlorophyll-a concentration alone does not account for much of the optical variability observed in natural waters. This is in case-1 waters
5
mainly caused by the variation of the specific phytoplankton absorption among species, but also within the same species depending on the photoacclimative state due to differ-ences in packaging (package effect) and the composition of photosynthetic pigments (see e.g.Sathyendranath et al.,1987;Hoepffner and Sathyendranath,1991;Bracher and Tilzer,2001;Ciotti et al.,2002).
10
For the determination ofbtthe pure sea water scattering coefficients bw were taken
from (Smith and Baker, 1981) and used within the bio-optical model for the elastic backscattering coefficient proposed byMorel (1988). The VRS backscattering coeffi-cient is computed following the approach described inVountas et al.(2003).
Finally, absorption from dissolved organic matter (DOM) is treated according to the
15
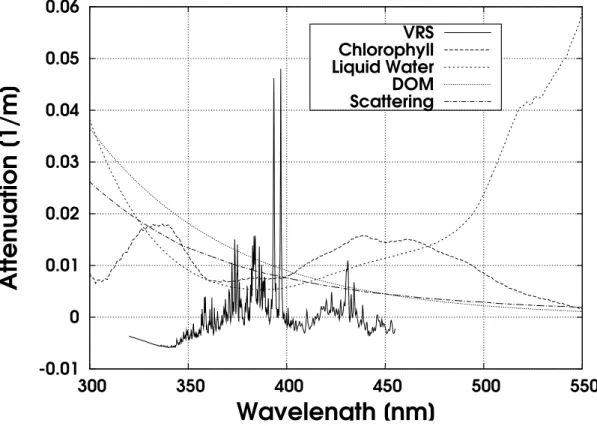
model ofMorel (1988). Here, the DOM absorption at 440 nm is 20% of the total ab-sorption of pure seawater and particulate matter and an exponential function is used to describe the spectral variation. The spectral slope of DOM is set to the wide-spread value of 0.014 nm−1. As can be seen in Fig. 1 DOM absorption changes smoothly
with respect to the wavelength within a typical DOAS wavelength window of a size of
20
30–70 nm used here. Such spectral imprint is safely removed by the fitted polynomial. For a wavelength range of 300 – 550 nm relevant scattering and absorption coeffi-cients are shown in Fig.1.
Determination of a(λ): As in case of the determination of v(λ) a phytoplankton absorption spectrum fromBracher and Tilzer(2001) has been used. We expect most
25
reliable DOAS fits in regions where the selected spectrum has been measured (i.e. in the South Atlantic). Even though we will not restrict our DOAS retrievals to this region but perform global fits the results can give valuable and simple information and show the feasibility of the approach.
OSD
4, 459–489, 2007 Spectral studies of ocean water M. Vountas et al. Title Page Abstract Introduction Conclusions References Tables Figures ◭ ◮ ◭ ◮ Back CloseFull Screen / Esc
Printer-friendly Version Interactive Discussion
EGU
3 Applications
Prior to application of DOAS using a VRS spectrum and phytoplankton absorption spectrum, additional fit parameters have to be defined. Dependending on the target quantity slightly different wavelength windows have been selected: the regular VRS retrieval is performed between 349.5 nm and 382 nm, where the spectral structure of
5
VRS can easily be distuingished from other spectral components (Vountas et al.,2003). First tests ofSierk et al.(2004) could show that fitting of phytoplankton absorption spec-tra performs well in another wavelength window located at about 428–496 nm, where photosynthetic pigments of phytoplankton have generally their maximum absorption.
In the considered wavelength ranges are weak atmospheric absorbers potentially
10
disturbing the DOAS fit if not accounted for such as ozone, bromine monoxide, nitro-gendioxide and the oxygen dimer. These spectral features have been accounted for using the appropriate reference spectra in the DOAS fits.
Additionally (inelastic) rotational Raman scattering at air molecules can fill-in solar Fraunhofer and telluric lines and is able have large impact on DOAS retrievals if not
15
properly accounted for. The effect became known as the Ring effect (after Grainger and Ring,1962) and can be accounted for by fitting a modelled pseudo-absorber- also called Ring-spectrum, defined as inVountas et al.(1998).
For the retrievals described in the following, a fixed setup for the VRS and Ring spec-trum computations has been used. SCIATRAN-OC computed VRS (Vountas et al.,
20
2003) and Ring spectra (Vountas et al.,1998) with a fixed chlorophyll concentration of 0.1 mg/m3at a solar zenith angle of 30◦. A maritime aerosol setup with moderate
visi-bility has been used. Trace gas and temperature profiles were taken from a climatology (Br ¨uhl and Crutzen, 19921) for 25◦southern latitude.
Small wavelength shifts due to tiny differences in the wavelength scale used in the
25
VRS, Ring, cross-sections, SCIAMACHY irradiance and radiance spectra are corrected
1
Br ¨uhl, C. and Crutzen, P.: Chemo-dynamical model of the atmosphere: Profile data base, personal communication, 1992.
OSD
4, 459–489, 2007 Spectral studies of ocean water M. Vountas et al. Title Page Abstract Introduction Conclusions References Tables Figures ◭ ◮ ◭ ◮ Back CloseFull Screen / Esc
Printer-friendly Version Interactive Discussion
EGU by allowing a non-linear shift-and-squeeze of the wavelength axis for each spectrum
relative to an arbitrary reference, here the SCIAMACHY radiance.
One important prerequisite is that the groundpixel has to be cloud-free. A very sim-ple but effective approach has been used to identify clear sky pixels: the measured radiance is integrated over the wavelength window and normalized to the number of
5
wavelengths. The resulting value is compared to an empirical threshold value deter-mined beforehand. The underlying physical principle goes back to increased backscat-ter over cloudy scenes leading to significantly larger radiance values. This approach helps masking cloudy pixels fast and effective but is very sensitive to the threshold used. In this study we have fixed the threshold for all cases conservatively low in order
10
to reject even partially cloudy pixels.
As the spatial resolution of SCIAMACHY is rather poor compared to spectrally lower resolving imagers such as SeaWiFS, MERIS or MODIS larger periods of data have to be investigated. For the global maps shown here one month of cloud-free SCIAMACHY nadir data served as a basis. Depending on the data density on overcast situation
15
shorter periods of about two weeks are possible.
3.1 Regional VRS-fitting
The above described retrieval technique has been applied to several thousand SCIA-MACHY groundpixels but as a first step a study on a regional scale has been performed to identify the spectral signature of VRS,v(λ), in SCIAMACHY data. As an example
20
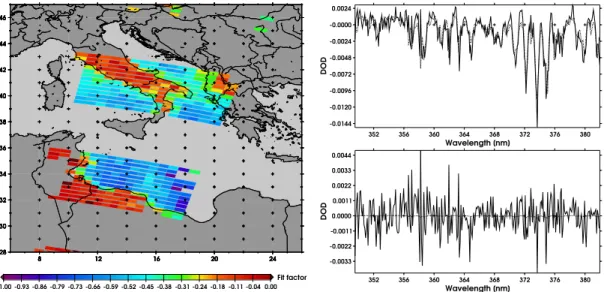
orbit 12429 measured on 16 July 2004 has been selected. In Fig.2 the fit factor Sv
of a VRS reference spectrum modelled for a chlorophyll concentration of 0.1 mg/m3is shown in a color-coded way.
An obvious feature is the water-land contrast: pixels over land are significantly down-scaled to values of around zero. This indicates, as expected, that the VRS spectral
25
signature cannot be found in land pixels. For coastal zone pixels, where water and land has been in the field of view of the sensor the fit factor is diluted to values around −0.3. Interestingly some pure land pixels still have fit factors different from zero. We suspect
OSD
4, 459–489, 2007 Spectral studies of ocean water M. Vountas et al. Title Page Abstract Introduction Conclusions References Tables Figures ◭ ◮ ◭ ◮ Back CloseFull Screen / Esc
Printer-friendly Version Interactive Discussion
EGU uncompensated spectral Ring effect structures to be the reason for this. This mismatch
could be reduced when modelling the Ring reference spectrum for the adequate scene albedo. The sign of the fit factors is negative. This fact is a consequence of our DOAS implementation, defining ln(I/I0)=τ and not like the physical law ln(I0/I)=τ (compare with
Eq.1). Changing the sign of the resulting fit factor after retrieval is uncritical but has
5
not been performed.
The consistent picture persists if the spectral fit results over land and open water are compared. A widespread approach testing the fit quality for a specific target species using DOAS retrievals is to plot the scaled reference spectrum and overplot the scaled reference spectrum with the added fit residual. This approach simplifies the spectral
10
and quantitative comparison of the scaled reference and the residual. Figure2(upper right panel) shows the spectral fit results for an open water retrieval of the selected orbit in the Mediterranean sea. Obviously the VRS reference spectrum fits well and is clearly uncorrelated to the residual. Expected opposite behaviour is seen for results over land (lower right panel): the scaled VRS spectrum is almost zero which indicates
15
that no spectral signature of VRS could be retrieved.
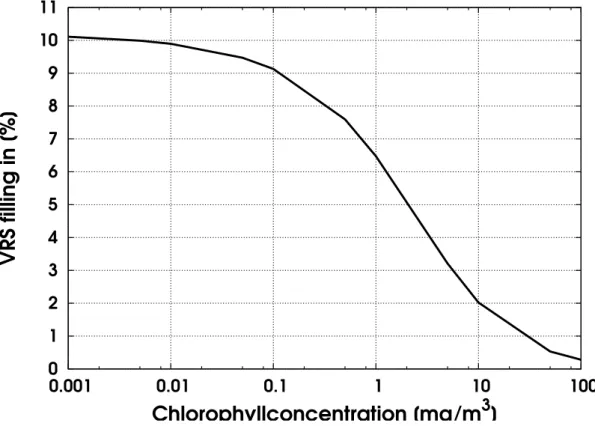
Yet an important issue is that over open water the VRS reference spectrum is not ad-equate for every groundpixel but has a fit factor different from (negative) unity. The rea-son for this can easily be understood if the relation between Fraunhofer line filling and chlorophyll concentration is recapitulated. Figure3 shows the modelled dependence
20
of the in-filling at 397 nm (a Calcium Fraunhofer line) and the chlorophyll concentration. With increasing chlorophyll concentration the filling in for this line decreases rapidly.
The same mechanism can be seen in Fig.2. Here, a fit factor larger than −1 (tend-ing to zero) means that the modelled VRS reference spectrum provides more fill(tend-ing-in than necessary for the SCIAMACHY spectrum currently evaluated. As a consequence
25
the reference has to be scaled down in order to fit to the effective situation during measurement. A lower net-in-filling corresponds to a scene with higher chlorophyll concentration, according to Fig.3. The VRS spectrum has to be downscaled in prac-tically all cases which indicates that the chlorophyll content for the particular ground
OSD
4, 459–489, 2007 Spectral studies of ocean water M. Vountas et al. Title Page Abstract Introduction Conclusions References Tables Figures ◭ ◮ ◭ ◮ Back CloseFull Screen / Esc
Printer-friendly Version Interactive Discussion
EGU pixels is larger than the one related to the modelled VRS spectrum (therefore the
ac-tual chlorophyll concentration can be considerered larger than 0.1 mg/m3). 3.2 Global VRS-fitting
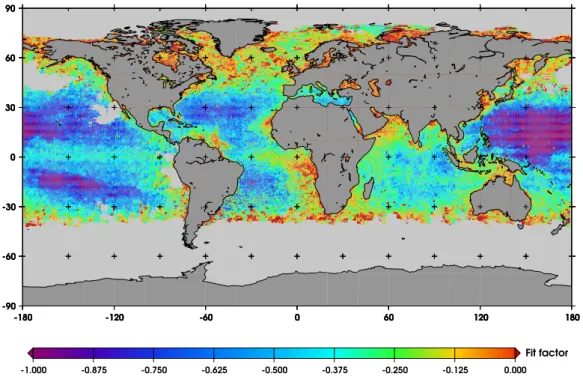
Applying the above described technique to one month of SCIAMACHY nadir data leads to a dense global map of VRS fit factors. July 2005 has been selected and 999 Orbits
5
have been evaluated. As in the regional study a clear water-land contrast can be shown globally (for clarity land retrievals are not depicted).
Regions with practically no scaling for VRS (fit factors near −1) correspond to well known large fields of oligotrophic waters. The reason for this has been described above.
10
Low overall χ2 values can be found and indicate good global fit quality. Figure 4 shows the map of VRS fit factors. The global fits have been performed with a solar zenith angle limit of 60◦due to signal to noise issues. However, in the southern
hemi-sphere this still seems to be insufficient because of very low fit factors for VRS over the whole range of longitudes. The reason for this is still not understood.
15
Not shown are the fit factors for the Ring reference. They show no systematic and significant scaling in oligotrophic waters. Therefore the Ring effect does not induce ar-tificial spectral structures that are erroneously compensated by VRS. Interesting is that the Ring fit factor shows a clear latitudinal variation, arising from strong solar zenith an-gle dependence and is significantly smaller over mountain areas which is in full
agree-20
ment with our model.
3.3 Regional phytoplankton-fitting
The next step has been to fit phytoplankton spectra, a(λ), to SCIAMACHY optical depths in the wavelength window of 428–496 nm taking into account atmospheric ab-sorption and pseudo absorbers (VRS and Ring reference spectrum).
25
sev-OSD
4, 459–489, 2007 Spectral studies of ocean water M. Vountas et al. Title Page Abstract Introduction Conclusions References Tables Figures ◭ ◮ ◭ ◮ Back CloseFull Screen / Esc
Printer-friendly Version Interactive Discussion
EGU eral (23) specific absorption spectra derived from surface water samples (fromBracher
and Tilzer, 2001) in the DOAS fit. As for the current operational chlorophyll-a algo-rithms used in case-1 waters by MODIS, SeaWIFS and MERIS, we chose one single specific absorption spectrum as standard for the DOAS-fit with SCIAMACHY data in order to obtain distributions of phytoplankton: Our investigations showed that global
5
distributions of phytoplankton absorption retrieved from SCIAMACHY data compares very well to global distributions derived from MODIS operational chlorophyll-a level-2 data (see below) when a specific absorption spectrum measured at surface water sam-ples from the Antarctic Circumpolar Current was used. Here, the phytoplankton was characterized by low biomass (<0.5 mg chl-a/m3), high specific phytoplankton
absorp-10
tion, a mixed phytoplankton composition with almost all within the size class smaller than 20 µm and where diatoms, dinoflagellates, prymnesiophytes and chrysophytes contributed more or less equally to the overall biomass.
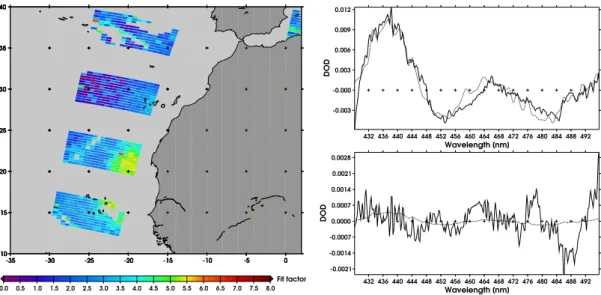
Figure5depicts fit factors of a phytoplankton spectrum over an upwelling region near the African West coast. The figure shows clear indication of increased chlorophyll
con-15
centration near the upwelling. Here, the phytoplankton absorption spectrum is strongly scaled (color-coded in green and red). Both plots on the right hand side show fit results (so-called differential optical depths) for phytoplankton absorption near the upwelling (upper right panel) and over the open oligotrophic ocean (lower right panel). As ex-pected, low scaling can be observed for oligotrophic and strong for eutrophic waters.
20
3.4 Global phytoplankton-fitting
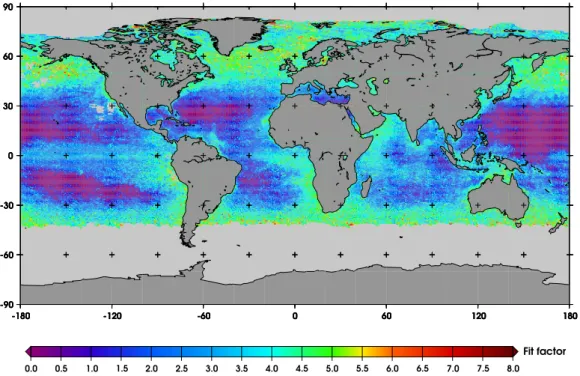
An example for a global fit of chlorophyll created for the whole month of July 2005 from SCIAMACHY nadir data is shown in Fig.6.
The map shows that increased fit factors for the phytoplankton reference spectrum clearly correlate to high chlorophyll concentrations (as for example seen in the
corre-25
sponding MODIS global chlorophyll concentration map in Fig.7). Clearly this approach is not only valid on a regional scale, but shows consistent global results.
OSD
4, 459–489, 2007 Spectral studies of ocean water M. Vountas et al. Title Page Abstract Introduction Conclusions References Tables Figures ◭ ◮ ◭ ◮ Back CloseFull Screen / Esc
Printer-friendly Version Interactive Discussion
EGU appropriate phytoplankton absorption spectra which will be performed in a successive
study.
4 Quantitative assessment
4.1 Savs. chlorophyll concentrations
We performed a large quantitative comparison between MODIS OC4V4-Aqua
5
chlorophyll-a data (≈1 km2) with results derived from SCIAMACHY data using DOAS-fitting of phytoplankton absorption. Collocations were chosen with comparing the mean of all MODIS data measured within a SCIAMACHY pixel at the same day. In order to avoid artifacts, only comparisons were made when at least 10 MODIS pixel were col-located to a SCIAMACHY observation.
10
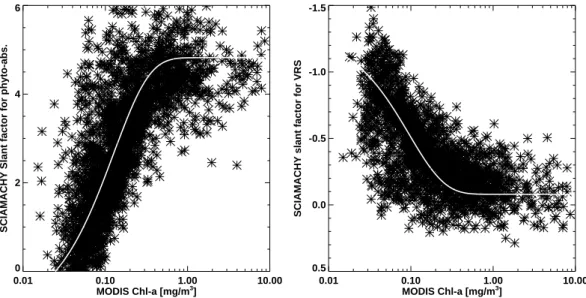
Figure8 (left) shows a scatter plot for all collocations in July 2005. Results show a “gamma”-shaped (Γ) relation between the DOAS fit factor and the MODIS chlorophyll concentration. A simple exponential curve could be fitted according to the equation f (φ)=a0−a1exp(−a2∗ φ), with φ being the chlorophyll concentration as obtained from
MODIS. The scatter around the fitted curve is still not fully understood and might
par-15
tially be attributed to spatial and temporal variations of chlorophyll-concentrations. The curve shows a “saturation” of the SCIAMACHY fit factors for MODIS chlorophyll concentrations higher than 0.5 mg/m3. Obviously the input radiance spectra from SCIA-MACHY are not changing significantly with higher chlorophyll concentrations which is likely to be related to the selected wavelength interval where the penetration depth of
20
light is not sufficient and should be adapted in further studies. 4.2 Sv vs. chlorophyll concentrations
MODIS chlorophyll-concentrations have also been compared to VRS-fitting results from SCIAMACHY. The procedure was analogous to the one described above. A compa-rable but mirrored “gamma”-shape relation between the DOAS fit factor for VRS and
OSD
4, 459–489, 2007 Spectral studies of ocean water M. Vountas et al. Title Page Abstract Introduction Conclusions References Tables Figures ◭ ◮ ◭ ◮ Back CloseFull Screen / Esc
Printer-friendly Version Interactive Discussion
EGU the MODIS chlorophyll concentration could be found (see Fig.8, right). The functional
dependence was again as forf (φ) (see above), with φ being the chlorophyll concen-tration as obtained from MODIS.
The absolute value of the VRS fit factor decreases with increasing MODIS chloro-phyll concentrations, which is expected behavior. A similar “saturation” effect as in the
5
comparison of chlorophyll concentrations and chlorophyll fit factors can be observed. 4.3 Chlorophyll concentrations
Both approaches, fitting VRS or phytoplankton absorption spectra, exhibit expected clear correlations to chlorophyll concentrations. Obviously both methods could be used to retrieve this quantity. An optimized retrieval technique would take advantage of a
10
hybrid approach: VRS fits strongly in regions where low chlorophyll concentrations prevail whereas direct fitting of phytoplankton behaves vice versa. One method could potentially stabilize the other.
The fit factorSafor phytoplankton (or to be precise for the specific absorption
spec-trum) is given in [mg/m2] which is a mass column. If the penetration depth δ of light
15
for the wavelength window considered is known this column can be converted into a concentration by the ratio:
C = Sa/δ (3)
VRS is strongly related toδ and serves therefore as a proxy: A single vibrational Ra-man scattering event is always accompanied by an elastic scattering process.
There-20
fore, the fit factor of VRS,Sv, is directly related to the same quantity for elastic
scatter-ing only. As described above (and in more detail inVountas et al.,2003) a bio-optical model from Morel (1988) has been used to describe the dependence of the elastic backscattering coefficient bb.
The backscattering coefficient scaled with the same factor as the VRS spectrum
25
(Sv) can be understood as the truebb for the real situation considered. Asb−1
b is the
OSD
4, 459–489, 2007 Spectral studies of ocean water M. Vountas et al. Title Page Abstract Introduction Conclusions References Tables Figures ◭ ◮ ◭ ◮ Back CloseFull Screen / Esc
Printer-friendly Version Interactive Discussion
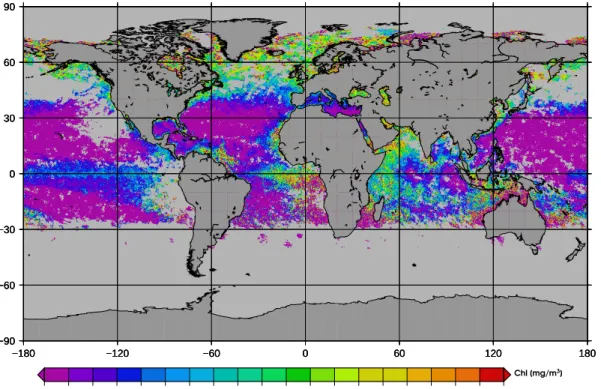
EGU the whole retrievals ofSa for July 2005 (as described above) all corresponding values
ofSv have been used within Eq. (3) to model a global map of chlorophyll
concentra-tionsC, which is displayed in Fig.9. A first visual comparison with MODIS chlorophyll concentrations (Fig.7) shows good agreement. Further studies will optimize this ap-proach and will also include a thorough quantitative comparison. An important point of
5
investigation must be the impact of the “saturation effects” (shown in Sect.4.1) on the chlorophyll concentration convertions. The patchy appearance of the mapped chloro-phyll concentrations is related to the fact that due to fitting failures, either in case of VRS, or phytoplankton fitting, not both corresponding quantities could be related.
However, there are alternative ways to use hyperspectral “imagery” data to retrieve
10
chlorophyll concentrations. For instance, fitting a liquid water spectrum also has been tested with interesting results: first a stand-alone chlorophyll concentration retrieval from phytoplankton-fitting has been tested. One advantage of the DOAS approach retrieving phytoplankton absorption is that in the wavelength range considered the ef-fective liquid water path can be determined. As the fit factor of the liquid water
spec-15
trum Sl w represents the number of water molecules encountered by photons along the average propagation path the under-water light path,Lwp can easily be estimated
(assuming constant water density near surface) from:
Lwp=
Sl w rl w
(4)
withrl w being the density of liquid water. Assuming a constant chlorophyll
concentra-20
tion along the identical average light path yields:
rchl =
Schl Lwp
(5)
First tests (Sierk et al., 2004) showed promising results but this approach has still to be used in global retrievals and must be validated.
Yet another promising stand-alone test has been performed for VRS-fitting. Here
25
OSD
4, 459–489, 2007 Spectral studies of ocean water M. Vountas et al. Title Page Abstract Introduction Conclusions References Tables Figures ◭ ◮ ◭ ◮ Back CloseFull Screen / Esc
Printer-friendly Version Interactive Discussion
EGU given in Fig.8. Using the exponential dependence between Sv andC we applied this
function to one month of SCIAMACHY VRS fit factors. The validation will be part of a subsequent study. First comparisons of SCIAMACHY’s and MODIS’ chlorophyll con-centrations show good agreement. However, this approach is strongly dependent on the quality of MODIS data. Problems with MODIS’ chlorophyll concentrations
signifi-5
cantly interfere with such a retrieval.
5 Conclusions
For the first time the DOAS retrieval method has been used fitting VRS reference spectra to optical depths measured from SCIAMACHY. We clearly have found spec-tral structures of VRS in SCIAMACHY measurements. Furthermore, a novel approach
10
has been described to fit phytoplankton absorption spectra within DOAS.
Both fitting VRS or phytoplankton reference spectra lead to consistent results. VRS fit factors clearly correlate with chlorophyll concentrations. Low factors correspond to high chlorophyll concentration and vice versa. As expected opposite behavior is ob-served when fitting phytoplankton spectra: Here, low factors correspond to low
chloro-15
phyll concentration and vice versa. Both approaches are promising tools for retrievals of chlorophyll concentration. First results of a hybrid approach show good agreement with chlorophyll concentrations derived from MODIS and confirm the feasibility of the approach. However, more fine-tuning of the retrievals will be necessary. A more in-depth validation result will be shown in a consecutive study.
20
Despite the spatial resolution of SCIAMACHY being far lower than for the ocean color imagers such as MODIS, SeaWIFS, MERIS, MOS, etc. further developments of our method to identify phytoplankton absorption in satellite spectra are of great relevance for improving chlorophyll concentration determinations for ocean color imagers. So far it has become clear that remote sensing algorithms derived for ocean color imagers
25
are designed for use at global scales but less accurate at regional and local scales (Sathyendranath et al.,2004). Phytoplankton and associated particulate and dissolved
OSD
4, 459–489, 2007 Spectral studies of ocean water M. Vountas et al. Title Page Abstract Introduction Conclusions References Tables Figures ◭ ◮ ◭ ◮ Back CloseFull Screen / Esc
Printer-friendly Version Interactive Discussion
EGU material absorb and scatter light, and their collective influence dominates the optical
variability of the water column, at least in the open ocean waters generally referred to as case-1 waters. Phytoplankton absorption varies between species and phytoplank-ton groups but also in dependence to their physiological states (see Sathyendranath et al.,1987;Mitchell and Kiefer,1988; Babin et al.,1993;Bracher and Tilzer,2001).
5
Therefore, errors arise in the common ocean color retrievals because the corrected water-leaving radiance can vary independently of changes in chlorophyll concentra-tions, as in dependence to the specific phytoplankton absorption. In our study we sought to to use the high resolution spectra of the satellite instrument SCIAMACHY in order to look for phytoplankton absorption in open ocean areas. These retrievals could
10
be used to improve chlorophyll retrievals from common ocean color sensors by using the right regional phytoplankton spectrum, which will improve modelling primary pro-duction and food web dynamics in the global open oceans. In addition, also retrievals of atmospheric constituents from backscatter UV satellite measurements will improve when the ocean optical signals, such as phytoplankton absorption are also considered
15
in radiative transfer models used in these retrievals.
Further analyses are planned to check whether discrimination between different phy-toplankton groups dominating the chlorophyll concentration is possible since the DOAS method is highly sensitive to spectral structures. If this parameter can be retrieved from remote sensing data, further improvements for regional and global marine chlorophyll
20
and marine primary production estimates are expected.
Acknowledgements. The authors would like to thank the MODIS project for the distribution
of the MODIS data. Also, we would like to thank K. Bramstedt and M. Weber for help with computational issues. Funding for one of us (Bracher) has been supplied by the Deutsche Forschungsgemeinschaft (DFG) project PASAT.
OSD
4, 459–489, 2007 Spectral studies of ocean water M. Vountas et al. Title Page Abstract Introduction Conclusions References Tables Figures ◭ ◮ ◭ ◮ Back CloseFull Screen / Esc
Printer-friendly Version Interactive Discussion
EGU
References
Babin M., Therriault J.C., Legendre L., and Condal A.: Variations in the specific absorption co-efficient for natural phytoplankton assemblages: impact on estimates of primary production, Limnol. Oceanogr., 38, 154–177, 1993. 477
Bovensmann H., Burrows J. P., Buchwitz M., Frerick J., No ¨el S., and Rozanov V. V.:
SCIA-5
MACHY: Mission Objectives and Measurement Modes, J. Atm. Sci., 56, 127–150, 1999.
462
Bracher, A. and Tilzer, M.: Underwater light field and phytoplankton absorbance in different surface water masses of the Atlantic Sector of the Southern Ocean, Pol. Biol., 24, 687–696, 2001. 466,467,472,477,481
10
Bricaud, A. and Stramski, D.: Spectral absorption coefficients of living phytoplankton and non-algal biogenous matter: A comparison between the Peru upwelling area and the Sargasso Sea, Limnol. Oceanogr., 35, 562–582, 1990. 466
Buiteveld, H., Hakvoort, J., and Donze, M.: The optical properties of pure water, SPIE Proc. on Ocean Optics XII, 2258, 174–183, 1994.466,481
15
Ciotti, A. M., Lewis, M. R., and Cullen, J. J.: Assessment of the relationships between dom-inant cell size in natural phytoplankton communities and spectral shape of the absorption coefficient, Limnol. Oceanogr., 47, 404–417, 2002.467
Eisinger, M., Burrows, J. P., and Richter, A.: Studies on the Precision of GOME Irradiance and Radiance Products and GOME Measurements of OClO and BrO over Antarctica, Proc. Of
20
GOME Geophysical Validation Campaign, Final results Workshop proceedings, ESA WPP-108, 93–WPP-108, 1996.463
Grainger, J. and Ring, J.: Anomalous Fraunhofer line profiles, Nature, 193, 762, 1962.468
Hoepffner, N. and Sathyendranath, S.: Effect of pigment composition on absorption properties of phytoplankton populations: implications for production in the open ocean, Mar. Ecol. Prog.
25
Ser., 73, 11–23, 1991. 467
Joiner, J., Vassilkov, A. P., Flittner, D. E., Gleason, J. F., and Bhartia, P. K.: Retrieval of cloud pressure and oceanic chlorophyll content using Raman scattering in GOME ultraviolet spec-tra, J. Geophys. Res., 109, doi:10.1029/2003JD003698, 2004.460
Mitchell, B. G. and Kiefer, D.: Chlorophyll a specific absorption and fluorescence excitation
30
spectra for light-limited phytoplankton, Deep Sea Res., 35, 639–663, 1988. 466,477
OSD
4, 459–489, 2007 Spectral studies of ocean water M. Vountas et al. Title Page Abstract Introduction Conclusions References Tables Figures ◭ ◮ ◭ ◮ Back CloseFull Screen / Esc
Printer-friendly Version Interactive Discussion
EGU
466
Morel, A.: Optical modeling of the upper ocean in relation to its biogeneous matter content (Case I waters), J. Geophys. Res., 93, 10 749–10 768, 1988. 467,474,481
O’Reilly, J. E., Maritorena, S., Siegel, D., O’Brien, M. C., Toole, D., et al.: Ocean color chloro-phyll a algorithms for SeaWiFS, OC2, and OC4: Version 4, in: SeaWiFS Postlaunch
Tech-5
nical Report Series, edited by: Hooker, S. B. and Firestone, E. R., SeaWiFS Postlaunch Calibration and Validation Analyses, Part 3, NASA, Goddard Space Flight Center, Green-belt, Maryland, 11, 9–23, 2000. 466
Perner, D. and Platt, U.: Detection of nitrous acid in the atmosphere by differential optical absorption, Geophys. Res. Lett., 93, 917–920, 1979.463
10
Quickenden, T. I. and Irvin, J. A.: The ultraviolet absorption spectrum of liquid water, J. Chem. Phys., 72, 4416–4428, 1980. 466,481
Rozanov, V., Diebel, D., Spurr, R., and Burrows, J.: GOMETRAN: A radiative transfer model for the satellite project GOME – the plane-parallel version, J. Geophys. Res., 102, 16 683– 16 696, 1997.466
15
Rozanov, A., Rozanov, V., Buchwitz, M., Kokhanovsky, A. , and Burrows, J.: SCIATRAN 2.0- A new radiative transfer model for geophysical applications in the 175–2400 nm spectral region, Adv. Space Res., 36, 1015–1019, 2005.466
Sathyendranath, S., Lazzara, L., and Prieur, L.: Variations in the spectral values of specific phytoplankton absorption. Limnol. Oceanogr., 32, 403–415, 1987.467,477
20
Sathyendranath, S. and Platt, T.: Ocean-color model incorporating transspectral processes, Appl. Opt., 37, 2216–2227, 1998. 465
Sathyendranath, S., Watts., L., Devred, E., Platt, T., Caverhill, C., and Maass, H.: Discrimination of diatoms from other phytoplankton using Ocean.-colour data, Mar. Ecol. Prog. Ser., 272, 59–68, 2004. 476
25
Sierk, B., Bracher, A., Richter, A., Vountas, M., Dinter, T., and Burrows, J. B.: Determination of phytoplankton concentrations from space-borne spectroscopic measurements, Conf. Pro-ceedings PORSEC, Gayana (ISSN 0717-652X), 68, 532, 2004.468,475
Smith, R. and Baker, K.: Optical properties of the clearest natural waters (200-800 nm), Appl. Opt., 20, 177–184, 1981. 467,481
30
Vassilkov, A. P., Joiner, J., Gleason, J., and Bhartia, P.: Ocean Raman scattering in satellite backscatter UV measurements, Geophys. Res. Let., 29, doi:10.1029/2002GL014955, 2002.
OSD
4, 459–489, 2007 Spectral studies of ocean water M. Vountas et al. Title Page Abstract Introduction Conclusions References Tables Figures ◭ ◮ ◭ ◮ Back CloseFull Screen / Esc
Printer-friendly Version Interactive Discussion
EGU
Vassilkov, A., Herman, J., Krotkov, N., Kahru, M., Mitchell, B., and Hsu, C.: Problems in asse-ment of the ultraviolet penetration into natural waters from space-based measureasse-ments, Opt. Eng., 41, 3019–3027, 2002b. 466
Vountas, M., Rozanov, V., and Burrows, J.: Ring effect: Impact of rotational Raman scattering on radiative transfer in earth’s atmosphere, J. Quant. Spectrosc. Radiat. Transfer, 60, 943–
5
961, 1998.468
Vountas, M., Richter, A., Wittrock, F., and Burrows, J. P.: Inelastic scattering in ocean water and its impact on trace gas retrievals from satellite data, Atmos. Chem. Phys., 3, 1365–1375, 2003. 461,462,463,465,467,468,474
Yentsch, C. S.: Measurements of visible light absorption by particulate matter in the ocean,
10
OSD
4, 459–489, 2007 Spectral studies of ocean water M. Vountas et al. Title Page Abstract Introduction Conclusions References Tables Figures ◭ ◮ ◭ ◮ Back CloseFull Screen / Esc
Printer-friendly Version Interactive Discussion EGU -0.01 0 0.01 0.02 0.03 0.04 0.05 0.06 300 350 400 450 500 550
Attenuation [1/m]
Wavelength [nm]
VRS Chlorophyll Liquid Water DOM ScatteringFig. 1. Absorption coefficients for phytoplankton (Bracher and Tilzer, 2001) (assuming a chlorophyll concentration of 0.1 mg/m3), DOM (Morel,1988), pure water (Buiteveld et al.,1994;
Quickenden and Irvin, 1980) and total backscattering (Smith and Baker, 1981) in [1/m], as
well as a VRS spectrum [without units] as defined in Eq. (2). Each of both dominant peaks in the VRS spectrum correspond to two strong CaII Fraunhofer lines in the solar spectrum. The values between 0.04 – 0.05 can be interpreted as filling-in of 4 – 5 % w.r.t to non-filled lines.
OSD
4, 459–489, 2007 Spectral studies of ocean water M. Vountas et al. Title Page Abstract Introduction Conclusions References Tables Figures ◭ ◮ ◭ ◮ Back CloseFull Screen / Esc
Printer-friendly Version Interactive Discussion EGU 28 30 32 34 36 38 40 42 44 46 8 12 16 20 24 28 30 32 34 36 38 40 42 44 46 8 12 16 20 24 -1.00 -0.93 -0.86 -0.79 -0.73 -0.66 -0.59 -0.52 -0.45 -0.38 -0.31 -0.24 -0.18 -0.11 -0.04 0.00 28 30 32 34 36 38 40 42 44 46 8 12 16 20 24 28 30 32 34 36 38 40 42 44 46 8 12 16 20 24 Fit factor -0.0144 -0.0120 -0.0096 -0.0072 -0.0048 -0.0024 -0.0000 0.0024 DOD 352 356 360 364 368 372 376 380 Wavelength [nm] -0.0033 -0.0022 -0.0011 0.0000 0.0011 0.0022 0.0033 0.0044 DOD 352 356 360 364 368 372 376 380 Wavelength [nm]
Fig. 2. Left: VRS fit factor for SCIAMACHY orbit 12429. Right: VRS fit for readout 2 of state 5
OSD
4, 459–489, 2007 Spectral studies of ocean water M. Vountas et al. Title Page Abstract Introduction Conclusions References Tables Figures ◭ ◮ ◭ ◮ Back CloseFull Screen / Esc
Printer-friendly Version Interactive Discussion EGU 0 1 2 3 4 5 6 7 8 9 10 11 0.001 0.01 0.1 1 10 100
VRS filling in [%]
Chlorophyllconcentration [mg/m
3]
OSD
4, 459–489, 2007 Spectral studies of ocean water M. Vountas et al. Title Page Abstract Introduction Conclusions References Tables Figures ◭ ◮ ◭ ◮ Back CloseFull Screen / Esc
Printer-friendly Version Interactive Discussion EGU -90 -60 -30 0 30 60 90 -180 -120 -60 0 60 120 180 -90 -60 -30 0 30 60 90 -180 -120 -60 0 60 120 180 -90 -60 -30 0 30 60 90 -180 -120 -60 0 60 120 180 -1.000 -0.875 -0.750 -0.625 -0.500 -0.375 -0.250 -0.125 0.000 Fit factor
OSD
4, 459–489, 2007 Spectral studies of ocean water M. Vountas et al. Title Page Abstract Introduction Conclusions References Tables Figures ◭ ◮ ◭ ◮ Back CloseFull Screen / Esc
Printer-friendly Version Interactive Discussion EGU 10 15 20 25 30 35 40 -35 -30 -25 -20 -15 -10 -5 0 10 15 20 25 30 35 40 -35 -30 -25 -20 -15 -10 -5 0 10 15 20 25 30 35 40 -35 -30 -25 -20 -15 -10 -5 0 0.0 0.5 1.0 1.5 2.0 2.5 3.0 3.5 4.0 4.5 5.0 5.5 6.0 6.5 7.0 7.5 8.0 Fit factor -0.003 -0.000 0.003 0.006 0.009 0.012 DOD 432 436 440 444 448 452 456 460 464 468 472 476 480 484 488 492 Wavelength [nm] -0.0021 -0.0014 -0.0007 0.0000 0.0007 0.0014 0.0021 0.0028 DOD 432 436 440 444 448 452 456 460 464 468 472 476 480 484 488 492 Wavelength [nm]
Fig. 5. Left: Phytoplankton fit factor for SCIAMACHY orbit 17712. Right: Phytoplankton fit fit for readout 214 of state 7 over upwelling (above) and readout 6 of state 7 over oligotrophic water (below).
OSD
4, 459–489, 2007 Spectral studies of ocean water M. Vountas et al. Title Page Abstract Introduction Conclusions References Tables Figures ◭ ◮ ◭ ◮ Back CloseFull Screen / Esc
Printer-friendly Version Interactive Discussion EGU -90 -60 -30 0 30 60 90 -180 -120 -60 0 60 120 180 -90 -60 -30 0 30 60 90 -180 -120 -60 0 60 120 180 -90 -60 -30 0 30 60 90 -180 -120 -60 0 60 120 180 0.0 0.5 1.0 1.5 2.0 2.5 3.0 3.5 4.0 4.5 5.0 5.5 6.0 6.5 7.0 7.5 8.0 Fit factor
OSD
4, 459–489, 2007 Spectral studies of ocean water M. Vountas et al. Title Page Abstract Introduction Conclusions References Tables Figures ◭ ◮ ◭ ◮ Back CloseFull Screen / Esc
Printer-friendly Version Interactive Discussion
EGU
OSD
4, 459–489, 2007 Spectral studies of ocean water M. Vountas et al. Title Page Abstract Introduction Conclusions References Tables Figures ◭ ◮ ◭ ◮ Back CloseFull Screen / Esc
Printer-friendly Version Interactive Discussion EGU 0.01 0.10 1.00 10.00 MODIS Chl-a [mg/m3] 0 2 4 6
SCIAMACHY Slant factor for phyto-abs.
0.01 0.10 1.00 10.00 MODIS Chl-a [mg/m3] 0.5 0.0 -0.5 -1.0 -1.5
SCIAMACHY slant factor for VRS
Fig. 8. Scatter plots, left: MODIS chlorophyll-a concentration vs. SCIAMACHY chlorophyll fitting factors for collocations in July 2005. Right: MODIS chlorophyll-a concentration vs. SCIA-MACHY VRS fit factors for collocations in July 2005.
OSD
4, 459–489, 2007 Spectral studies of ocean water M. Vountas et al. Title Page Abstract Introduction Conclusions References Tables Figures ◭ ◮ ◭ ◮ Back CloseFull Screen / Esc
Printer-friendly Version Interactive Discussion EGU −90 −60 −30 0 30 60 90 −180 −120 −60 0 60 120 180 −90 −60 −30 0 30 60 90 −180 −120 −60 0 60 120 180 −90 −60 −30 0 30 60 90 −180 −120 −60 0 60 120 180 0.050 0.075 0.100 0.150 0.200 0.250 0.300 0.350 0.400 0.475 0.550 0.625 0.700 0.900 1.100 1.300 1.500 3.000 10.000 30.000 Chl [mg/m3]