HAL Id: cirad-00168380
http://hal.cirad.fr/cirad-00168380
Submitted on 27 Aug 2007
HAL is a multi-disciplinary open access
archive for the deposit and dissemination of
sci-entific research documents, whether they are
pub-lished or not. The documents may come from
L’archive ouverte pluridisciplinaire HAL, est
destinée au dépôt et à la diffusion de documents
scientifiques de niveau recherche, publiés ou non,
émanant des établissements d’enseignement et de
To cite this version:
Vu Dinh Tuan, Vincent Porphyre, Jean-Luc Farinet, Tran Duc Toan. Composition of animal
ma-nure and co-products. V.Porphyre Nguyen Que Coi. Pig Production Development, Animal-Waste
Management and Environment Protection: a Case Study in Thai Binh Province, Northern Vietnam,
CIRAD-PRISE publications, pp.127-143, 2006. �cirad-00168380�
The fertilizing value of livestock waste is hardly determined considering its initial variability, the changes in the concentration of nutrients and sampling difficulties. Actual quantities of liquid effluents discharged into canals by local pig farms are also unknown. Original analysis methods for on-farm measurements of liquid waste outflows and Near Infrared spectrometry technique have been implemented to evaluate these two key factors.
Manure and Co-products
Animal manures and their co-products in
Thai Binh
The various observed states
Livestock farmers’ practices with regard to effluents management in Thai Binh province have been described previously in Chapter 5. These practices define the various forms of manure observed. Firstly there are several forms of non-treated manure, mainly generated by the way in which the farmer cleans his building.
Basic manure
The basic manure is a mixture of non-treated faeces and urine. A pig produces manure made up of 54% faeces and 46% urine by mass. The overall quantity of manure produced varies according to the kind of animal (boars/sows) and, for boars, varies according to their stage of development.
Scraped manure: a practice to be preserved
An extremely common practice in Thai Binh province is the scraping of faeces produced by animals before the buildings are cleaned with water. Depending on the scraping method, the product obtained is more or less humid. In Chapter 5 we put forward the hypothesis that the farmer recovers 95 % of faeces produced and 60 % of urine. The farmer can store the scraped manure obtained before use, or can use it fresh daily. When he stores it, it loses water (through evaporation and leaching) and it becomes drier. Scraped manure, drier than basic manure, is easier to transport. Manure is often used in this form by fish farmers, but it can also be treated. When it is exchanged, manure is mainly in this form.
The quantity of solid waste can be estimated with the classical ratio of 0.05 kg per kg of live weight per day,
kg per day; post-weaning pig (8-30 kg): 1.5 kg per day; fattening pig (30-110 kg): 6 kg per day. But these gross ratios do not take into account the particulari-ties of pig breeds or feeding management, the losses of urine during the day and also the losses at the time of scraping.
Liquid effluents: a real preoccupation
As often observed in tropical countries, a lot of water is used to clean the concrete floor of farm buildings and also to cool the animals in the hot season. In our observations, the quantity of water used in such small pig farms varies from 75 litres/head/day on the island of Tahiti to more than 100 litres/ head/day in Southern Vietnam (3).
After buildings have been cleaned, 5% of faeces and 40 % of urine remain on the concrete floor and are then evacuated with the cleaning water. The effluent obtained is sometimes used on the farm, but more often is discharged into the village’s canals or into a river. The quantity of water used varies according to the farmers’ practices, but above all according to the season. Depending on the quantity of water used for cleaning, the concentration of nitrogen and phospho-rous in the effluent varies as well. During the winter, farmers clean less frequently, on average once every two or three days, because the outside temperature is more comfortable.
Urine
Animal urine is usually mixed with faeces and with cleaning water. Some farmers interviewed have invented an ingenious system to isolate pure urine. This enables the recovery of urine without it being mixed with cleaning water. This therefore makes it possible to concentrate the fertilizing values of urine in a reasonable volume; for example, with the help of bamboo poles split into two that deviate the urine
Determining the fertilizing value of livestock waste is made difficult by its initial variability, the changes in the concentration of nutrients and sampling difficulties. With the aim of treating the waste, a better know-ledge of the effluent’s composition enables a more precise determination of the size of the treatment unit (1). Certain references, gathered and/or calculated (2), have been used in the other chapters of this work; however it was necessary to evaluate the variability of the chemical composition of composts and slurry used by the farmers of Thai Binh, taking advantage of these results to develop a prediction technique with near infrared spectrometry. Given the large quantity of liquid discharges and the difficulty these very diluted pollutant products, the second practical question addressed in this section deals with evaluation of actual quantities of liquid effluents discharged into canals by local pig farms.
Co-products and treatment processes
Mixing with waterOne of the farmers interviewed stores his fresh manure in a pit where he mixes it with water and waits several days before using it. More often, the scraped manure is remixed with water after storage. When scraped manure is stored for a long time, it dries out. To be able to use it, some farmers resort to a quick solution: they mix it with water to dampen it. This product is there-fore similar to fresh scraped manure, but it must be less concentrated in nitrogen or phosphorous (loss by evaporation and dilution). It can then be used in fish farm ponds.
“Mixed” manure
Scraped manure remains as it is when it is transferred to another farming operation. On the other hand, when it is stored on the farm, it is usually mixed with ashes or lime. This mixture averts an excess of strong smells next to the place of dwelling; buildings are often near the farmhouse, or near to neighbouring dwellings. In addition, this air purification improves the hygienic conditions in the dwelling place. Farmers have a sto-rage place for scraped manure: this can simply be a hole dug in the ground, or a pit made from bricks and cement, or a former pig or chicken pen converted into a pit. At the time of cleaning, scraped manure is brought there and covered with a layer of ashes or lime. This covering is carried out daily, the mixture can there-fore be considered as being a homogenous one. “Mixed” manure is appreciated by users because the lime increases the pH while lowering the olfac-tory nuisance and making it more hygienic, and the ashes add potassium while making spreading easier. Less concentrated, it is therefore less dan-gerous for crops and helps improve the soil struc-ture. The mixture also helps therefore to improve the quality of the manure. Its transport is also simpler than that of liquid manure. Farmers do not see any inconvenience to the use of manure in this mixed form. According to a fish farmer, the act of mixing manure with lime makes it lose nutrients. The fish yield is therefore lower than with fresh manure.
Traditional manure
Traditional manure is the product obtained in tional Vietnamese livestock buildings. In the tradi-tional building, there is no real separation between the place where the pigs live and the pit containing the effluents. Sows or boars live on a small concrete
surface and have direct access to the pit, which is on a lower level. Faeces and urine fall directly into this pit, where the farmer often adds rice straw that serves as a litter for the animals, and sometimes adds leaves, grass, or household waste. With this kind of building, a farmer rarely cleans it with water. The bottom of the pit can be made of earth, in which case the liquid effluents can leach and escape into the ground, or it can be concreted over or covered with bricks and cement, in which case it is considered that the liquid effluents are contained in the pit. In this kind of buil-ding, the manure gradually decomposes for months. In general, it is left in the pit for six months or a year. It is not mixed by hand, but as the farmer adds straw every day, and the pigs mix it by trampling or lying on it, it can be considered that treatment takes place in an oxygenated environment.
“Composted” manure
Composted manure can be of several kinds after a long or short treatment, but the basis of the product in both cases is more or less humid scraped manure. Short treatment is carried out beside the fields, a few months before the start of a crop cycle. The farmer digs a hole and mixes it in with other elements (straw, rice husks, ashes, lime, etc.) added in variable quanti-ties. It is then all covered with a layer of mud, or a tar-paulin, in order to avoid too great a deterioration of the product by the natural elements (sun, rain, etc.). Moreover, the farmer does not touch this pile again during the whole treatment process. This is therefore an anaerobic environment, which limits the loss of nitrogen during this treatment.
The long treatment is carried out in storage pits. The farmer stores solid scraped manure there and adds some other elements, variable depending on his indi-vidual practices. In general, rice straw makes up a large proportion of the volume. The environment being more aerobic, and the waiting time longer, it can be logically inferred that the nitrogen reduction is greater than in the previous treatment process. No data is available to compare these two nitrogen contents.
Biogas effluents
The final treatment by fermentation is more and more prevalent on medium-sized and large farms. Biogas technology (the biogas digester (Chinese model)) is strongly encouraged by the local authorities. Putting manure into this kind of digester gives two kinds of product: a liquid effluent, in large quantities, that still contains large amounts of fertilizing agents, and solid
waste (a dry, sandy substance easy to transport and spread) to be evacuated with a variable frequency (an order of several years) depending on the volume of the digester and the number of pigs raised.
The liquid manure’s flow is often collected in a concrete channel or a plastic pipe and supplies a Chinese biodi-gester. At this stage, it is very important to remember that anaerobic digestion does not constitute a
treat-ment of pollution as such. Indeed, this technique only makes it possible to break down part of the organic load, the mineral components (nitrogen, phosphorus) being entirely preserved. On some pig farms, the liquid manure is discharged directly towards a river: this cre-ates a muddy and insalubrious area behind the live-stock building; or the manure is discharged directly through a pipe into a nearby river.
The main constraint for a proper slurry management is the high level of dilution and the corresponding low concentration of nutrients. In the studies conducted in other projects, the dry matter (DM) concentration was mostly below 1% (in Europe values of 3-12% are common). This is due to the large amount of water used for cleaning, flushing out the manure and partially for cooling the animals. The strongest dilution of below 0.5% has been found on farms without in-house se-paration of manure and use of hoses to cool off
ani-mals (3). Therefore, the objectives in this paper are to quantify the real outflow of liquid effluents to be con-sidered in balance calculations at the farm and regional levels in Vietnamese conditions. A second objective aims to analyze the variability of the chemical compo-sition of a local dataset considering the highly hetero-geneous wastes and by-products used on crops; near infrared spectrometry is also introduced here to eva-luate the feasibility of a rapid technique applied to animal wastes.
Box 1: The Chinese digester, more commonly called biogas digester
The biogas digester cannot be considered as a technique for treating organic matter, because it does not reduce the polluting fertilizing agents contained in organic matter. In fact, in the liquid effluent that comes out of a biogas digester, 95% of nitrogen remains and all of the phosphorous that was present initially. Its main appeal is the production of methane, a source of energy, and the significant reduction in volume of manure, by digestion of organic matter, of which 55% remains after digestion.
It consists of two pits: a digester and an outlet pit between which pressure is equalized. In the digester, organic matter is fermented in an anaerobic environment: this results in solid sandy waste that remains at the bottom of the digester, and liquid waste continually being dispatched into the outlet pit. The Chinese digester’s products are: gas, a usable source of energy despite having a strange smell, and light-coloured, odourless effluents. When used for cooking, the savings in coal can reach 35%. On pig farms using a biogas digester, after it has installed, liquid manures are always discharged into ponds of which only some of them could be qualified as “fish ponds”. Indeed, if the pond is too small in relation to the liquid manure flow, all the fish are long dead and it is more of an overloaded sewage lagoon. When the fishpond size is sufficient, with an area of more than 12 m2per pig, the water is clear without apparent signs of eutrophication or fish
mortality. It should be pointed out here that these effluents are carrying their full quota of fertilizing and poten-tially polluting substances.
Materials and methods
Taking into account the preceding observations and expected results, it was decided to carry out two char-acterization studies: the first one concerned the quan-tification of liquid manure and solid waste discharged out of ten selected pig farms, and the second one con-cerned the composition variation of solid co-products (compost and fish food).
Characterization of effluent outflows and water
use
Measurements gave the effluent production rates. They consisted of weighing the quantity of solid waste and the quantity of liquid manure produced in one day. In addition and to account for seasonal effects, measure-ments and samples were carried out on 10 pig farms during warm and cold seasons in two districts: Vu Doai and Vu Tien (Vu Thu district), Dong Dong and Dong Kinh (Dong Hung district). The first monitoring was carried out from September 9th to October 6th 2005; the second was in the middle of December 2005. On each farm, firstly before the pen was cleaned, the number and type of pigs in each pen was identified. When farmers scraped manure separately, the team weighed manure from each pen as fresh weight. Scraped manure was put in one bucket from the first to last scraping time within one day, and all scraped manure was mixed well for sampling. A 1 kg final sample was put into a plastic bag.
After scraping manure, farmers washed pens with
pumped water or a bucket. Among the ten selected farms only one used buckets to clean the pen. The total washing water was calculated based on the index of the water flow meter throughout pen cleaning; liquid samples were taken every minute at the pig-shed’s sewage outfall. Pen cleaning time depended on the farmer’s experience. One litre sub-samples were col-lected. Based on the proportion of the volume of wash-ing water within a day for several times, the final sam-ples were homogenized from collected sub-samsam-ples. The final sample had 1 ml concentrated HCl added (67%), was labelled, stored in a cool box and analyzed in the NISF laboratory.
On-field composts and fish food sampling
66 compost samples were taken in total, of which 46 were compost and 20 were fresh manure from 4 dis-tricts (Dong Hung, Vu Thu, Quynh Phu, and Thai Thuy) during warm season (June-July 2005). Details are dis-played in Table 1.
Our database, gathering manures and composts, shows a huge variability in terms of characteristics and compositions. Among the 66 samples, 35 were mixed with rice straw, 12 with rice husks, 14 with green grass; ashes (n=8) and lime (n=9) were also added to improve the mineral content and to make the compost more hygienic depending on farmers’ practices. The time of maturation on the farm and in the fields before appli-cation on crops are highly heterogeneous (CV=0.84; mean=3.3 months) and can be as much as 6 months on the farm and 60 days in the field (mean=5 days), stored in a pit and covered with a tarpaulin or with mud.
Table 1: Distribution of compost and fresh manure samples taken in Thai Binh
District Dong Hung Vu Thu Quynh Phu Thai Thuy Total No of communes 4 4 4 4 16 No of samples 17 16 17 16 66 Compost 12 10 12 12 46 Fresh manure 5 6 5 4 20
20 samples of animal excreta were used for fish, of which 18 samples were solely pig manure; one was duck manure and the other was pig manure mixed with goose and chicken manures. Only three out of the 18 had added rice husks and/or lime. Two of 20 animal excreta were composted for ten days before spreading for fish. Among the 20 surveyed farms that used animal waste for fish, farmers applied 0.55-6.7 kg fresh pig manure per sao (360m2) in a day, one applied 0.1 kg of duck manure per sao in a day. Urine was used for fish-ponds as well.
The remaining 46 manure samples were used for crops, one was chicken manure, one was cattle manure, six were cow mixed with pig manure and the most popu-lar types were 38 pig manures. Farmers normally added rice straw with animal manure (can be called farmyard manure –FYM or compost), other possible materials used were rice husks, grass, ash, lime, chemical ferti-lizer, even water ferns. Most of the farmers stored the waste during 6 months in their home garden before car-rying it to the fields.
The composts were carried to the field and heaped up; the heaping time on the field is strongly dependant on each individual farmer; the survey showed that only 5 farmers out of 23 did so for more than 15 days on the fields before spreading it. For the storage method at field, 28 farmers covered the wastes, of which 12 co-vered it by 5 means: 6 with mud, 2 with packing cases, 2 with rice straw, 1 with grass, 1 with plastic bag and rice straw. Most farmers applied animal manure on paddy rice in the summer season. Only 2-3 farmers used it for pumpkins or garlic. The land spread varied from 0.3 to 12 sao with quantity normally used from 133 to 750 kg (in fresh weight) per sao, equal to 3.7-20.8 ton per ha.
Laboratory analysis methods
Classical methodsAll the soil, plant and fertilizers (organic or inorganic) were analyzed according the Standard Manual for laboratory analyses of National Agricultural Branch No 10TCN 301-97- MARD, Hanoi, Vietnam: pH was measured by pH meter in compost-water. Compost and pig manure samples were dried at 1050C for 6-8 hours until the samples reached stable weight to determine humidity. Organic matter was analyzed using the Walkey Black method. To determine total nitrogen, phosphorous and potassium content, the compost and manure samples were digested with HNO3+HCl (ratio 1:3), N total (%) was determined using the Kjeldahl method; the solution had molybdate vanadate added, and P2O5 (%) was analyzed using a spectrophotometer at 420 nm; K2O total was determined using atomic absorption spec-trophotometry at 768 nm (AAS). Ammonium (N-NH4) in samples was analyzed using Kjeldahl method, after addition of HCl 0.05 N (ratio 1:20).
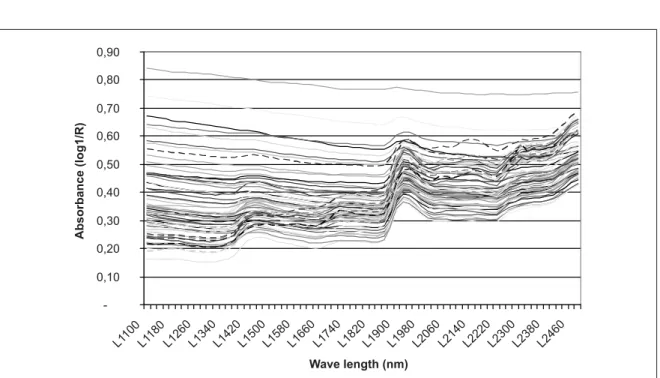
NIR spectra acquisition
Two replicates of each sample (dried at 45°C, <1mm ground) were packed in circular cups (50mm diame-ter) sealed with paperback and then scanned (area scanned about 20 mm diameter) in reflectance mode on a monochromator spectrometer (NIRS 5000; Foss NIRSystems, Silver Spring, MD, USA). Spectral data were collected every 2 nm from 1100 to 2498 nm. The spectra (average of 32 scans) were recorded as a log (1/reflectance). Each sample was scanned twice (two different cup fillings) and the spectra were averaged. Spectra (Figure 1) were transformed by mathematical treatments according to the WinISI software (Infrasoft International, Port Matilda, PA, USA) (4).
Box 2: Description of the NIRS technique
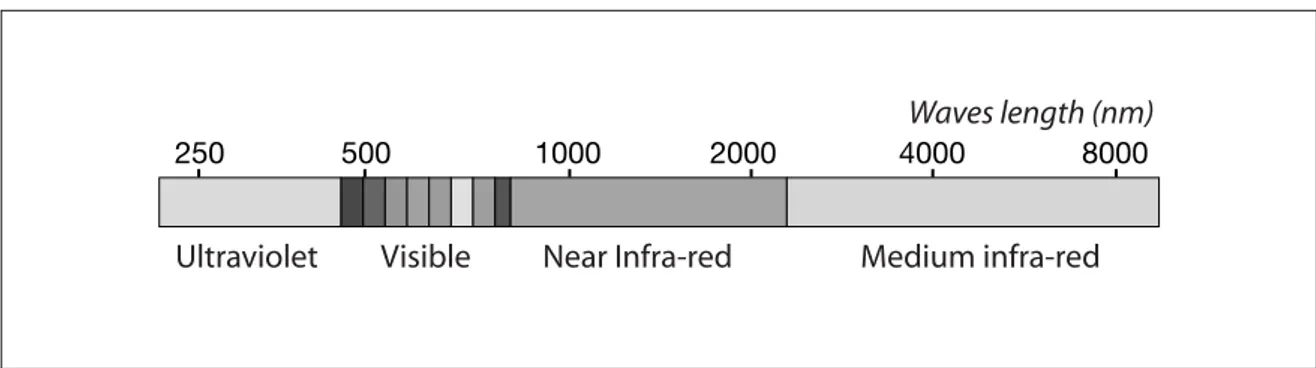
Near Infrared Spectroscopy (NIRS), enables rapid and non-destructive dosages of organic components of matter. The spectroscopy is based on the property of organic molecules to absorb energy. In the near infrared technique, the energy is a beam of light whose wavelengths are between 800 and 2,500 nanometres. Most organic substances absorb energy in the near infrared. We can quote as an example the main components of the animal and plant worlds: water, proteins, fatty matter, carbohydrates and fibres. Each of these components has a particular and unique signature in the near infrared.
In practice, these components are found together and the spectrum of a sample is the sum of all the elementary absorptions. Spectroscopy in the near infrared is an indirect method.
Before any analysis, the instrument must be calibrated. The first step of this calibration consists of measuring on the instrument several tens or even several hundreds of representative samples of a given product whose various parameters have been quantified by reference methods. The second step of this calibration concerns the optimization of a mathematical model that links the optical data to analytical reference values. Once cali-bration is completed, the predictive model could be used for mass analysis.
Initially devised for water dosage and content, spectroscopy has much improved and now makes it possible to make accurate dosages of a large number of organic components. The current economic context encou-rages agriculture, but also the processing industry, to produce higher quality, rather than higher quantity. With NIRS, this concept of quality must be considered in a new light. Most applications concern the measurement of intrinsic or nutritional quality linked to the composition of the foodstuff and its digestive use. We can give the examples of cereals, oleaginous and legume grains, vegetables, fruits, dairy products, drinks, fodder, mixed feed and meats. The principal components are moisture, proteins, fibres, fatty matters but also amino acids, alcohol, tannins and also more general aspects such as the digestibility of foods. This technique has several advantages:
- It is rapid: a few minutes (instead of a few days with the classical methods) suffice to collect the absorp-tion spectrum of a sample that will serve to predict its composiabsorp-tion. Compare this with the very long time taken for a chemical composition analysis!
- It is non-destructive: the sample is recovered intact after analysis. This property is especially important for very scarce samples or for ones that must be kept for further analyses
- 4 to 5 grams are enough! It does not require a large quantity of samples. In certain conditions spectra can be carried out on extremely small quantities: less than one gram of sample or even one single grain (which is useful in plant genetic studies). The main limit to the reduction of quantities is the obtaining of the sample representative of the product to be analyzed (food, fodder).
- It is cheap: apart from the initial investment in the instrument and the making of calibrations for each pro-duct, the cost of obtaining readings for each sample is very low. One must simply make sure to have some reference analyses in the laboratory to check that the calibration remains correct over time and is well adjusted to new samples. About 10% of these control analyses are generally carried out.
Results and discussions
Liquid waste flow and composition
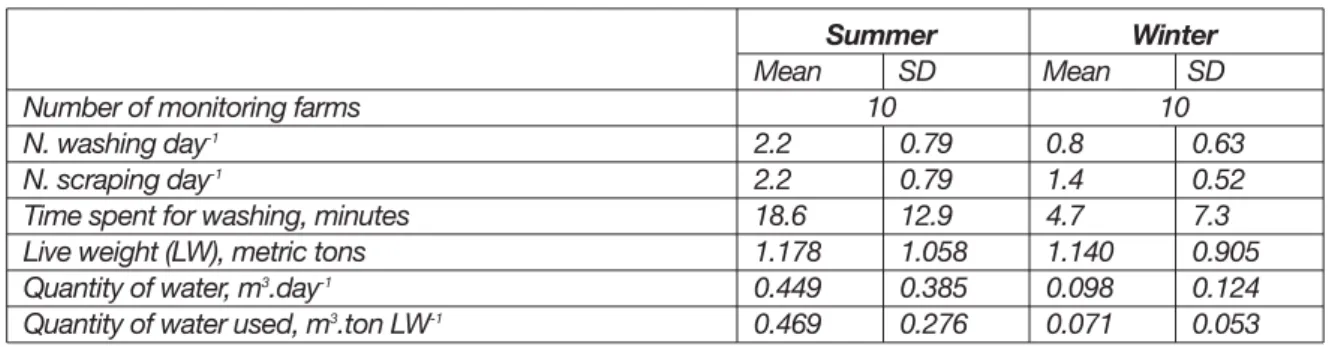
Solid and liquid quantificationDuring the warm season, the frequency of cleaning on each farm varied from 1 to 4 times a day, but most farms (seven out of ten) cleaned twice a day. Among the remaining three farms: one farmer scraped pig manure and washed pig pens only once a day, another one did it three times and the other did it four times. Farmers explained that in the hot season water is used not only for cleaning pens but also for coo-ling the pigs down. Except for one farmer using a bucket, the nine other farmers used electric pumps to clean pens. The volume of water used for cleaning corresponds not only to the number of pigs or pig type but also to farmers’ experience and pen condi-tion. On average, farmers washed and scraped 2.2 times per day; the quantities of wastewater were 0.449 m3 during warm days, corresponding to 0.469 m3 for a metric ton of pig live weight (LW).
Ten selected farms in summer were surveyed again during the winter of 2005, with a different pig stock to that in summer. With temperatures of 12-18°C, the farmers spent less time on scraping and washing than in summer (on average per day: 1.4 times for scraping; 4.7 minutes for washing). Four farmers scraped twice a day, but six others scraped once a day. To avoid adverse effect from cold water on pigs at low tempe-rature in winter, only seven out of ten farms cleaned their pens. However, they did not clean pens for piglets and Mong Cai sows on cold days. Quantities of wastewater were less than those in summer (0.098 m3 on a cold day or 0.071 m3 for a metric ton of pig LW), (Table 2). Surveys showed on the ten farms that, in general, the quantity of pig excreta in the cold season was higher than that in the warm one (table 3).
Crossbred sows produced 3 kg per day per head in the cold season but in the warm season only 2 kg. Mong Cai sows produced 1.64 kg per head per day in the
warm season, this amount increasing to 3.9 kg per head per day on average in the cold one. That was due to some farmers who raised Mong Cai sows scraping every two days, and also Mr. Chan who scraped every three days, explaining why manure accumulated around the farm during winter.
For exotic sows, manure collected from 17 exotic sows on farm T10 was 0.94 kg per head in summer, but in winter dramatically increased to 1.79 kg per head per day. One piglet excreted about 0.25 kg/day/head during warm season but 0.68 kg/day/head on a cold day.
Fatteners weighing 25-50 kg and fatteners weighing more than 50 kg excreted 0.60 kg and 0.65 kg/head/on a hot day respectively, but on a cold day this increased to 0.75 and 1.00 kg per head respectively. The results of this study differed from the results of the study in Hungary, where faeces from fattened pigs, 20–220 days old, was 3.0-3.4 kg per day, for a sow (one-year average) it was 7.5-8.5 kg per day, for a piglet (30–60 day old) and a young pig (one-year average) it was 0.9-1.4 and 4.0-6.0 kg per day respectively (5). Nevertheless, the quantity of the waste largely depended on the quality and quantity of food and drink. Comparing with recent studies in Thailand, data from the NuFluxAWI model showed a larger amount of pig excreta, 2-6.5 kg per head per day; however, dry matter constituted only 10-12%, implicating a slurry state of pig excreta. This study agreed with data from Le Van Can (1975) (6) which showed the amount of pig excreta was around 1.5-3 kg per head per day with humidity of 66%.
In terms of quantity of pig waste generated (in fresh weight) per metric ton of live weight per day (kgPW.tonLW-1), the mean of ten monitored farms was 14.86 kg of pig waste per metric ton of pig live weight with a standard deviation of 6.96 on a warm day while it reached 24.05 of pig waste per metric ton of pig live weight with a standard deviation of 16.73 on a cold day (Table 3).
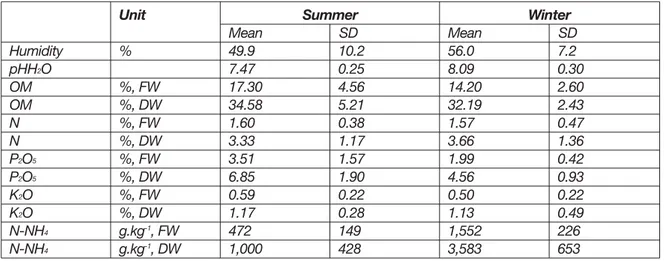
Solid and liquid compositions
The slurry collected on ten farms contained almost 50% of water (with a SD of 10.2) in the warm season and 56% in the cold season (a SD of 7.2). Content of the main constituents in fresh weight (FW) in the warm season were: 17.30% OM total, with a SD of 4.56. N, P2O5 and K2O totals in fresh weight (FW): 1.60%, 3.51% and 0.59% respectively. Those constituents in FW in the cold season were: 14.2% OM total, with a SD of 2.6. N, P2O5 and K2O totals in FW: 1.57%, 1.99% and 0.50% respectively. It seemed that three elements, N, P, and K in solid flow during summer were higher than those during winter (Table 4).
Considering the high phosphorus content in solid manure during the warm season, 100 kg of solid manure is equivalent to 25kg of super-phosphate in terms of P2O5 content. It is necessary to consider the
adverse effects of phosphorus on the environment, because phosphorus is more persistent whereas nitro-gen and potassium show relatively short-term accu-mulations.
Pig excreta contained 472 mg N-NH4 per kg fresh weight while dry excreta contained 1,000 mg N-NH4 in samples taken in summer, while those figures in winter were 1,552 mg.kg-1FW, 3,583 mg.kg-1DW (Table 4).
Liquid outflow contained in total 20.6 mg N, 226.8 mg P2O5 and 3.0 mg K2O in one litre in the warm season, 155 mg N, 61 mg P2O5 and 241 mg K2O in a litter in the cold one (Table 5).
We could draw an issue that phosphorus in liquid flows during summer was less than that during winter.
Table 2: Liquid flow on ten pig farms in Thai Binh
Number of monitoring farms N. washing day-1
N. scraping day-1
Time spent for washing, minutes Live weight (LW), metric tons Quantity of water, m3.day-1
Quantity of water used, m3.ton LW-1
2.2 2.2 18.6 1.178 0.449 0.469 0.79 0.79 12.9 1.058 0.385 0.276 0.8 1.4 4.7 1.140 0.098 0.071 0.63 0.52 7.3 0.905 0.124 0.053 Summer Mean SD 10 Winter Mean SD 10 SD: Standard deviation LW: Live weight FW: Fresh weight
Table 3: Solid flow on ten pig farms in Thai Binh (kg manure in FW per metric ton LW-1)
Quantity of manure in FW, kg. metric ton LW-1
Sow F1 Mong Cai sow Exotic sow Piglet Fattener 1 Fattener 2 10 farms 1 5 17 51 91 64 6.96 -0.94 -0.14 0.24 0.23 14.86 2.00 1.64 0.94 0.25 0.60 0.65 24.05 3.05 3.90 1.79 0.68 0.75 1.00 16.73 1.48 0.61 1.33 0.56 0.26 0.52 10 farms 2 4 18 81 45 82 Summer Mean SD N. Winter Mean SD N. SD: Standard deviation
N.: Number of pigs, except where indicated LW: Live weight
On the contrary, nitrogen and potassium in liquid flow during winter was higher than during summer.
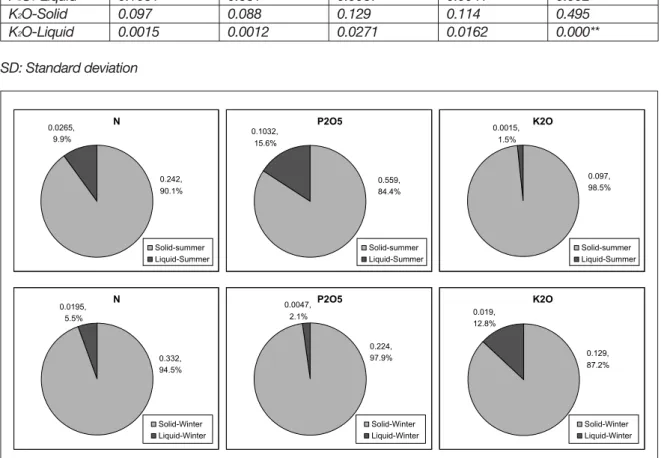
The quantity of nitrogen, phosphorous and potas-sium generated in pig waste
Solid waste contributed the most nitrogen, phospho-rus and potassium in total generated waste. On ave-rage, raising pigs in the warm season discharged 0.269 kg N, 0.662 kg P2O5 and 0.099kg K2O per metric ton of pig live weight present on the farm, of which the liquid part correspondingly contributed 9.9%, 15.6%
and 1.5%. Raising pigs in the cold season discharged 0.352 kg N, 0.229 kg P2O5 and 0.148 kg K2O per metric ton live weight of which the liquid part con-tributed 5.5%, 2.1% and 12.8% (Table 6 and Figure 2). When comparing the quantity of macronutrients ge-nerated between the two seasons, it was found that P2O5 in liquid outflow was significantly higher in summer than in winter (p=0.002). But K2O in liquid out-flow in summer was significantly lower during summer than during winter (p<10-4) (table 6 and Figure 4).
Table 4: Chemical characteristics of solids (ten samples from ten pig farms)
Humidity pHH2O OM OM N N P2O5 P2O5 K2O K2O N-NH4 N-NH4 Unit % %, FW %, DW %, FW %, DW %, FW %, DW %, FW %, DW g.kg-1, FW g.kg-1, DW 49.9 7.47 17.30 34.58 1.60 3.33 3.51 6.85 0.59 1.17 472 1,000 10.2 0.25 4.56 5.21 0.38 1.17 1.57 1.90 0.22 0.28 149 428 56.0 8.09 14.20 32.19 1.57 3.66 1.99 4.56 0.50 1.13 1,552 3,583 7.2 0.30 2.60 2.43 0.47 1.36 0.42 0.93 0.22 0.49 226 653 Summer Mean SD Winter Mean SD SD: Standard deviation FW: Fresh weight DW: Dry weight
Table 5: Chemical characteristics of liquid outflow (ten samples from ten pig farms)
pHH2O OM N P2O5 K2O N-NH4 Unit mg.l-1 mg.l-1 mg.l-1 mg.l-1 mg.l-1 6.20 990 20.6 226.8 3.0 60.5 1.63 429 9.8 79.0 0.8 41.5 7.1 786 155 61 241 197 0.4 588 145 30 105 106 Summer Mean SD Winter Mean SD SD: Standard deviation
Table 6: The quantity of nitrogen, phosphorous and potassium generated in pig waste
(kg N or P2O5 or K2O per metric ton live weight in a day)
Source N-Solid N-Liquid P2O5-Solid P2O5-Liquid K2O-Solid K2O-Liquid 0.242 0.0265 0.559 0.1031 0.097 0.0015 0.139 0.0223 0.570 0.681 0.088 0.0012 0.332 0.0195 0.224 0.0067 0.129 0.0271 0.168 0.0190 0.187 0.0041 0.114 0.0162 P 0.210 0.462 0.094 0.002** 0.495 0.000** Summer Mean SD Winter Mean SD SD: Standard deviation
Figure 2: The quantity of nitrogen, phosphorous and potassium generated in pig waste
(kg N or P2O5or K2O per metric ton live weight in a day).
Figure 3: Phosphorous from liquid outflow
(kg P2O5or K2O per metric ton live weight in a day).
Figure 4: Potassium from liquid outflow
Solid waste, Compost and fish food
composi-tion
Classical analyses for compost and animal waste as fish feed
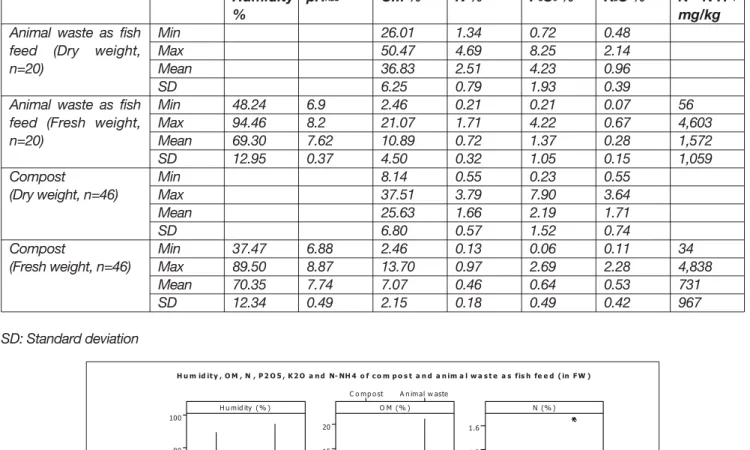
Humidity of both compost and animal waste as fish feed varied greatly (37-90% and 48-94% respectively). Nutrient contents in two dry and fresh states of both
animal waste as fish feed and compost showed that in the fresh one contains lower N, P, and K than the dry. On average, animal waste as fish feed contains 0.72 %N, 1.37 P2O5and 0.28% K2O; compost
con-tains 0.46 %N, 0.64 P2O5 and 0.53% K2O (fresh
weight), (Table 7). Figure 5 shows the variation of humidity, K2O, P2O5, N-NH4 (in FW) of compost and
animal manure as fish feed.
Table 7: Characteristics of compost and animal waste as fish feed
Animal waste as fish feed (Dry weight, n=20)
Animal waste as fish feed (Fresh weight, n=20) Compost (Dry weight, n=46) Compost (Fresh weight, n=46) Min Max Mean SD Min Max Mean SD Min Max Mean SD Min Max Mean SD Humidity % 48.24 94.46 69.30 12.95 37.47 89.50 70.35 12.34 pHH2O 6.9 8.2 7.62 0.37 6.88 8.87 7.74 0.49 OM % 26.01 50.47 36.83 6.25 2.46 21.07 10.89 4.50 8.14 37.51 25.63 6.80 2.46 13.70 7.07 2.15 N % 1.34 4.69 2.51 0.79 0.21 1.71 0.72 0.32 0.55 3.79 1.66 0.57 0.13 0.97 0.46 0.18 P2O5% 0.72 8.25 4.23 1.93 0.21 4.22 1.37 1.05 0.23 7.90 2.19 1.52 0.06 2.69 0.64 0.49 K2O % 0.48 2.14 0.96 0.39 0.07 0.67 0.28 0.15 0.55 3.64 1.71 0.74 0.11 2.28 0.53 0.42 N - N H4 mg/kg 56 4,603 1,572 1,059 34 4,838 731 967 SD: Standard deviation
Characterization of the population for the
establishment of a model
The number of samples studied (#Samples), the ave-rage (Mean) and the standard deviation (SD) describe the samples used to establish the predictive calibra-tions from the spectra. It is generally considered that a calibration must be based on a minimum of 60-100
samples, depending on the nature of the matter stu-died. However, the smaller number of samples made for the study here (30-50) make a “feasibility study” possible of NIRS prediction for the product “farm fer-tilizer of animal origin”. Nevertheless, the population studied being a very variable one; this reinforces the robustness of the calibrations.
Table 8: Composition of composts (n=66) and NIRS predictive equation
Constituent Moisture pH OC Nitrogen P2O5 K2O NH4 NH4K #Samples 56 60 60 57 61 57 58 58
Population Regression Validation Mean 72.53 7.73 28.89 1.79 2.68 1.40 81.17 291.85 SD 10.27 0.46 8.17 0.56 1.82 0.63 83.77 281.43 SEC 8.07 0.21 3.49 0.13 0.41 0.22 25.07 154.71 RSQ 0.38 0.80 0.82 0.94 0.95 0.87 0.91 0.70 SECV 10.27 0.28 3.90 0.18 0.69 0.39 30.57 177.39 RPD 1.00 1.64 2.10 3.16 2.66 1.60 2.74 1.59 N: Number of samples SD: Standard deviation
SEC: Standard error of calibration RSQ: Coefficient of correlation SECV: SD error of cross-validation RPD = SD/SECV
Figure 6: Absorbance spectra of materials among the total samples set (n=66),
Classification of samples
The classification of samples after the principal com-ponent analysis (PCA) did not show any structure in the dataset; the cloud of dots given by the first 3 compo-nents shows no clear structure on the three principal axes (Figure 7) and therefore does not permit a diffe-rentiation of the samples by product type, maturation time on the farm or in the fields.
Coherence of samples in relation to existing data-bases
The principal component analysis (PCA) applied to our samples has been compared with existing several datasets at the CIRAD and gathered from more than 10,000 samples from various environments and origins (litters, animal manures, composts collected in Europe and Africa). Our original dataset of 66 samples was partially distinct with other types of products; therefore, a deeper analysis would be justified to complete the information according to the observed situation in the
Red River Delta. As a consequence, it is important not to base recommendations for fertilization only on inter-national norms and to actively take into account these important local differences.
Predictive equations
A calibration is a linear regression between the cha-racteristics of samples (content levels of chemical components, etc.) and “infrared” information (values of light absorbance at different wavelengths). The inter-pretation of results then uses “classical” statistical cri-teria to assess the quality of an equation of linear regression. Knowledge of the principal characterisa-tion criteria of models makes it possible to rapidly assess the quality of calibrations presented. Three groups of supplementary information are presented in the table 8 describing the calibration of parameters for composition of our 66 samples of composts and fresh manures: the characterisation of the population on which the model was established, the quality of the regression, and its validation, meaning the evaluation of the precision that will be obtained at the time of practical use of the calibration.
SEC (standard error of calibration) and RÇ (coefficient
of correlation) are indices of the precision calibrations and the adjustment of data. A “good” calibration model has an SEC close to the reference analysis. The SECV (standard deviation error of cross-validation) is an indication of the precision with which the calibration model will be able to predict new samples. The SECV measures this capability from samples of the popula-tion for the establishment of the calibrapopula-tion. It must have a value as close to the reproduction of the refe-rence analysis as possible. The RPD is the ratio between the variability of the population (standard deviation) and the precision of the calibration (SECV). This ratio is therefore an indication of the information provided by the model. A model is generally consi-dered interesting starting from RPD=3-4 and very good above 6; but this assessment must take into account the variability of the base population and the precision of the reference measure.
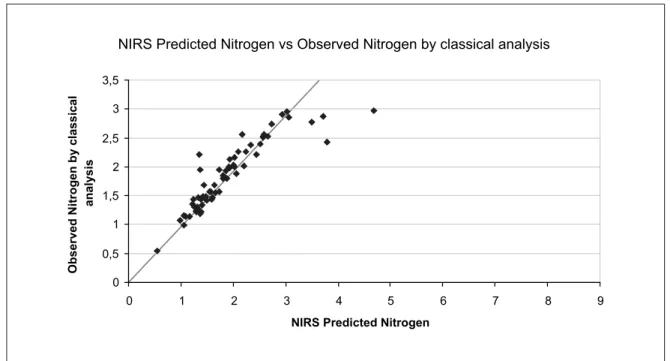
Here, the quality of the regression represented by the prediction~value graphs observed for the parameters Nitrogen (N), Phosphorous (P2O5) and Potash (K2O)
appear to be reasonable (R2 of 0.94, 0.95 and 0.87). The predictions concerning the elements P2O5 and
K2O could do with more work on them however. The predictions for the other parameters remain poor, in
Figure 8: NIRS Predicted Nitrogen vs. Observed Nitrogen by classical analysis
Conclusion
Quantity of animal solid waste per pig head in the cold season is higher than that in the hot season. Pen cleaning time in summer is much more than that in winter (2.2 times compared with 0.8). The volumes of water (used for cleaning operations) were established depending on the pig live weight. During the hot season, farmers used 0.469 m3 for a metric ton of pig live weight; in the cold season, only 0.071 m3 is used for a metric ton of pig live weight. On average, the moisture of the solid part in pig excreta that farmers scraped was 49.9 % with a standard deviation of 10.2. Moisture of pig excreta (can be expressed as a ‘slurry’ state and used as fish feeding or stored for compost) was much higher (69%). The results of the ten monitored farms showed that content of the main constituents in fresh weight in the warm season were: 17.3% OM total (SD of 7.2). N, P2O5and K2O totals:
1.60%, 3.51%, 0.59% respectively. Those con-stituents in FW in the cold season were: 14.2% OM total (SD of 2.6). N, P2O5 and K2O totals: 1.57%,
1.99%, 0.50% respectively. Most of the nitrogen, phosphorus and potassium are contained in the solid part of the total generated pig waste. On average, pig farms in the warm season discharged 0.269 kg N, 0.662 kg PO and 0.099kg KO per metric ton of pig
cold season discharged 0.352 kg N, 0.229 kg P2O5
and 0.148 kg K2O per metric ton live weight and the
liquid part contributed 5.5%, 2.1% and 12.8% respectively. With data from only the ten selected farms in Thai Binh, nitrogen per metric ton of animal weight seemed not to be influenced by season, but phosphorus was higher in liquid waste during winter than summer; potassium changed according to the season, and its content was higher during summer than winter.
66 samples of compost and animal waste as fish feed were taken during summer, of which 46 were ready-to-spread compost, 20 others were animal excreta as fish feed. Farmers used fresh manure for feeding fish, but mixed animal waste with different local materials such as rice straw, husks, ashes and lime for crops, and composted it at least 15 days before fertilizing. Moisture in both compost and animal waste as fish feed varied greatly (37-90%, 48-94% respectively). In average, animal waste as fish feed contains 0.72 %N, 1.37 P2O5and 0.28% K2O; compost contains 0.46 %N,
0.64 P2O5and 0.53% K2O (fresh weight).
The results of the study confirmed the fact that it is possible to use the animal waste source coming from the pig farms of Thai Binh province as a main nutrient
macro-elements but also micro-elements as well as organic matter. We can estimate that solid pig excreta in Thai Binh province would supply enough phospho-rus for paddy grown in the province, but not enough nitrogen and potassium. Even if pig farms’ wastewater has a low concentration of nitrogen and phosphorus, it is necessary to recommend to farmers to consider pig manure and cleaning water for crops as much as possible in substitution for chemical fertilizers, and to avoid discharging these liquids directly into rivers. The paddy fields would play the role of a natural filter and plants would use the pollutants as nutrients.
Finally, after preliminary calibrations using NIRS spec-trometry with local pig waste and co-products, per-spectives are promising in terms of research and local development. Research institutions now have here an analytical method to define the composition in nitro-gen, and build a decision support tool to better and more rapidly know the nitrogen, phosphorus and potassium contents in composts and other animal manure used as fertilizers by crops producers. In Chapter 4, interviewed stakeholders regretted the lack of information about the fertilizing potential of their animal waste; with the NIRS method, they would have rapid, cheap and reliable access to the composition, in particular to nitrogen content.
Acknowledgements
The authors would like to thank the farmers and offi-cers in the four districts of Vu Thu, Quynh Phu, Dong Hung and Thai Thuy who helped us with humour and
sincerity during the collection process. Thanks to Drs Denis Bastianelli, Laurent Thuriès, Laurent Bonnal, Paulo Salgado, Mr. Tran Van Thu, and Mrs Doan Thi Khang for their technical assistance with NIRS. Thanks also to M. Vu Trong Hoa and to Mr Nguyen Trung Dien who took part in this project during his BSc study.
References
1. Levasseur P. Mieux connaître les lisiers de porc: compositions, volumes et analyses. Paris: Institut Technique du Porc, 1999.
2. Hillion B. Adéquation entre la production d'efflu-ents d'élevage et leur utilisation potentielle pour fer-tiliser les cultures et les étangs aquacoles dans un district du nord Vietnam. Paris-Grignon: INAPG, 2005:70.
3. Menzi H, Gerber P. The land: livestock balance approach and its implications for intensive live-stock production in South-East Asia. In: BSAS A, ed. Thailand, 2005:131-144.
4. Thuriès L, Bastianelli D, Davrieux F, Bonnal L, Oliver R, Pansu M, Feller C. Prediction by near infrared spectroscopy of the composition of plant raw materials from the organic fertiliser industry and of crop residues from tropical agrosystems. J.Near Infrared Spectrosc. 2005; 13:187-199.
5. Woynarovich. Report of Consultancy to Penang, Malaysia, Regarding Animal Waste Management Problem, 1979.
6. Le Van Can. Guide des engrais. Hanoi: Hanoi agri-cultural publishing house, 1975.