HAL Id: hal-00295797
https://hal.archives-ouvertes.fr/hal-00295797
Submitted on 6 Dec 2005
HAL is a multi-disciplinary open access
archive for the deposit and dissemination of
sci-entific research documents, whether they are
pub-lished or not. The documents may come from
teaching and research institutions in France or
abroad, or from public or private research centers.
L’archive ouverte pluridisciplinaire HAL, est
destinée au dépôt et à la diffusion de documents
scientifiques de niveau recherche, publiés ou non,
émanant des établissements d’enseignement et de
recherche français ou étrangers, des laboratoires
publics ou privés.
microphysics: II. Identification of key uncertainties
D. V. Spracklen, K. J. Pringle, K. S. Carslaw, M. P. Chipperfield, G. W. Mann
To cite this version:
D. V. Spracklen, K. J. Pringle, K. S. Carslaw, M. P. Chipperfield, G. W. Mann. A global off-line model
of size-resolved aerosol microphysics: II. Identification of key uncertainties. Atmospheric Chemistry
and Physics, European Geosciences Union, 2005, 5 (12), pp.3233-3250. �hal-00295797�
Atmos. Chem. Phys., 5, 3233–3250, 2005 www.atmos-chem-phys.org/acp/5/3233/ SRef-ID: 1680-7324/acp/2005-5-3233 European Geosciences Union
Atmospheric
Chemistry
and Physics
A global off-line model of size-resolved aerosol microphysics: II.
Identification of key uncertainties
D. V. Spracklen, K. J. Pringle, K. S. Carslaw, M. P. Chipperfield, and G. W. Mann
Institute for Atmospheric Science, School of Earth and Environment, University of Leeds, UK Received: 21 January 2005 – Published in Atmos. Chem. Phys. Discuss.: 30 May 2005 Revised: 24 October 2005 – Accepted: 14 November 2005 – Published: 6 December 2005
Abstract. We use the new GLOMAP model of global aerosol microphysics to investigate the sensitivity of mod-elled sulfate and sea salt aerosol properties to uncertainties in the driving microphysical processes and compare these uncertainties with those associated with aerosol and precur-sor gas emissions. Overall, we conclude that uncertainties in microphysical processes have a larger effect on global sulfate and sea salt derived condensation nuclei (CN) and cloud con-densation nuclei (CCN) concentrations than uncertainties in present-day sulfur emissions. Our simulations suggest that uncertainties in predicted sulfate and sea salt CCN abun-dances due to poorly constrained microphysical processes are likely to be of a similar magnitude to long-term changes in sulfate and sea salt CCN due to changes in anthropogenic emissions. A microphysical treatment of the global sul-fate aerosol allows the uncertainty in climate-relevant aerosol properties to be attributed to specific processes in a way that has not been possible with simpler aerosol schemes. In par-ticular we conclude that: (1) changes in the binary H2SO4
-H2O nucleation rate and condensation rate of gaseous H2SO4
cause a shift in the vertical location of the upper tropospheric CN layer by as much as 3 km, while the shape of the CN pro-file is essentially pre-served (2) uncertainties in the binary H2SO4-H2O nucleation rate have a relatively insignificant
effect on marine boundary layer (MBL) aerosol properties; (3) emitting a fraction of anthropogenic SO2as particulates
(to represent production of sulfate particles in power plant plumes below the scale of the model grid (which is of the or-der of 300 km)) has the potential to change the global mean MBL sulfate-derived CN concentrations by up to 72%, and changes of up to a factor 20 can occur in polluted continental regions; (4) predicted global mean MBL sulfate and sea salt CCN concentrations change by 10 to 60% when several mi-crophysical processes are changed within reasonable
uncer-Correspondence to: D. V. Spracklen
tainty ranges; (5) sulfate and sea salt derived CCN concentra-tions are particularly sensitive to primary particle emissions, with global mean MBL sulfate and sea salt CCN changing by up to 27% and local concentrations over continental re-gions changing by more than 100% when the percentage of anthropogenic SO2emitted as particulates is changed from 0
to 5%; (6) large changes in sea spray flux have insignificant effects on global sulfate aerosol except when the mass ac-commodation coefficient of sulfuric acid on the salt particles is set unrealistically low.
1 Introduction
Several global aerosol models have recently been developed that include a full size-resolved (sectional) treatment of the aerosol mass and number (Gong et al., 1997, 2003; Jacob-son, 2001; Adams and Seinfeld, 2002, 2003; Spracklen et al., 2005). Although global simulations with these models have mostly been restricted to just sea salt (Gong et al., 1997), sulfate (Adams and Seinfeld, 2002) or their combination (Adams and Seinfeld, 2003; Gong et al., 2003; Spracklen et al., 2005), much has been learned about the factors that control the aerosol size distribution in different atmospheric regions. These global sectional aerosol models calculate aerosol properties from first principles without making as-sumptions about the shape of the size distribution. Once these models have been evaluated against modern observa-tions they should be useful tools for calculating global cloud condensation nuclei (CCN) concentrations without the need for simple parameterisations relating aerosol mass or number to CCN number. This is an important development as a bet-ter estimation of the anthropogenic effects on CCN number is essential for quantification of the aerosol indirect effect.
An essential part of the development of these models is to quantify the robustness of the predicted aerosol size dis-tribution, given quite large uncertainties in microphysical
processes and emissions. This paper is the second of three papers describing a new GLObal Model of Aerosol Processes (GLOMAP). The first paper described the model and the global simulation of sulfate and sea salt aerosol properties (Spracklen et al., 2005). This second paper examines the sen-sitivity of the predicted aerosol size and spatial distribution to uncertainties in the microphysical processes that control these two aerosol types. The third paper will present a de-tailed comparison of the model against aerosol observations. Sensitivity studies of direct radiative forcing have gener-ally shown a weak dependence on the assumed aerosol size distribution (Kiehl and Briegleb, 1993; Boucher and Ander-son, 1995; Nemesure et al., 1995; Pilinis et al., 1995; Pan et al., 1997). In contrast to these earlier studies, Myhre et al. (2004) showed that relatively small changes in size distribution can change the direct radiative forcing by up to 15%. Sensitivity studies of indirect radiative forcing by sul-fate aerosols show that uncertainty in the shape of the aerosol distribution is one of the largest contributors to model uncer-tainty (Pan et al., 1998), indicating that size-resolved global aerosol models are required for an accurate description of in-direct radiative forcing.
Aerosol box models have been used to understand the pro-cesses controlling aerosol properties in the remote marine boundary layer (MBL) (Pandis et al., 1994; Raes, 1995; Ker-minen and Wexler, 1997; Capaldo et al., 1999; Yoon and Brimblecombe, 2002). Raes (1995) showed that the sensi-tivity of MBL number concentration to the accommodation coefficient and nucleation rate was small compared to the sensitivity to environmental variables such as the rate of en-trainment of aerosol from the free troposphere (FT). For ex-ample, both Raes (1995) and Capaldo et al. (1999) showed that entrainment of FT aerosol into the MBL could suppress MBL aerosol nucleation. However, Capaldo et al. (1999) also showed that modelled MBL aerosol number depended sensitively on the H2SO4accommodation coefficient,
nucle-ation rate and washout efficiency.
Adams and Seinfeld (2002) used a global aerosol model to show that both condensation nuclei (CN) and CCN concen-trations are sensitive to changes in the assumed nucleation rate and to primary particulate emissions from anthropogenic sulfur emissions. Here, we use GLOMAP to explore the sen-sitivity to a much larger range of microphysical processes affecting sulfate and sea salt aerosol and compare the result-ing changes in CN and CCN with those due to uncertainties in emissions of both sulfur species and sea spray.
2 Model description
GLOMAP is an extension to the TOMCAT global 3-D off-line chemical transport model (CTM) (Stockwell and Chip-perfield, 1999). GLOMAP includes the processes of aerosol nucleation, condensation, growth, coagulation, wet and dry deposition, transport, and cloud processing. A full
descrip-tion of GLOMAP is given in Spracklen et al. (2005). The aerosol distribution is described using a sectional scheme with 20 bins spanning dry diameters from about 1 nm to 25 µm. Two moments are simulated in each section (num-ber density and mass per particle). GLOMAP, as used here, is currently restricted to sea salt and sulfate aerosol.
Spracklen et al. (2005) showed that GLOMAP is capable of simulating realistic MBL CN and CCN concentrations un-der conditions where sulfate and sea salt are the dominant components of the aerosol. In the MBL the model simu-lates the submicron bimodal distribution with Aitken mode and accumulation mode simulated at approximately the cor-rect sizes. In the lower FT the model simulates a unimodal distribution.
In this study we use a spatial resolution of 2.8◦×2.8◦ lat-itude × longlat-itude with 31 hybrid σ -p levels extending from the surface to 10 hPa. In the experiments performed here large-scale atmospheric transport is specified from European Centre for Medium-Range Weather Forecasts (ECMWF) analyses at 6-hourly intervals. The model was initialised with an aerosol-free atmosphere (on 1 October 1995) and spun up for 45 days before sensitivity studies were started.
CN are defined as particles larger than 3 nm diameter. This size corresponds to the detection limit of current instrumen-tation (Stolzenburg and McMurry, 1991; McMurry, 2000). CCN concentrations are calculated off-line from the pre-dicted aerosol size distribution. A supersaturation of 0.2% is chosen which is typical of marine stratocumulus clouds, and corresponds to the activation of particles having a dry di-ameter of about 70 nm. All aerosol concentrations are quoted at standard temperature and pressure (STP, 273 K and 1 atm).
3 Limitations of this study
In this paper we restrict our analysis of microphysical uncer-tainties to sulfate and sea salt aerosols, which is the simplest aerosol system involving primary and secondary particles. We take this approach primarily because sensitivity stud-ies have a high computational cost, but also because sulfate aerosols have been the most studied aerosol type in previous climate model simulations. In these earlier simulations, sul-fate aerosol was sometimes the only aerosol type included or it was simulated alongside other aerosol types such as black carbon, dust and, more recently, organic carbon (Houghton et al., 2001). However, until very recently, the different aerosol types were treated as non-interacting. Our simulations, while more complete in their treatment of microphysical processes, also implicitly assume that sulfate and sea salt aerosol can be treated as being independent of other aerosol types. We stress that our conclusions regarding the sensitivity of CN and CCN concentrations to uncertain microphysical parameters apply to a subset of the total atmospheric aerosol.
D. V. Spracklen et al.: Identification of key uncertainties 3235
4 The effect of different microphysical processes
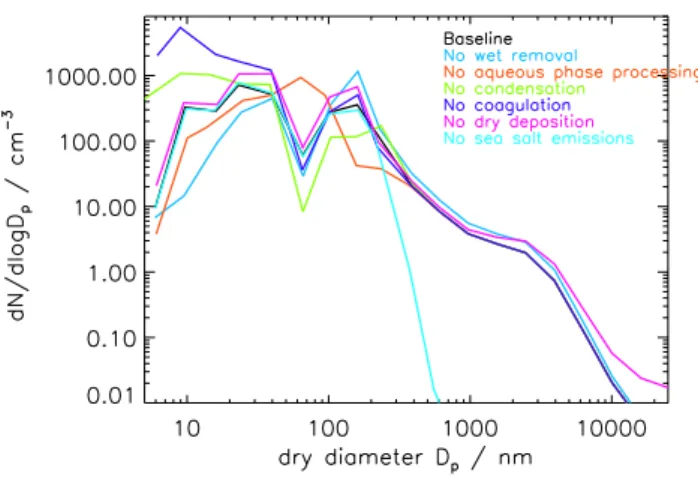
Figure 1 shows how different microphysical processes in-fluence the modelled size distribution in the North Atlantic MBL. The effect of each process in shaping the distribution has been examined by removing one microphysical process at a time. Individual microphysical processes were switched off for 8 days and then the simulated distribution compared to the baseline distribution where all processes were included.
Without in-cloud oxidation the separate accumulation mode and Aitken mode in the MBL distribution disappear, being replaced by one broad sub-micrometer mode similar to that simulated in the free troposphere. This modelled ef-fect supports the idea that in-cloud oxidation of SO2is
re-sponsible for the MBL sub-micrometer bimodal distribution (Hoppel et al., 1986).
Without coagulation there is a large increase in the number of small particles and the mean diameter of the Aitken mode is shifted to smaller sizes. Coagulation removes small par-ticles (which have high mobility and high rates of diffusion so they coagulate rapidly) but has little influence on larger particles (that have slower rates of diffusion).
Condensation of H2SO4onto the existing particles reduces
the concentration of gas phase H2SO4. With condensation
switched off gas phase H2SO4 concentrations build up and
additional nucleation occurs. This causes an increase in the concentration of small particles in the MBL and a reduction in the size of the Aitken mode. Additionally, the concentra-tion of accumulaconcentra-tion mode particles is reduced while their mean diameter is increased. Lack of condensational growth means fewer particles reach the diameter required for acti-vation into cloud droplets. Fewer particles add mass though in-cloud oxidation resulting in the lower accumulation mode number. However, in-cloud oxidation is often H2O2limited
and so when fewer particles are activated these particles may grow to larger sizes.
Switching off particle wet removal processes causes an increase in the concentration of aerosols larger than about 100 nm diameter. In particular, the number of particles in the accumulation mode is greatly increased. This has the ef-fect of increasing the surface area of the aerosol distribution. This increased surface area causes greater condensation of gaseous H2SO4 onto the particle distribution and less new
particle formation. The number of small particles (with dry diameter less than about 40 nm) is lower without wet removal processes.
Switching off sea spray emissions causes a large reduction in the number of particles larger than about 200 nm dry diam-eter. This demonstrates in a simple way the division between particles comprised mainly of sulfate and those comprised mainly of sea spray. The size distribution of particles smaller than 200 nm is virtually unchanged. Switching off sea salt emissions reduces particle surface area in the MBL but has little effect on surface area in the UT, which is where binary H2SO4-H2O nucleation predominately occurs in our model
D. V. Spracklen: Identification of key uncertainties
3
Fig. 1. Comparison of twenty four hour average number-size
dis-tributions for the North Atlantic MBL during December 1995 with
all microphysical processes included and when one microphysical
process at a time has been switched off for the last eight days of the
model run.
has been examined by removing one microphysical process
at a time. Individual microphysical processes were switched
off for 8 days and then the simulated distribution compared to
the baseline distribution where all processes were included.
Without in-cloud oxidation the separate accumulation
mode and Aitken mode in the MBL distribution disappear,
being replaced by one broad sub-micrometer mode similar
to that simulated in the free troposphere. This modelled
ef-fect supports the idea that in-cloud oxidation of SO
2
is
re-sponsible for the MBL sub-micrometer bimodal distribution
(Hoppel et al., 1986).
Without coagulation there is a large increase in the number
of small particles and the mean diameter of the Aitken mode
is shifted to smaller sizes. Coagulation removes small
par-ticles (which have high mobility and high rates of diffusion
so they coagulate rapidly) but has little influence on larger
particles (that have slower rates of diffusion).
Condensation of H
2
SO
4
onto the existing particles
re-duces the concentration of gas phase H
2
SO
4
. With
conden-sation switched off gas phase H
2
SO
4
concentrations build up
and additional nucleation occurs. This causes an increase in
the concentration of small particles in the MBL and a
reduc-tion in the size of the Aitken mode. Addireduc-tionally, the
concen-tration of accumulation mode particles is reduced while their
mean diameter is increased. Lack of condensational growth
means fewer particles reach the diameter required for
acti-vation into cloud droplets. Fewer particles add mass though
in-cloud oxidation resulting in the lower accumulation mode
number. However, in-cloud oxidation is often H
2
O
2
limited
and so when fewer particles are activated these particles may
grow to larger sizes.
Switching off particle wet removal processes causes an
in-crease in the concentration of aerosols larger than about 100
nm diameter. In particular, the number of particles in the
accumulation mode is greatly increased. This has the
ef-fect of increasing the surface area of the aerosol distribution.
This increased surface area causes greater condensation of
gaseous H
2
SO
4
onto the particle distribution and less new
particle formation. The number of small particles (with dry
diameter less than about 40 nm) is lower without wet
re-moval processes.
Switching off sea spray emissions causes a large reduction
in the number of particles larger than about 200 nm dry
diam-eter. This demonstrates in a simple way the division between
particles comprised mainly of sulfate and those comprised
mainly of sea spray. The size distribution of particles smaller
than 200 nm is virtually unchanged. Switching off sea salt
emissions reduces particle surface area in the MBL but has
little effect on surface area in the UT, which is where binary
H
2
SO
4
-H
2
O nucleation predominately occurs in our model
(in contrast to the effect of wet scavenging, which affects
particle surface areas right through the FT). Nucleation rates
are therefore not greatly affected and the number of particles
entraining from the UT is virtually unchanged. This effect
is studied in greater detail in section 5.6 where the model
sensitivity to the emission strength of sea spray is explored.
Switching off turbulent dry deposition causes an increase
in the number of simulated particles throughout the aerosol
size distribution, but with limited impact to accumulation
mode particles demonstrating a good representation of
size-resolved deposition. Dry deposition occurs only at the
sur-face and as for changes in sea spray emissions only changes
surface area in the MBL and not in the UT where new
parti-cle production occurs. Therefore, switching off dry
deposi-tion does not cause the reducdeposi-tion in new UT particle
forma-tion and the decrease in MBL Aitken mode particle that is
observed for wet deposition.
5
The effect on global aerosol of uncertainties in
micro-physics and emissions
It is important to understand how robust the simulated
aerosol properties are, given often quite large uncertainties in
the rates of microphysical processes. In this section we
ex-amine the effect of uncertainties in the sulfuric acid aerosol
nucleation rate, the condensation rate of gaseous H
2
SO
4
and
the size of the nucleation cluster. We also examine the effect
of changing the activation radius for cloud drop formation
for aqueous SO
2
oxidation and in-cloud nucleation
scaveng-ing. The effects of these microphysical uncertainties are then
compared with the effects of uncertainties in the emission
rates of sulfur species and of sea spray particles.
To perform these sensitivity studies two global aerosol
fields were compared. In the first run, the global aerosol
field was calculated over a 90-day period (including a
spin-up from an aerosol-free atmosphere). In the second run, the
model was spun up for a period of 45 days, then a particular
processes were changed and the model was run for a further
45 days. Aerosol properties in these two runs are compared
for the last 30 days of the 90-day model runs. Comparisons
with model runs over longer time periods showed that this
length of model run is sufficient to capture most of the change
that occurred due to changes in parameterisation rates.
Fig. 1. Comparison of twenty four hour average number-size
dis-tributions for the North Atlantic MBL during December 1995 with all microphysical processes included and when one microphysical process at a time has been switched off for the last eight days of the model run.
(in contrast to the effect of wet scavenging, which affects particle surface areas right through the FT). Nucleation rates are therefore not greatly affected and the number of particles entraining from the UT is virtually unchanged. This effect is studied in greater detail in Sect. 5.6 where the model sensi-tivity to the emission strength of sea spray is explored.
Switching off turbulent dry deposition causes an increase in the number of simulated particles throughout the aerosol size distribution, but with limited impact to accumulation mode particles demonstrating a good representation of size-resolved deposition. Dry deposition occurs only at the sur-face and as for changes in sea spray emissions only changes surface area in the MBL and not in the UT where new parti-cle production occurs. Therefore, switching off dry deposi-tion does not cause the reducdeposi-tion in new UT particle forma-tion and the decrease in MBL Aitken mode particle that is observed for wet deposition.
5 The effect on global aerosol of uncertainties in micro-physics and emissions
It is important to understand how robust the simulated aerosol properties are, given often quite large uncertainties in the rates of microphysical processes. In this section we ex-amine the effect of uncertainties in the sulfuric acid aerosol nucleation rate, the condensation rate of gaseous H2SO4and
the size of the nucleation cluster. We also examine the effect of changing the activation radius for cloud drop formation for aqueous SO2oxidation and in-cloud nucleation
scaveng-ing. The effects of these microphysical uncertainties are then compared with the effects of uncertainties in the emission rates of sulfur species and of sea spray particles.
To perform these sensitivity studies two global aerosol fields were compared. In the first run, the global aerosol
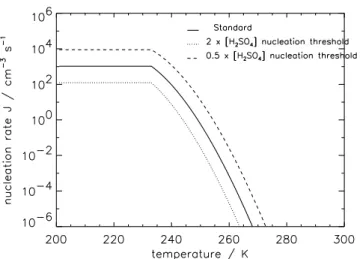
Fig. 2. Calculated nucleation rates using the Kulmala et al. (1998)
paramaterisation for a fixed gas phase H2SO4 concentration of
3×107cm−3and relative humidity of 55%. Below 233 K the nu-cleation rate is held constant.
field was calculated over a 90-day period (including a spin-up from an aerosol-free atmosphere). In the second run, the model was spun up for a period of 45 days, then a particular processes were changed and the model was run for a further 45 days. Aerosol properties in these two runs are compared for the last 30 days of the 90-day model runs. Comparisons with model runs over longer time periods showed that this length of model run is sufficient to capture most of the change that occurred due to changes in parameterisation rates. 5.1 Sensitivity to nucleation and condensation rates Accurately including a description of particle nucleation in a global model is difficult. There are significant uncertain-ties in the rate of nucleation and even the mechanisms that predominate in the atmosphere (e.g., Kulmala et al., 2004). Binary H2SO4-H2O nucleation has been the most studied
mechanism, but there are examples where this mechanism seems unable to explain observed nucleation events (Weber et al., 1995; Kulmala et al., 2004). NH3lowers the vapour
pressure of H2SO4 above solution surfaces (Marti et al.,
1997), and may increase nucleation rates by several orders of magnitude (Coffman and Hegg, 1995; Napari et al., 2002). Particle nucleation rates are strong nonlinear functions of temperature and precursor gas vapour pressure. Therefore sub-grid scale variations in humidity, temperature or H2SO4
concentration could lead to higher nucleation rates than the mean conditions would suggest. Sub-grid scale variability may occur through atmospheric mixing, waves, turbulence, convective eddies or cloud outflow (Easter and Peters, 1994; Nilsson et al., 2000; Clarke et al., 1998).
The binary H2SO4-H2O homogeneous nucleation rate,
which we use here (Spracklen et al., 2005), is uncertain to within several orders of magnitude even under conditions
where laboratory measurements are available (Vehkam¨aki et al., 2002). The most recent paramaterisations (Vehkam¨aki et al., 2002), while more physically realistic, do not agree better with the limited laboratory measurements than earlier simpler schemes (Kulmala et al., 1998). Nucleation rates be-low the temperature limit of observations (236 K) may be even less reliable. Other nucleation mechanisms are also clearly involved in the atmosphere (Kulmala et al., 2004). Sensitivity studies involving nucleation rates are therefore likely to be fairly conservative. In this work, we use the nucleation parameterisation of Kulmala et al. (1998), which is valid down to 233 K. Below this temperature we use the rate at 233 K. Figure 2 shows how the rate we use depends on temperature and humidity for a fixed realistic gas phase H2SO4concentration of 3×107cm−3. Our sensitivity
stud-ies then explore how important variations in the rate of nu-cleation are likely to be for aerosol distributions. Such sensitivity tests provide a reasonable measure of how the global aerosol depends on the binary homogeneous nucle-ation rate and suggest what improvement in parameterised rates is needed.
5.1.1 Balance of nucleation and condensation
Nucleation of new sulfuric acid particles and condensation of H2SO4onto existing particles compete for available gas
phase H2SO4. This competition means that uncertainties in
the rates of both processes will affect the atmospheric con-centration of CN. We therefore examine the effect of uncer-tainties in both processes together. The results are shown in Figs. 3 and 4. GLOMAP attempts to capture the com-petition between nucleation and condensation by selecting a short timestep (generally about 90 s) over which these pro-cesses are calculated (Spracklen et al., 2005).
Nucleation rates (j ) were changed by varying the H2SO4
nucleation threshold (the H2SO4 concentration at which a
nucleation rate of 1 cm−3 s−1 is calculated) in the Kulmala et al. (1998) parametrisation. A doubling or halving of the nucleation threshold causes approximately a factor 10 change in j (Fig. 2).
Condensation rates were changed by changing the accom-modation coefficient, ae, which defines the probability that
a molecule of H2SO4will become bound to a particle upon
collision. There is considerable uncertainty in the magni-tude of ae. Van Dingenen and Raes (1991) report values
of aein the range of 0.02 to 0.1. The theoretical studies of
Clement et al. (1996) and the field measurements of Weber et al. (1995) report values of ae close to unity. P¨oschl et al.
(1998) experimentally determined ae at 303 K with a lower
limit of 0.43 and a best fit value of 0.65. Jefferson et al. (1997) measured H2SO4 uptake onto (NH4)2SO4 aerosol
and reported values of 0.73±0.21 and onto NaCl aerosol of 0.79±0.23. Models also use a wide range of values; Pandis et al. (1994) and Russell et al. (1994) use a value of 0.02; Raes (1995), 0.3; Katoshevski et al. (1999), 1.0; Adams and
D. V. Spracklen et al.: Identification of key uncertainties 3237
CN CCN
(a)
(b)
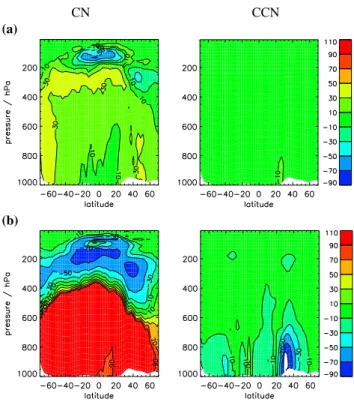
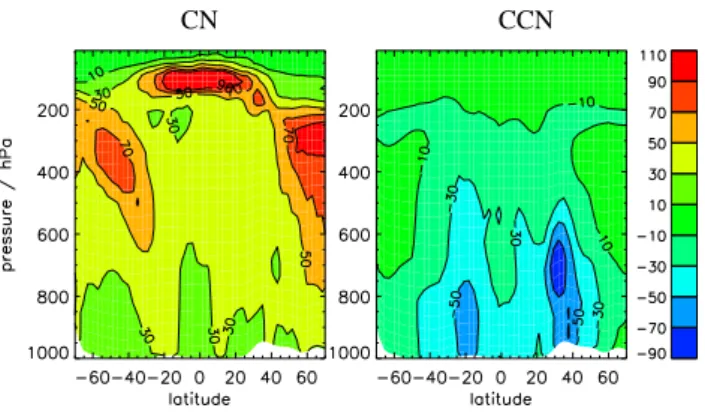
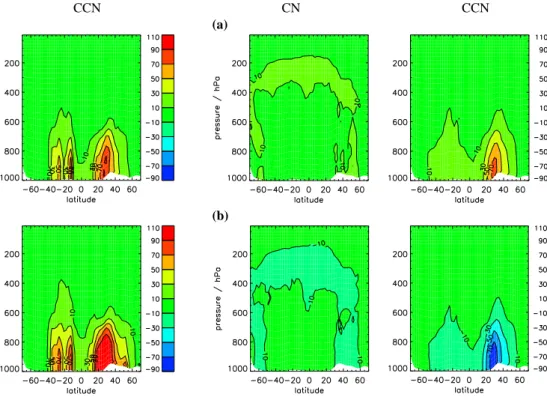
Fig. 3. Monthly mean change in zonal mean CN (% change) and
CCN (absolute change (cm−3) at 0.2% supersaturation) at STP for December 1995 for (a) H2SO4threshold twice that of baseline case;
(b) H2SO4threshold half that of baseline case. A doubling/halving of the threshold H2SO4concentration for nucleation in the Kulmala
et al. (1998) parameterisation causes approximately a factor 10 de-crease/increase in the nucleation rate under most conditions (see Sect. 5.1.1).
Seinfeld (2002), 0.65 and Easter et al. (2004), 0.02. Labo-ratory and field studies have shown that the value of ae is
reduced as a particle becomes increasingly covered in surfac-tants (D¨aumer et al., 1992). Marine air contains substantial surfactant concentrations from ocean bubble bursting which may be able to coat marine aerosol particles, thereby reduc-ing accommodation coefficients.
Figures 3 and 4 show that increasing j (or decreasing ae)
causes an increase in CN concentrations below about 200– 400 hPa and a decrease in CN at higher levels. In the upper troposphere the pattern of response to increasing j or de-creasing aeis similar, with changes >50%. These fractional
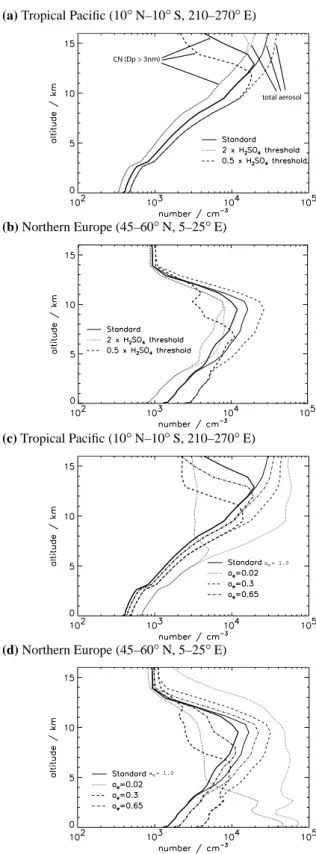
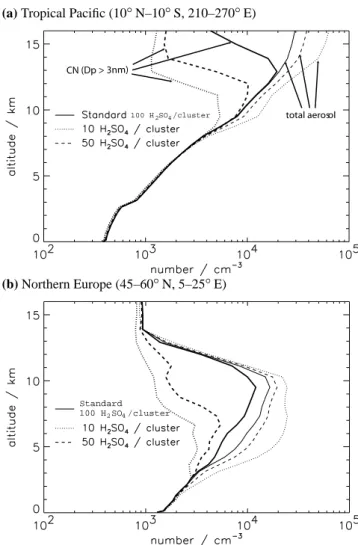
changes in CN concentration appear to be counterintuitive as one might expect an increase in CN concentration in re-sponse to an increased nucleation rate. Figure 5 shows al-titude profiles for a remote marine situation and a polluted continental situation and gives a rather different perspective on how CN concentrations change. In both locations, chang-ing j and aechanges the altitude in the UT at which the
max-imum CN concentration occurs (a shift of about 1.5 km for a factor 10 change in j or 3 km for a change in ae from 1.0
to 0.3), while the shape of the CN profile is essentially
pre-CN CCN
(a)
(b)
Fig. 4. Monthly mean change in zonal mean CN (percentage change) and CCN (absolute change (cm−3) at 0.2% supersatura-tion) at STP for December 1995 for accommodation coefficients of
(a) ae=0.65; (b) ae=0.02. Baseline model runs use ae=1.0
served. Increasing j (or decreasing ae) decreases the altitude
of the CN maximum, whereas decreasing j (or increasing ae)
increases the altitude of the CN maximum. This shift in alti-tude of the CN layer has important consequences for compar-ing model CN number against UT CN measurements. Due to the strong vertical gradients of particle number concentra-tions in the UT, model error in the altitude of the CN maxima will cause large errors in the predicted CN concentrations at any altitude.
Figure 5 also shows changes in the vertical profile of the total particle concentration (including particles smaller than 3 nm diameter). These look very different from the changes in CN, with increasing nucleation rates now causing increases in the total particle concentration and no change in the altitude at which the maximum concentration occurs. Reducing the H2SO4nucleation threshold increases the rate
of production of nucleation clusters, which, at any altitude, gives rise to higher concentrations of nucleation clusters and hence also total aerosol. The concentration of CN depends on the number of nucleation clusters that survive coagulational scavenging up to 3 nm diameter. The number of CN therefore depends on the competition between nucleation and conden-sation for available H2SO4. As altitude increases,
temper-ature decreases causing the H2SO4 nucleation threshold to
decrease. Thus at higher altitudes the gas phase H2SO4
con-centrations, and hence condensation rates, tend to be lower,
(a) Tropical Pacific (10◦N–10◦S, 210–270◦E) ol (b) Northern Europe (45–60◦N, 5–25◦E) (c) Tropical Pacific (10◦N–10◦S, 210–270◦E) a = 1.0e (d) Northern Europe (45–60◦N, 5–25◦E) a = 1.0e
Fig. 5. Monthly mean vertical profiles for December 1995 for
changes in nucleation and condensation rate. Number concentra-tion (at STP) are shown for particles with dry diameter greater than 3 nm (thick lines) and all particles including nucleation clusters less than 3 nm diameter (thin lines).
(a) (b)
Fig. 6. Monthly mean percentage change in surface mean CN
con-centrations for December 1995. (a) H2SO4threshold twice that of
baseline case; (b) H2SO4threshold half that of baseline case.
which reduces cluster growth rates and increases the fraction of clusters that are coagulationally scavenged before reach-ing 3 nm. The altitude of the CN maximum occurs where the combination of the nucleation and condensation rates gives rise to the highest CN number. As j increases (or ae
de-creases) the altitude at which this occurs decreases causing the decrease in the altitude of the CN maximum.
Below the UT the response of CN concentrations to changes in j and ae depends on the abundance of sulfur
species. Over polluted regions (Fig. 5b and d) CN concen-trations in the lower atmosphere change by more than a fac-tor of 2 when j and ae are changed. In polluted
continen-tal regions, where more gas phase H2SO4is present, particle
growth rates are faster and increased nucleation rates leads to higher BL number concentrations as more nucleation mode particles grow fast enough to survive coagulational scaveng-ing. The effect of changes in ae is particularly marked in
the polluted lower troposphere (Fig. 5d), where CN concen-trations increase by up to a factor of 20 when ae is reduced
from 1.0 to 0.02. Reducing aethis much allows BL gas phase
H2SO4 concentrations to build up sufficiently to allow BL
binary H2SO4-H2O nucleation to occur. In contrast,
tropi-cal remote MBL locations (Fig. 5a and c) typitropi-cally show less than a 10% change in CN concentrations when j changes by an order of magnitude. In such clean locations the low H2SO4concentrations ensure that nucleation occurs almost
exclusively in the UT.
Below the UT, the response of CN to changes in j and ae
is also dependent on the temperature. Low FT temperatures allow nucleation to occur nearer the surface. Figure 6 shows that changes in CN in the Southern Ocean BL (40◦–60◦S)
are in excess of 100% when j changes by a factor 10, but are considerably less in the tropics.
Changing nucleation rates by an order of magnitude causes about a 6–9% change in global mean MBL sulfate and sea salt derived CCN concentrations. Reducing the accommoda-tion coefficient from 1.0 to 0.3 causes little effect on global mean CCN concentrations. However, reducing condensation rates further (by reducing aeto 0.02) causes about a 25%
re-duction in global mean MBL sea salt and sulfate CCN con-centrations.
D. V. Spracklen et al.: Identification of key uncertainties 3239 Conclusions regarding the sensitivity of CN and CCN
con-centrations to changes in nucleation and condensation rates are of course restricted to simulations using a binary H2SO4
-H2O homogeneous nucleation rate and with sulfate and sea
salt as the only aerosol constituents. The nucleation scheme we use produces particles mostly in the cold UT and FT. Changes in BL CN therefore tend to be rather small. Ob-servations suggest that CN can also be produced in the plan-etary boundary layer (Kulmala et al., 2004), perhaps assisted by condensation of organic vapours. It is therefore likely that these simulations underpredict the effect that changes in nu-cleation rate have on the BL aerosol distribution. In addition, our simulations will underpredict continental aerosol surface area and so are likely to underestimate the impact of uncer-tainty in condensation rates on aerosol properties. However, in a model in which particle formation occurs through binary homogeneous nucleation the CN source to the BL is decou-pled from the surface area in the BL itself.
5.1.2 Sensitivity to the nucleation cluster size
The nucleation critical cluster is the smallest size above which a cluster of H2SO4molecules is stable. The nucleation
parametrisation of Kulmala et al. (1998) does not provide any information on the critical cluster size of the nucleating par-ticles, although more recent parametrisations do (Vehkam¨aki et al., 2002). The sensitivity to the cluster size was investi-gated by reducing the cluster size from 100 to 10 molecules of H2SO4.
Reducing the critical cluster size causes a downward shift in the altitude of the CN maximum (by as much as 3 km) and an overall reduction in the concentration (Fig. 7). However, altitude profiles of total particle number (including particles less than 3 nm diameter) have the same shape irrespective of the critical cluster size, with smaller critical clusters giving greater particle number at any altitude in the UT. Smaller crit-ical clusters take longer to grow to observable sizes (>3 nm diameter) where they are counted as CN. Smaller clusters are therefore subject to coagulational scavenging for a longer period of time, which causes a reduction in CN concentra-tion (smaller particles also have higher mobility and there-fore higher coagulational loss rates). The shift in altitude of the CN maximum can be explained by changes in the growth and coagulation rates with altitude for different initial clus-ter sizes: smaller critical clusclus-ters take longer to grow to CN sizes and are more likely to be coagulation scavenged by the existing particle sink rather than grow through condensation to a form a new CN. As altitude increases, the temperature falls and gives rise to a reduced H2SO4 nucleation
thresh-old. This causes reduced gas phase H2SO4 concentrations
which in turn causes reduced condensational growth rates. Rates of coagulational scavenging are fairly stable with alti-tude (due to relatively stable Aitken mode concentrations) which means as altitude increases nucleation clusters are more likely to be scavenged before they can grow into CN
(a) Tropical Pacific (10◦N–10◦S, 210–270◦E)
nm) osol 100 H SO /cluster2 4 (b) Northern Europe (45–60◦N, 5–25◦E) 100 H SO /cluster2 4 Standard
Fig. 7. Monthly mean vertical profiles during December 1995 for
different H2SO4nucleation cluster sizes. Number concentration (at
STP) are shown for particles with dry diameter greater than 3 nm (thick lines) and all particles including nucleation clusters less than 3 nm diameter (thin lines).
sized particles. Therefore as the critical cluster size is de-creased the altitude at which nucleation clusters will be more likely to grow into CN than be scavenged also decreases. Conclusions regarding the growth rates and survival of nu-cleating clusters will be dependent on the accuracy of model coagulation rates.
Global mean MBL CN concentrations change by less than 2%. Global mean MBL CCN concentrations (not shown) are virtually unaffected, changing by less than 1%.
5.2 Sensitivity to aqueous phase oxidation
In GLOMAP, aerosol particles are assumed to activate into cloud droplets when low warm-phase cloud is present and the particle diameter is greater than a preset fixed diameter (Spracklen et al., 2005). Activated particles are assumed to grow into droplets in cloudy air and subsequently support
CN CCN
Fig. 8. Monthly mean change in zonal mean CN (% change) and
CCN (absolute change (cm−3) at 0.2% supersaturation) concentra-tions at STP for December 1995 for an aerosol activation diame-ter into cloud droplets of 0.08 µm. Baseline activation diamediame-ter is 0.05 µm.
oxidation of SO2to sulfate, which then remains on the
parti-cles as the air subsequently passes into clear air. In the base-line model runs, aerosol particles are assumed to activate at an equivalent dry diameter of 0.05 µm. Figure 8 shows the sensitivity of simulated aerosol distributions to a change in this activation diameter.
The changes in CCN concentration shown in Fig. 8 are calculated at 0.2% supersaturation. The activation diameter used during the model simulation was fixed at 0.05 µm in the baseline run and 0.08 µm (corresponding to 0.18% supersat-uration) in the sensitivity run. In the atmosphere the activa-tion diameter will vary greatly from one cloud to another and from region to region driven partly by variations in updraught velocity. In any model sensitivity run the activation diameter and hence cloud supersaturation is fixed. Effectively, we are simulating repeated aerosol activation and in-cloud oxidation at a fixed high or low supersaturation and then examining the effect of such events on the CCN abundance at some average supersaturation of 0.2%.
Increasing the activation diameter from 0.05 to 0.08 µm reduces global mean MBL CCN (0.2%) concentrations by around 50%. Using a smaller activation diameter in the model allows a greater proportion of the particles to grow rapidly through aqueous phase oxidation of SO2 while the
particles exist as cloud droplets. This growth of small parti-cles leads to a greater concentration of partiparti-cles that can be activated at more moderate supersaturations of 0.2%.
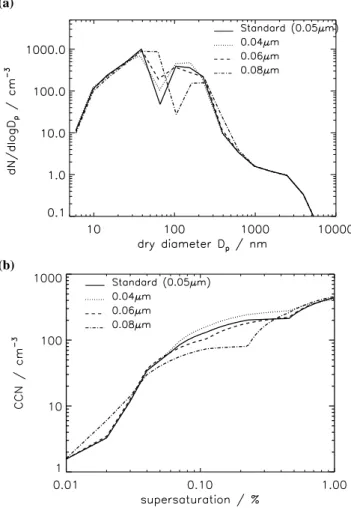
Figure 9a shows how a change in the activation diame-ter affects the simulated number-size distribution in the sub-tropical MBL. Changes in the size distribution are appar-ent between 10 nm and about 1 µm. Above about 1 µm the number-size distribution is dominated by sea salt emission and deposition fluxes. Increasing the size of the activation diameter for in-cloud oxidation causes an increase in the mean diameter of the Aitken mode from ∼25 nm to around
∼60 nm. Increasing the activation diameter also reduces the
(a)
(b)
Fig. 9. Monthly mean simulated aerosol distributions in the
trop-ical Pacific MBL (10◦N–10◦S, 210–270◦E) for December 1995 with different activation diameters for aqueous phase oxidation. (a) Number-size distribution; (b) CCN spectrum.
number and increases the mean diameter of the accumula-tion mode. In many cases aqueous phase oxidaaccumula-tion will be H2O2limited. At larger activation diameters the fewer
parti-cles that are large enough to activate will share the available H2O2. These fewer activated particles will therefore tend to
add more mass and grow to larger sizes.
These results can also be shown as a change in the CCN spectrum. Measurements made using CCN counters give the number concentration of CCN active at particular supersat-urations (Gras, 1995; Ayers and Gillett, 2000). Figure 9b shows the simulated CCN number concentration at supersat-urations between 0 and 1% for the 4 model runs with dif-ferent particle activation diameters. The CCN number con-centration is calculated for each supersaturation using Kohler theory, assuming that particles larger than the critical diam-eter instantly grow into cloud droplets. As the supersatu-ration is increased from 0 to 1% the number concentsupersatu-ration of activated particles increases as the diameter of activation decreases. At very low supersaturations only large sea salt
D. V. Spracklen et al.: Identification of key uncertainties 3241 particles will activate and the number of CCN are identical
for all the different activation diameters. At slightly higher supersaturations (0.01–0.04%) larger activation diameters re-sult in greater CCN number due to the larger mean size of the simulated accumulation mode. At slightly higher su-persaturations (between about 0.06 and 0.4%) the number of CCN is greater for smaller model activation diameters. Smaller activation diameters mean that a greater subset of the particle population in activated and adds mass through aqueous-phase oxidation. However, as the supersaturation is raised further (to 0.4–1%) the CCN concentrations are slightly larger for small activation diameters. Smaller acti-vations diameters give an increase in the mean diameter of the simulated Aitken mode, which are then activated as the supersaturation increases.
Finally, it is worth noting that changing the diameter of activation has little effect on global mean CN concentrations, which change by about 1–2% when the diameter of activation changes from 0.04 to 0.08 µm.
5.3 Sensitivity to nucleation scavenging
Loss of aerosol due to nucleation, or in-cloud, scavenging is a complex process that can be viewed as occurring over two separate stages. In the first stage (cloud formation), those aerosol with radii greater that a certain critical radius grow rapidly by diffusion and condensation to form a spectrum of cloud droplets. Of these newly formed droplets, only those with radii greater than 20 µm will undergo efficient collision-coalescence to produce raindrops (Rogers and Yau, 1989).
In GLOMAP, aerosol with a dry diameter greater than 0.05 µm are assumed able to activate to form cloud drops. During rain formation, the largest of these cloud drops will coalesce most efficiently and will be preferentially lost from the cloud. Following the assumption that the largest aerosol will form the largest cloud droplets (Flossmann, 1991), it can be assumed that in-cloud scavenging will preferentially re-move the largest of the activated aerosol. An effective scav-enging diameter of 0.206 µm is chosen above which nucle-ation scavenging may occur in the model. This value is in-termediate between the values used by Adams and Seinfeld (2003) (0.03 µm and 0.082 µm for convective and stratiform clouds respectively) and that used by Capaldo et al. (1999) (0.250 µm). The assumption of one globally uniform scav-enging diameter limits the extent to which the model can capture the effect of different cloud types, however this is difficult to rectify without the inclusion of a detailed cloud microphyics model. Scavenging is scaled to the rate of con-version of condensate to rain drops, this value is typically close to 100%.
Model sensitivity to the magnitude of the scavenging di-ameter is investigated by reducing it to 0.1 µm. This causes an increase in CN concentrations (between the surface and 20 hPa) of up to 100% and a decrease in CCN concentrations (between the surface and 200 hPa) of up to 50 cm−3. CN
CN CCN
Fig. 10. Monthly mean change in zonal mean CN (% change)
and CCN (absolute change (cm−3) at 0.2% supersaturation) con-centrations at STP for activation diameters into cloud droplets for nucleation scavenging of 0.1 µm. Baseline activation diameter is 0.206 µm.
concentrations are most affected in the UT whereas CCN concentrations are most affected in the BL. Reducing the scavenging diameter allows more particles to be scavenged, thus more aerosol mass is removed per precipitation event. This reduces aerosol surface area and promotes the nucle-ation of new particles. Rates of coagulnucle-ational scavenging also decrease, allowing more nucleation clusters to survive and grow into CN.
5.4 Sensitivity to particulate sulfate emissions
Here we examine the effect of a small emission of anthro-pogenic sulfur species in the form of particulates, as has been observed downwind of power plants.
Electricity generation from power plants accounts for a large proportion of anthropogenic emissions of SO2. In the
United States 69% of anthropogenic SO2is emitted by
coal-fired power plants (EPA, 2000). Emissions of sulfur at the power plant stack are thought to be primarily gaseous SO2,
due to high exhaust temperatures and electrostatic precipi-tators which remove primary particles (Brock et al., 2002). However, within hours of emission, power plant plumes may experience rapid gas to particle conversion. Brock et al. (2002) measured enhanced particle number concentrations (in the order of 1×10⁴ to 1×105cm−3) at distances of 20 to 100 km downwind of coal fired power plants in the United States.
Gas to particle conversion may occur on spatial scales (10s of km) that are not resolved by global models (with grid squares of 100 km or more). In the model, if SO2is simply
mixed into a model grid box, the average grid box concen-tration that is calculated will be an underestimate of the con-centrations that are present in the power plant plume before it mixes with the larger scale air masses. If the timescale for oxidation of SO2 into H2SO4 is fast compared to the
mixing timescale this may lead to an underprediction of the
(a) (b)
Fig. 11. Monthly mean surface (a) CN and (b) CCN (0.2%
super-saturation) concentrations for December 1995 with 3% of SO2as
particulate emissions.
concentration of gaseous H2SO4in the plume. In general the
average grid box concentrations will not result in any gas to particle conversion. However, the strongly non-linear rela-tionship between H2SO4 concentration and nucleation rate
may mean that substantial nucleation occurs in the plume. The model, which calculates nucleation from average grid point values, will underestimate new particle formation that occurs in the power plant plume.
To account for this sub-grid scale particle formation occur-ring in the plume, a fraction of the total SO2emissions into
a grid box is assumed to be emitted as particulate sulfate. Estimates of the amount of the emitted SO2that forms
par-ticulate sulfate in the power plant plume range from less than 1% (Dietz and Wieser, 1983; Eliassen and Saltbones, 1983) to up to 5% (Saeger et al., 1989; EMEP, 1989). Recently, some global aerosol models have attempted to include these direct anthropogenic particulate emissions of sulfate (Gong et al., 2003; Adams and Seinfeld, 2002, 2003). Adams and Seinfeld (2003) reported that neglecting emissions of partic-ulates causes an underprediction of CCN number. Particu-late emissions were shown to be more effective at producing CCN than an equivalent amount of gaseous SO2emissions.
Here we assume that a 1–5% emission of SO2as
particu-lates is used as an estimate solely for sub-grid nucleation of sulfate in power plant plumes. It has been suggested that this method could also be used as a simple surrogate for primary carbonaceous emissions (Adams and Seinfeld, 2003). How-ever, other models include carbonaceous aerosol in addition to emissions of primary sulfate. For example, the ECHAM5-HAM model includes 2.5% of SO2as primary sulfate in
ad-dition to emissions of primary carbonaceous emissions (Stier et al., 2005). These different approaches will result in differ-ent simulated CN and CCN concdiffer-entrations. Our estimates of CCN sensitivity need to be repeated in a model with a more complete range of aerosol types.
The effect of including direct particulate emissions in GLOMAP is investigated by comparing model simulations in which all anthropogenic sulfur emissions are assumed to be SO2 with simulations in which a fraction is assumed to
be particulate sulfate. The fraction of SO2that is allowed to
nucleate in the emission plume is changed from 1 to 5% by
(a) (b)
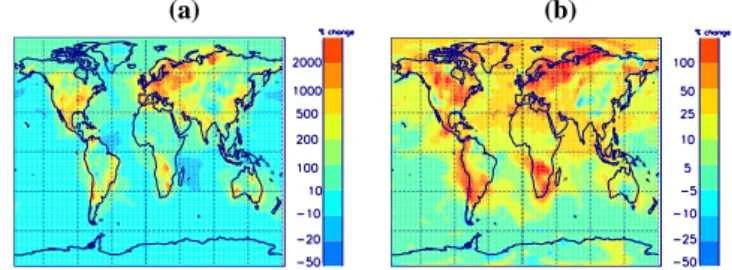
Fig. 12. Monthly mean percentage change in surface (a) CN and (b)
CCN (0.2% supersaturation) concentrations for 3% SO2emitted as
particulate sulfate compared to model run with 100% of emissions as SO2.
mass of total SO2emissions. Primary particles are assumed
to be formed as two lognormal modes with geometric mean diameters of 10 and 70 nm and standard deviations of 1.6 and 2.0, respectively (Whitby, 1978). Fifteen percent by mass of the primary particles is assumed to be emitted in the small mode and the remainder in the large mode (Binkowski and Shankar, 1995).
Figures 11 and 12 show changes in BL CN and CCN for different fractions of particulate sulfate emission and Fig. 13 shows zonal mean changes. Without direct particulate emis-sions, surface CN concentrations over polluted regions are typically 1000–2000 cm−3, which is less than typically ob-served values of 2500–10 000 cm−3 (Raes et al., 2000). When primary emissions are included, total number concen-trations over polluted areas increase to 2000–10 000 cm−3, which is comparable with measurements. However, in pol-luted regions carbonaceous aerosol would be expected to contribute significantly to CN number. Including 3% of SO2
as particulates (with the diameter and standard deviation as-sumed here) may cause an overestimate of the contribution of sulfate aerosol to total CN. Small changes in the assump-tions about the size of primary sulfate emissions will cause large changes in simulated aerosol number. Including car-bonaceous aerosol in the model will be required to test the contributions of primary sulfate and carbonaceous aerosol to total CN. It is likely that to accurately predict the contribution of carbonaceous aerosol to tropospheric CCN will require more extensive observations regarding the size distribution of primary carbonaceous emissions.
Over polluted regions, including particulate emissions in-creases BL CN concentrations by up to a factor of 10 or more. Surface CN number is increased over a large proportion of the North Atlantic. In comparison, over remote marine and continental regions BL CN concentrations remain relatively unchanged (changing by between 10% and −10%).
Over polluted regions, CCN concentrations increase from between 500–1000 cm−3to 1000–5000 cm−3. Again there is no simulated effect over remote marine and continental areas. At altitudes above about 400 hPa CCN number is relatively unchanged.
D. V. Spracklen et al.: Identification of key uncertainties 3243
CN CCN
(a)
(b)
Fig. 13. Monthly mean change in zonal mean CN (% change) and
CCN (absolute change cm−3 at 0.2% supersaturation) concentra-tions at STP for December 1995. (a) 1% direct particulate emis-sions; (b) 3% direct particulate emission.
5.5 Sensitivity to sulfur species emission rates
The sensitivity of the simulated aerosol distributions to un-certainty in the emissions database is studied and compared to the sensitivity to uncertainties in the driving microphysical processes.
GLOMAP uses the Global Emissions Inventory Activity (GEIA) for the emissions of anthropogenic SO2. Benkovitz
et al. (1996) estimates the uncertainty of the GEIA emissions database. Uncertainty is lowest for regions where detailed inventories are available (such as in the US and Europe) and highest where no inventories are available such as over South America and Africa. Uncertainty in regional inventories in Europe (Tuovinen et al., 1994) and the US (Saeger et al., 1989) has been estimated as 25%.
GLOMAP uses the DMS sea-surface concentration database of Kettle et al. (1999) and the sea-air transfer rate from Liss and Merlivat (1986). Uncertainty in the emission rate of DMS is a combination of the uncertainty in DMS sea surface concentrations and the uncertainty in the sea-air transfer rate. The Kettle et al. (1999) database was created using a model that interpolates to a 1◦×1◦ grid from more than 15 000 point DMS measurements. The inaccuracy in the database values at any grid point will depend on the spar-sity of measurements that are used as input to the mapping algorithm for that position (Kettle et al., 1999). Uncertainty
CN CCN
(a)
(b)
Fig. 14. Monthly mean change in zonal mean CN (% change) and CCN (absolute change (cm−3) at 0.2% supersaturation) con-centrations for December 1995. (a) All sulfur emissions 125% of the baseline emissions; (b) all sulfur emissions 75% of the baseline emissions.
is generally largest at higher latitudes due to the sparsity of data points and the high spatial and temporal variability in DMS concentrations that occur there. Kettle and Andreae (2000) estimated that overall uncertainty in the sea-air gas flux of DMS is as large as 50%.
To study the effect of these uncertainties in the model, the emission rates for all sulfur-bearing gases were varied by 25% from the baseline emissions. All anthropogenic sulfur was assumed to be gaseous SO2. This study neglects
feed-backs between changes in SO2concentrations and gas phase
production of H2O2.
Figure 14 shows that CN concentrations in the tropical UT between about 200 and 400 hPa and in the NH and SH mid-latitudes are most sensitive to changes in emissions. CCN concentrations are most sensitive to changes in emissions be-tween the surface and about 500 hPa. Changing the emission rate by 25% causes about a 10% change in global mean sul-fate and sea salt CN and a 15% change in global mean MBL sulfate and sea salt CCN concentrations. This change in CCN is larger than the change caused by uncertainties in the nucle-ation rates (Sect. 5.1), although the changes in CN are less than those due to microphysical processes.
Figure 15 shows the percentage change in global mean CN and CCN concentrations for a 25% and 50% change in global emissions of sulfur gases. Changing the global emission
Fig. 15. Percentage change in globally averaged MBL monthly
mean sea salt and sulfate CN and CCN (0.2% supersaturation) con-centrations for December 1995 for sulfur emission rates of between 50% and 150% of baseline emissions.
rates has a greater impact on CCN concentrations than CN concentrations. Changing emission rates appears to have an almost linear effect on changes in CCN concentrations. A 50% change in emission rates changes global mean MBL CN concentrations by about 15–20% and global mean MBL CCN concentrations by about 30–35%, while a 25% change in emission rates changes global mean MBL CN tions by about 10% and global mean MBL CCN concentra-tions by about 15%.
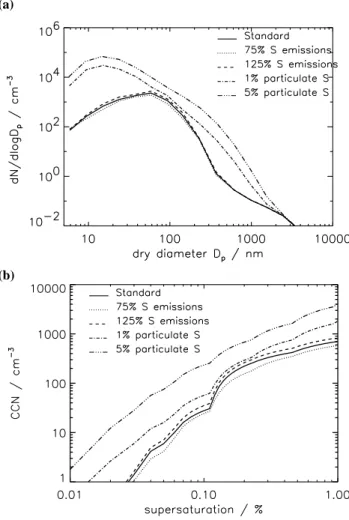
Figure 16 shows number-size distributions and CCN spec-tra over polluted Northern Europe for different sulfur emis-sion rates and percentage of anthropogenic sulfur emitted as primary particles. In the polluted BL including 1% of sul-fur emissions as particulates has a much greater impact on the size distribution than changing emission rates by 25%. When the sulfur flux is changed the general shape of the size distribution is maintained, but with the distribution shifted up or down in number space. Including a percentage of sulfur emissions as particulates changes both the shape of the dis-tribution and the overall particle concentration below about 1 µm. Over Europe, the number mean diameter shifts from about 50 to 15 nm diameter.
Together, Figs. 13 and 14 help to explain why the size dis-tribution in the polluted BL changes much more in response to primary particles than to greater overall SO2emissions.
Changing SO2 leads to small changes in aerosol mass and
number right through the troposphere, with peak changes in the UT. In contrast, primary sulfate particles are created im-mediately in the BL at sizes for which the coagulational scav-enging rate is low, so a large fraction of the emitted particles survive.
Over the US both GLOMAP and a limited area model used by von Salzen et al. (2000) show between 30 and 60% de-crease in CCN concentrations (depending on the supersatu-ration) for a 50% decrease in SO2emissions.
(a)
(b)
Fig. 16. Simulated monthly mean BL (bottom model level) sea salt
and sulfate aerosol distributions over Northern Europe (50–60◦N, 10–20◦E) for December 1995 for different sulfur emission rates and percentages of particulate emissions. The baseline model run has 100% sulfur emissions and 0% of the sulfur emissions emitted as particulates. (a) Number-size distribution; (b) sea salt and sulfate CCN spectrum.
5.6 Sensitivity to sea spray emission rate
Sea spray particles range in size from 0.02 to 60 µm diam-eter (Fitzgerald, 1991), but the climatic importance of sea spray through the aerosol indirect effect, depends largely on the number of particles with sizes of 100 to 200 nm diam-eter (O’Dowd et al., 1999). An accurate description of sea spray flux in this size range is essential to determine the in-fluence of sea spray on the aerosol indirect effect. Under clean marine conditions sea spray particles may dominate the accumulation mode and contribute significantly to the CCN population (O’Dowd and Smith, 1993).
Estimates of the sea salt flux at any particle diame-ter vary by over an order of magnitude (Hoppel et al., 2002). GLOMAP uses the sea spray source function of Gong (2003), which produces realistic fluxes at particle sizes
D. V. Spracklen et al.: Identification of key uncertainties 3245
CN CCN
Fig. 17. Monthly mean change in zonal mean CN (% change) and
CCN (absolute change (cm−3) at 0.2% supersaturation) concentra-tions for December 1995 for sea salt emissions an order of magni-tude higher than in the baseline case.
between 0.07 and 20 µm at 80% humidity (corresponding to approximately 0.035 and 10 µm dry diameter). This pa-rameterisation is an extension of the semi-empirical formu-lation of Monahan et al. (1986) to below 0.2 µm diame-ter, where the original parametrisation was found to over-estimate emissions of sub-micron sea spray particles. The non-dimensional adjustable parameter (2) that controls sub-micron emissions is set at 30.
The effect of uncertainty in the sea spray emission flux is investigated by changing the source strength by an order of magnitude. Figure 17 shows that for an order of magnitude increase in sea spray flux, sulfate and sea salt CCN concen-trations below about 700 hPa increase by up to 100 cm−3. In remote marine areas this is a larger change in CCN than that caused by changing sulfur gas emission rates by 25%. In the MBL, CN concentrations generally increase by less than 5% for an order of magnitude increase in sea spray emissions, although changes of up to 10% between 40 and 60◦S are
predicted. Changes in CN are negligible above the BL. Figure 18 compares the effect on North Atlantic and Southern Ocean MBL number-size distributions of changing sulfur and sea spray emissions. There is an obvious differ-ence between the two oceans in the number of particles in the accumulation mode (∼100–200 nm). In the North Atlantic, the accumulation mode is dominated by sulfate aerosol, and even large increases in sea spray flux have little impact. In contrast, the Southern Ocean accumulation mode number in-creases from ∼10–50 cm−3to ∼100–250 cm−3for an order
of magnitude increase in sea spray emissions. Accumula-tion mode number in the Southern Ocean is also sensitive to the value of 2 (non-dimensional) in the paramateristaion of Gong et al. (2003). Changing 2 from 40 to 15 causes an or-der of magnitude increase in sub-micron sea spray emissions and an increase in accumulation mode number to about 50– 100 cm−3. In both oceans the increase in accumulation mode number is largely offset by decreases in Aitken number, and so total number remains relatively unchanged. Reductions
(a)
(b)
Fig. 18. Simulated monthly averaged MBL number-size
distribu-tions (bottom model level) for December 1995 over (a) Southern Ocean (50–55◦S, 150–155◦E); (b) North Atlantic (40–45◦N, 30– 35◦W) for different sulfur and sea spray emission rates.
in Aitken mode particle concentrations are caused by the in-crease in the BL coagulation sink causing faster scavenging of smaller particles.
Our simulations show that switching off sea spray flux changes global mean CN number by less than 1% (not shown). This result is different to that obtained by Gong and Barrie (2003), who saw BL number increase between 30 and 50% in the North Atlantic and Southern Oceans when no sea spray emissions were included. When the sea spray emission flux is turned off in GLOMAP there is still suffi-cient nss-sulfate aerosol in the BL to provide the necessary condensation sink to keep gas-phase H2SO4concentrations
below the binary H2SO4-H2O nucleation threshold. Aerosol
nucleation occurs predominantly in the cold FT and UT in GLOMAP, but the short lifetime of sea spray is such that only a very small fraction is transported into these cold re-gions. CN concentrations in the UT, and hence the rate of entrainment of aerosol from the FT to the BL, is therefore not changed when the sea spray emission flux is reduced.
Fig. 19. Simulated monthly mean vertical profile of CN
concentra-tions at STP in the Southern Ocean (50–55◦S, 150–155◦E) during December 1995 for different accommodation coefficients and sea spray emissions.
The different response of CN to changes in sea spray in our simulations and those of Gong and Barrie (2003) is due to the different H2SO4accommodation coefficients used. Figure 19
shows the effect of changes in sea spray emissions on vertical profiles of CN number over the Southern Ocean for different accommodation coefficients. When aeis reduced to 0.02 (as
used by Gong and Barrie (2003)), removing sea spray emis-sions causes an increase in BL CN number of about 50%. Such a low value of aein GLOMAP allows nucleation to
oc-cur much closer to the surface (see Sect. 5.1.1) so when sea salt emissions are reduced the reduction in the coagulation sink allows more of these particles to survive to CN sizes.
6 Summary
The sensitivity of the sulfate and sea salt aerosol size distri-bution and the spatial distridistri-butions of CN and CCN abun-dances to changes in the rates of microphysical processes and emission strengths has been investigated using a global model with a sectional aerosol scheme.
The sensitivity of sulfate and sea salt CN and CCN con-centrations is summarised in Fig. 20. In general, model pre-dictions of sulfate and sea salt CN and CCN concentrations are sensitive to realistic uncertainties in both emissions and microphysical processes. Global mean sulfate and sea salt CN concentrations are dominated in these simulations by the very high concentrations of sulfuric acid aerosol in the free and upper troposphere where nucleation rates are highest. Global mean CN is therefore sensitive to the rate of nucle-ation, the critical cluster size and the accommodation coef-ficient of sulfuric acid but relatively insensitive to the acti-vation process in clouds or the emission of primary sulfate particle from surface sources. Global CN is also sensitive to the process of wet scavenging of aerosol, which controls the particle surface area in the FT and UT, and hence the
(a) Global mean CN
(b) Surface mean CN
(c) Surface mean CCN (0.2% supersaturation)
Fig. 20. Percentage change in air-mass weighted monthly mean CN
and CCN (at 0.2% supersaturation) concentrations during Decem-ber 1995 for changes in model parameters. Thick bars show global means and thin bars (b and c) show means over the oceans only. The model parameters were varied (left to right in the above panels) as follows: activation diameter for in-cloud oxidation – 0.04, 0.06, 0.08 µm (baseline model run 0.05 µm); accommodation coefficient – 0.65, 0.3, 0.02 (baseline 1.0); H2SO4nucleation threshold 2 and
0.5 times the baseline; nucleation critical cluster size – 50 and 10 molecules (baseline 100 molecules H2SO4); particulate emissions –
1, 3 and 5% of anthropogenic SO2(baseline 0%); cloud scavenging
activation diameter – 0.1 µm (baseline 0.206 µm); sulfur emissions – 75% and 125% of the baseline; sea spray emissions – 10 and 0.1 times the baseline flux.
D. V. Spracklen et al.: Identification of key uncertainties 3247 competition for available sulfuric acid vapour between
parti-cle formation and condensation to existing partiparti-cles. Global mean surface sulfate and sea salt CN concentra-tions in these simulaconcentra-tions are dominated by sulfuric acid aerosol and are most sensitive to uncertainties in primary sul-fate emissions and the accommodation coefficient. The low-est value of the sulfuric acid accommodation coefficient used here (ae=0.02) is probably an extreme choice, although even
a modest value of 0.3 (decreased from 1.0) increases mean MBL CN concentrations by 48%. Primary sulfate emissions have the potential to change the global mean surface sulfate CN concentration by a factor 2 or more (mean MBL CN changes by up to 75%), and changes of up to a factor 20 can occur in polluted regions. CN are also produced from non-sulfate sources. Further studies involving more aerosol types and sources are needed to put these sensitivities in context.
Changing microphysical processes within reasonable un-certainty ranges, changes predicted mean MBL sea salt and sulfate CCN concentrations by 10 to 60% and has a similar effect as uncertainties in emissions of sulfur species. Cloud processes are very important in controlling CCN concentra-tions. In-cloud oxidation (causing mass addition to aerosols by SO2 oxidation in droplets) moves aerosols from Aitken
mode sizes to the accumulation mode more rapidly than is achieved through condensation of sulfuric acid and coagu-lation. We have investigated how uncertainties in the acti-vation diameter of aerosols in clouds affects CCN at a par-ticular supersaturation. The activation diameter is in real-ity controlled by cloud-scale updraught velocities, which are difficult to predict in global models. Reasonable uncertain-ties in the activation diameter in our model lead to changes in global MBL sulfate and sea salt CCN concentrations of as much as 50% at a given supersaturation. Scavenging of aerosol by precipitating clouds also exerts a strong control on CCN abundances.
Sulfate-derived CCN concentrations are particularly sen-sitive to assumptions made about the production of pri-mary sulfate particles in pollution plumes below the scale of the model grid. Reasonable assumptions about the grid-mean concentration of such particles leads to uncertainties in global mean sulfate-derived CCN of as much as 40% (up to a 27% change in mean MBL sulfate and sea salt CCN), with local changes of more than 100% in polluted regions. This uncertainty is larger than the change in sulfate-derived CCN (about ±15% global surface mean) caused by a ±25% change in total sulfur emissions. Our model therefore sug-gests that the mode of sulfate emission is as important for CCN abundance as the magnitude. A large fraction of CCN-sized particles are likely to be composed of material other than sulfate and sea salt over continental regions. Here we as-sume that a 1–5% emission of SO2as particulates is used as
an estimate solely for sub-grid nucleation of sulfate in power plant plumes.
We have also shown that the altitude of the upper tropo-spheric CN layer is sensitive to a number of microphysical
processes. Changes in the nucleation rate, the condensation rate and the size of freshly nucleated clusters within realistic ranges leads to changes in the altitude of peak CN concen-trations by up to 3 km.
7 Implications and outlook
This study has focussed on the uncertainty in CN and CCN concentrations due to realistic uncertainties in the micro-physical processes that control the size distribution of sul-fate and sea salt aerosol. One might argue that the use of a global aerosol microphysics model (as opposed to a sim-pler aerosol parameterisation in a climate model) has simply extended the list of uncertain parameters without actually re-ducing the overall uncertainty. At this stage in the develop-ment and evaluation of aerosol microphysics models, this is true. However, it needs to be remembered that, ultimately, it is changes in the particle size distribution that determine the magnitude of the direct and indirect aerosol forcing. Our understanding of what controls changes in the aerosol size distribution is far from complete. Without such understand-ing we are not in a position to say that changes in forcunderstand-ing in the industrial period can be accurately predicted using mod-els that simulate only aerosol mass, which has been assumed in climate change attribution studies to date (Houghton et al., 2001). The temporal pattern of radiative forcing over the last 100 years is critical for the attribution of climate change. Further development of such microphysical models, the ad-dition of more aerosol components, and the improvement of schemes to treat the most uncertain processes is therefore es-sential.
The uncertainties in predicted sulfate and sea salt CCN are large compared with changes that are likely to be im-portant for the aerosol direct and indirect radiative forcing (Pan et al., 1997, 1998). For example, changes in lower at-mospheric global mean cloud drop number in response to changing aerosol emissions since 1860 are predicted by gen-eral circulation models to be of the order 70% (A. Jones, per-sonal communication). We estimate the uncertainty in global MBL mean sulfate and sea salt CCN concentrations to be as much as 60%, although the uncertainty in total CCN may be lower in a model that considers the complete range of pri-mary aerosol emissions.
A useful extension to this work in the context of climate change would be to quantify the extent to which these un-certainties restrict our ability to quantify changes in radia-tive forcing and cloud properties in response to changes in emissions. For example, whether the response of CCN to changes in sulfur emissions is different when high or low nu-cleation rates are used or if high or low primary sulfate emis-sions are assumed. We also need to determine whether any of these microphysical processes or the nature of emissions has changed over the last 100 years. For example, the con-tribution of primary sulfate aerosol to boundary layer CCN