HAL Id: hal-00299147
https://hal.archives-ouvertes.fr/hal-00299147
Submitted on 14 Feb 2005
HAL is a multi-disciplinary open access
archive for the deposit and dissemination of
sci-entific research documents, whether they are
pub-lished or not. The documents may come from
teaching and research institutions in France or
abroad, or from public or private research centers.
L’archive ouverte pluridisciplinaire HAL, est
destinée au dépôt et à la diffusion de documents
scientifiques de niveau recherche, publiés ou non,
émanant des établissements d’enseignement et de
recherche français ou étrangers, des laboratoires
publics ou privés.
Recent trends and climatic perspectives of hailstorms
frequency and intensity in Tuscany and Central Italy
F. Piani, Alexandre Crisci, G. de Chiara, G. Maracchi, F. Meneguzzo
To cite this version:
F. Piani, Alexandre Crisci, G. de Chiara, G. Maracchi, F. Meneguzzo. Recent trends and climatic
perspectives of hailstorms frequency and intensity in Tuscany and Central Italy. Natural Hazards and
Earth System Science, Copernicus Publications on behalf of the European Geosciences Union, 2005,
5 (2), pp.217-224. �hal-00299147�
Natural Hazards and Earth System Sciences (2005) 5: 217–224 SRef-ID: 1684-9981/nhess/2005-5-217
European Geosciences Union
© 2005 Author(s). This work is licensed under a Creative Commons License.
Natural Hazards
and Earth
System Sciences
Recent trends and climatic perspectives of hailstorms frequency and
intensity in Tuscany and Central Italy
F. Piani, A. Crisci, G. De Chiara, G. Maracchi, and F. Meneguzzo
Institute of Biometeorology, National Research Council, Via Caproni 8, I-50145 Firenze, Italy
Received: 1 July 2004 – Revised: 4 February 2005 – Accepted: 8 February 2005 – Published: 14 February 2005
Abstract. The damages from climatic extremes have
dramat-ically increased in the last decades in Europe, as likely out-comes of climate change: floods, droughts, heat waves and hailstorms have brought local as well as widespread damages to farmers, industry, infrastructures and society, to insurance and reinsurance companies; in this work we deal with the hailstorm hazard. The NCEP-NCAR Reanalysis (2.5 by 2.5◦ lat-lon) over the Italian area and the hailstorm reports at sev-eral sites are used to identify few forcings for hailstorms; statistical relationships linking forcings and hailstorm fre-quencies are derived. Such relationships are applied to the same forcings derived from the CGCM2-A2 climate scenario provided by the Canadian Centre for Climate modeling and analysis (CCCma; resolution approximately 3.75 by 3.75◦
lat-lon), to evaluate the expected changes of the frequency of hailstorms. The time series of the forcings from the NCEP-NCAR Reanalysis and the CCCma climate scenario in the past decades are compared in order to assess the reliability and accuracy of the predictions of the future hailstorm haz-ard.
It is shown that the climate scenario provides a fairly faith-ful representation of the past trends of the forcings relevant to the hailstorms frequency and that such quantity, hence the hailstorm hazard, is growing and will likely grow in the future over the limited area taken into consideration in this study.
1 Introduction
Climatic extremes, like floods, heat waves and hailstorms, have increased in the last decades in Europe (Munich Re., 1999; Brunetti et al., 2002; Coleman, 2003), likely as re-sults of the ongoing climate change, although some authors attribute this growing to a new increased sensitivity in the Society (Pielke, 2004). Such dangerous events produce
dam-Correspondence to: F. Piani
ages to several components of the society such as farming, industry, infrastructures, insurance and reinsurance compa-nies, as well as to the larger communities.
Among climatic extremes events, besides floods and thun-derstorms, hailstorms deserve a particular attention even if their effects affect limited areas compared to those affected by other extremes.
Insurance companies that have to refund these damages often have neither sufficient data bases nor clear cut scientific bases to build the respective prize structure upon.
It is known (Brimelow et al., 2002) that damages are re-lated to the logarithm of the kinetic energy due to the fact that, for a spherical particle with diameter d, the kinetic energy is proportional to d4. The insufficient information for this type of events is obvious when looking at the ta-bles that relate the description of the event to the typical grain dimensions and the potential damages. In particular, the so-called “Torro Hailstorms Intensity Scale”, obtained in 1986 by J. Webb, has revealed very useful to obtain informa-tion about the dangerousness of hailstorms. Scale is avail-able on the web page of TORnado and storm Research Or-ganisation (http://www.torro.org.uk/TORRO/severeweather/ hailscale.php).
In 1995 in Forth Worth, Texas, the “Mayfest” hailstorm produced US$ 2 billion in damage and 109 injuries with the largest hail sizes over 11 cm.
Despite the huge efforts, the prediction of hailstorms is still approximate, with a far lower accuracy than the pre-diction of thunderstorms (Edwards and Thompson, 1998). Countries such as USA and New Zealand have effective hail-storm survey and prediction services: the National Weather Services (NWS) have defined provisional methods for hail-storms with grains up of 1.9 cm. In Europe such detailed services miss, resulting in the lack of continuous and homo-geneous measurements over most of the European Countries. In Italy, only the Regions of Trentino Alto Adige and Friuli Venezia Giulia manage networks for the monitoring of hail frequency and size (Giaiotti et al., 2001, 2003). In Austria, Bulgaria, Greece and part of France (Dessens et al., 1994)
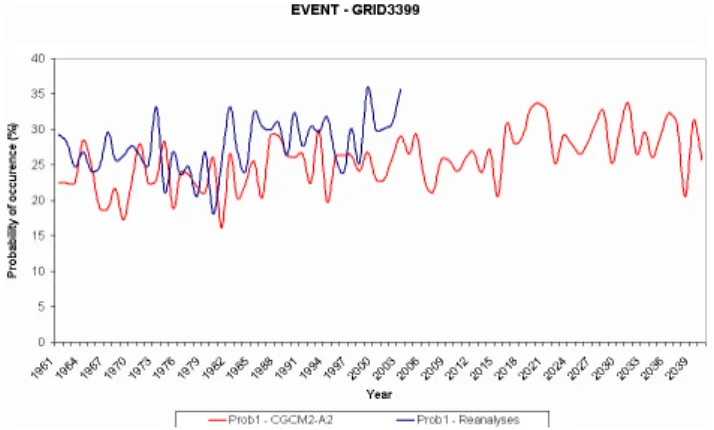
218 F. Piani et al.: Recent trends and climatic perspectives # # # # # # # # # # # # # # # # # # # # # # # # # # # # # # # # # # # # # # # # # # # # # # # # # # # # # # # # GRID3399
Fig. 1. Reanalysis Grids (2.5◦×2.5◦Lat-Lon, black) and CCCma Scenario Grids (3.75◦×3.75◦Lat-Lon, red) over Italian area with indication of the grid considered to present results of analysis.
similar monitoring networks exist. In this study, being atten-tion focused over Tuscany and Central Italy, a serious valida-tion is impracticable; an accurate validavalida-tion phase could be made only extending this work to parts of Italy as well as of Europe, where detailed information from such networks are available.
Several studies were performed on statistical methods to evaluate the hailstorms frequency. Recent papers showed that radar and rawinsonde data improve the reliability of the predictions, because they supply observed value for upper-air variables. Green and Clark (1972) produced a funda-mental work: for the first time they showed that the Verti-cally Integrated Liquid (VIL) could be used as a predictor of hailstorm occurrence. Two papers from Kitzmiller and Breindenbach (1993, 1995) faced the problem of central and southern Plains (USA) hailstorm prediction using few atmo-spheric variables such as VIL, melting level, 50 hPa zonal wind components (the latter quantity was shown in the sec-ond paper not to be a pure hail indicator but rather a signifi-cant severe weather indicator) and surface relative humidity. Danielsen (1977) showed the importance of the mixing ratio in place of the relative humidity in hailstorm frequency and hail grain dimension.
Some of the atmospheric variables used in this work, dur-ing a 1.5 years project funded by a big multi-national Insur-ance Company to derive the hailstorm frequency over Italy at the Municipality level, are the same used by Billet et al. (1997) in the frame of the very short term prediction of the probability of large hail.
To our knowledge, only few papers have afforded the anal-ysis of observed or reconstructed time series of hailstorm fre-quency or the prediction of hailstorm frefre-quency with the use of a climate scenario (Changnon, 1997). The specific objec-tive of this research is the prediction of the future trends of
the frequencies of hailstorms over Italy, pursued by means of a statistical approach based upon the available hailstorm data, global Reanalysis and a climate scenario.
2 Data and methods
In Italy, as well as in other areas in Europe and worldwide, no homogeneous time series of hailstorms are available, due to the lack of organized and sustained measurement networks, with the result that partially reliable information are avail-able only through media reports. All the regional editions of the newspapers have been examined to find out news about the occurrence and features of hailstorms. Contacts with all the regional Meteorological Centres have been activated as well, to gather at least a preliminary indication of hailstorms occurrence and hail grain dimensions. All the events regis-tered by the Meteorological Centres and those reported in the newspapers have been taken into consideration. Because of the high degree of subjectivity in evaluating the events into consideration, especially concerning the hail grains dimen-sions, the accuracy is at least questionable; anyway, multiple references were looked whenever possible, at least for Tus-cany.
The collected reports have been geo-located for the years 2001 and 2002.
The NCEP-NCAR daily Reanalysis (Kalnay et al., 1996; Kistler et al., 2001), with a spatial horizontal resolution of 2.5◦×2.5◦lat-lon, are used to determine the forcings for hail-storms, partly following the ideas by Brooks et al. (2003); the same forcings are derived from the CGCM2-A2 climate scenario (Flato and Boer, 2001; spatial horizontal resolution of 3.75◦×3.75◦lat-lon) provided by the Canadian Centre for
Climate modelling and analysis (CCCma), to derive the ex-pected changes of the hailstorm frequencies.
These data are derived from a second generation coupled model (CGCM2) on the basis of the emissions scenarios IPCC SRES “A2” (fast population growth, rather slow eco-nomic and technological development, Watson, 2001).
The relevant atmospheric quantities which are potentially associated to the hailstorms frequency and the hail grain size and can be simply computed from both the NCEP-NCAR Reanalysis and the CCCma scenario, are the following (Bil-let et al., 1997):
– Lapse Rate (LR, difference between the temperature at
850 hpa and at 500 hpa);
– Precipitable Water (PW, water vapor content in the
col-umn of atmosphere from 850 hpa to 500 hpa);
– Relative Humidity (RH, ratio between environmental
vapor pressure and saturated vapor pressure, averaged at the levels 850 hpa and 500 hpa).
Due to the different spatial resolution of the two global datasets (Fig. 1), an interpolation algorithm based on the in-verse squared distances was used to resample the finer
Re-F. Piani et al.: Recent trends and climatic perspectives 219
Table 1. Comparison of the order statistics and average values of the relevant atmospheric quantities in the cases of “events” (hailstorms)
and “no events”. The second and third columns show the actual values of the z statistics, and their critical values at the 99% statistical significance level; the fourth and fifth columns show the average values of the same quantities in the two opposite situations.
zstatistics zstatistics Average values in Average values in observed value critical value “events” “no events”
LR 6.297 2.326 27.99 25.37
PW 5.644 2.326 13.78 9.95
RHM 0.318 2.326 45.28 45.28
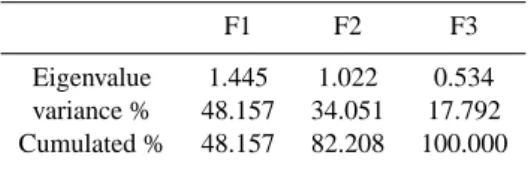
Table 2. Eigenvalues matrix with the explained variance.
F1 F2 F3
Eigenvalue 1.445 1.022 0.534
variance % 48.157 34.051 17.792 Cumulated % 48.157 82.208 100.000
analysis data over the coarser grid of the CGCM2-A2 climate scenario.
As a preliminary statistical analysis, atmospheric condi-tions, described by means of the set of the above mentioned variables and associated with hailstorms, are compared with those associated to no-hail events, with the help of the Mann-Whitney non-parametric test (Wilks, 1995), to understand whether the two samples belong to the same statistical pop-ulation. In other words, such test helps evaluate whether the three atmospheric variables do significantly differ in the two opposite situations; to this purpose, the z order statistics are used, accounting for the ranks of the single realizations of the above mentioned variables during events (hailstorms) and no events, compared with their critical value at the 99% signifi-cance level, in turn depending only on the length of the series (Wilks, 1995).
The first result of the study is that the Lapse Rate and the Precipitable Water are significantly different, whilst the Rel-ative Humidity is not, as is shown in Table 1; the average values of the same quantities in the case of “events” (hail-storms”) and “no events” are shown too.
Most atmospheric variables are mutually correlated, either in space or in time, or both; the Pearson correlation test is ap-plied to the pairs of series of the considered variables, show-ing that the pairs PW and RHM, PW and LR are linearly cor-related with a statistical significance level higher than 95%, the former with a greater correlation coefficient (36%) than the latter (28%), whilst the RHM and LR are not (correlation coefficient 2%).
Since these forcings are mutually correlated, a Principal Component Analysis (Wilks, 1995; Von Storch and Zwiers, 1999) was performed to identify the orthogonal (indepen-dent) directions (eigenvalues, Table 2, and eigenvectors, Ta-ble 3) of the standardized variaTa-bles; the three original mutu-ally correlated atmospheric variables are projected onto three
Table 3. Eigenvector matrix.
F1 F2 F3
LR 0.428 0.783 −0.451
PW 0.715 0.011 0.699
RHM 0.552 −0.622 −0.556
Table 4. Coefficient of projection of the three principal directions
on the discriminant axis.
Variable F
F1 0.617
F2 0.621
F3 0.328
new independent variables, which respective link to the hail-storm frequency and size can be investigated and interpreted; all PCs are retained in order to preserve the whole original information, half of the variance (as explained by the first PC) not being considered sufficient to explain the changes of the conditions underlying the hailstorm events.
An interesting feature is the positive sign of all the eigen-vector components of the first PC (F1): it means that it projects positively on all the considered atmospheric quan-tities; recalling that PW and LR were significantly higher during hailstorms, it is not surprising that the same behav-ior is followed by F1. Its average value during hailstorms is 0.965, whilst in “no events” is −0.002.
Note that the Relative Humidity is not significantly (from a statistical point of view) different in case of “events” (hail-storms) and “no events”, therefore it is not a ”leading” phys-ical quantity for F1; in other words, the projection of F1 onto the discriminant direction is driven mostly by the Pre-cipitable Water and the Lapse Rate.
A Discriminant Analysis (Wilks, 1995; von Storch and Zwiers, 1999) was further applied to the principal compo-nents (forcings) to identify the range of their values under which the hailstorms occur and the discriminant direction (Table 4); such analysis also allows to assign the probabil-ity of hailstorms; the relationship between the discriminant direction F and the Probability of event, y, is a sinusoidal
220 F. Piani et al.: Recent trends and climatic perspectives
Fig. 2. Annual trend of hailstorm frequency.
Fig. 3. Annual values of Lapse Rate.
function of the discriminant direction and, hence, of the three atmospheric variables:
y=
0.49−0.14 · cos(2π · (−0.09) F )−0.43 · sen(2π · (−0.09) F ), (1) where F is the discriminant direction.
This relationship derives from the application of a non-linear regression to the probability of event (obtained by the application of Discriminant Analysis), using the Discrimi-nant Direction as independent variable. This equation max-imizes the R2 coefficient, that reaches a very high value (0.999). Notice that R2coefficient represents the explained variance of a particular event. Non-linear regression was used because of the complexity of the particular phenomenon examined.
All the information needed to derive the probability of hailstorm events for the past and the future is now available: the forcings, computed from the Reanalysis or the climate scenario, can be projected onto the three principal directions, which in turn are projected onto the discriminant direction
F to derive the probability of event (the probability of no event is the complimentary to 1 of the probability of event). This process, repeated for every day in the considered peri-ods (1961–2003 for the NCEP-NCAR Reanalysis and 1961– 2040 for the CGCM2-A2 scenario) and grid mesh (spatial horizontal resolution of 3.75◦×3.75◦ lat-lon) covering the
Fig. 4. Annual values of Precipitable Water.
Fig. 5. Annual values of Relative Humidity.
Italian area, allows to compute the annual and seasonal prob-abilities of occurrence.
The time series of the forcings from the NCEP-NCAR Re-analysis and the CCCma climate scenario in the past decades (1961–2003) are compared in order to assess the reliability of the climate scenario with regard to the hailstorm hazard.
Several important cautions have to be taken about this re-search:
– Homogeneous hailstorm time series, that should be used
as a reference to assess the past trend of the events, are missing; the large scale model Reanalysis are used in their place, with no possibility of direct comparison with observations;
– The hail frequency shown should be considered as a
“relative frequency”: the attention has to be focused on trends rather than on the absolute values;
– Only a particular grid mesh that covers Tuscany and
other districts in Central Italy (Fig. 1) is considered; analyses on other grid meshes are left to a further work. The trends of the annual and seasonal probability of events are computed with the aim to evaluate the tendencies of the hailstorm hazard; hailstorms follow a relevant seasonal cy-cle, occurring especially in the warm season, roughly March
F. Piani et al.: Recent trends and climatic perspectives 221
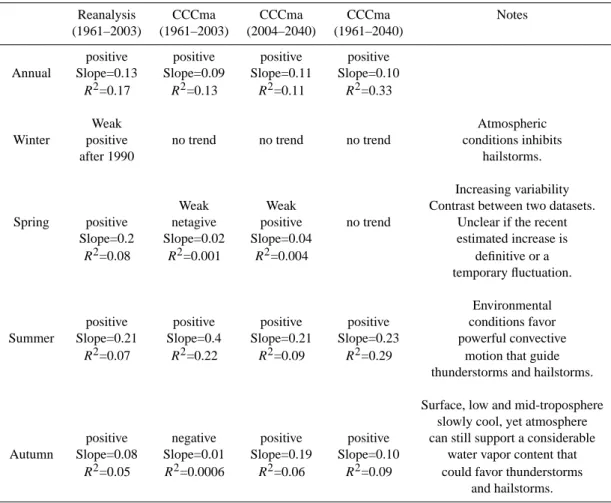
Table 5. Summary of the results on hailstorms occurrences. Only trends significant at the 95% level are reported.
Reanalysis CCCma CCCma CCCma Notes
(1961–2003) (1961–2003) (2004–2040) (1961–2040)
positive positive positive positive
Annual Slope=0.13 Slope=0.09 Slope=0.11 Slope=0.10
R2=0.17 R2=0.13 R2=0.11 R2=0.33
Weak Atmospheric
Winter positive no trend no trend no trend conditions inhibits
after 1990 hailstorms.
Increasing variability
Weak Weak Contrast between two datasets.
Spring positive netagive positive no trend Unclear if the recent
Slope=0.2 Slope=0.02 Slope=0.04 estimated increase is
R2=0.08 R2=0.001 R2=0.004 definitive or a
temporary fluctuation. Environmental
positive positive positive positive conditions favor
Summer Slope=0.21 Slope=0.4 Slope=0.21 Slope=0.23 powerful convective
R2=0.07 R2=0.22 R2=0.09 R2=0.29 motion that guide
thunderstorms and hailstorms. Surface, low and mid-troposphere
slowly cool, yet atmosphere positive negative positive positive can still support a considerable Autumn Slope=0.08 Slope=0.01 Slope=0.19 Slope=0.10 water vapor content that
R2=0.05 R2=0.0006 R2=0.06 R2=0.09 could favor thunderstorms and hailstorms.
or April to November or December, when the environmen-tal conditions, in particular the northern Mediterranean sea surface temperature, allow the triggering and development of convective thunderstorms, which are natural precursors of hailstorms.
In the present study, the winter season is defined as Jan-uary to March, when hailstorms are least likely.
A low-pass filter (5-years moving average) is also applied, to reduce the higher frequency variability (noise) that can hide existing linear correlations and trends.
3 Results
In Table 5 are summarized the main results of this study. The reliability of the trends computed for the variables derived from the CCCma scenario is assessed after the comparison with the trends of the same variables derived from the Re-analyses, during the same multi-decadal period (1961–2003). As well, the trends forecast for the next decades (2004– 2040), and for the whole period (1961–2040) for the CCCma scenario variables are reported (only linear trends significant at least at the 95% level are shown). After removing the inter annual variability by means of a 5-year linear moving aver-age, the trends reported above show nearly the same trends,
on annual as well as seasonal basis, confirming the stability of the tendencies.
Only long-term trends are inter-compared, to show the possible impact of the slowly changing of the atmospheric composition, beyond the higher frequency climatic noise, on the hailstorms forcings and probability; such effects could not of course be revealed by a straightforward comparison of seasonal or annual values.
The Reanalyses and the Scenario produce the same trends in summer and over the whole year, while differences are revealed in spring and autumn, when the trends seasons are anyway very small (not shown).
Figure 2 represents the annual frequency of hailstorm fre-quency.
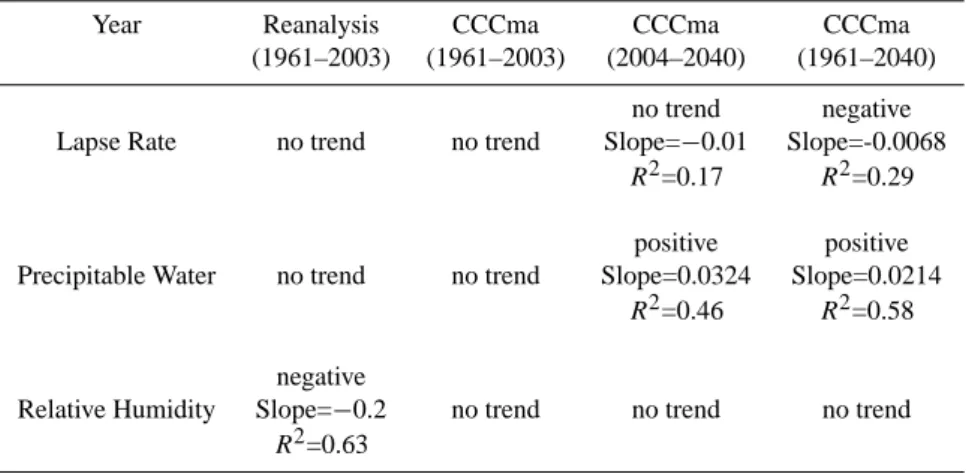
Trend analyses are applied to the original forcings as well (Lapse Rate, Precipitable Water and Relative Humidity), lim-ited to the annual and Summer averages, in an attempt to as-sess their respective future tendencies and considering their respective role in driving the probability of hailstorms; the seasonal analysis of tendencies of the three considered forc-ings has been developed only for the Summer season, when the probability of hailstorms is at its maximum.
Table 6 and Figs. 3 to 5 summarize the annual trends; Ta-ble 7 shows the summer trends, as do the Figs. 6 to 8.
222 F. Piani et al.: Recent trends and climatic perspectives
Table 6. Annual trends of the original atmospheric variables. Only trends significant at the 95% level are reported.
Year Reanalysis CCCma CCCma CCCma
(1961–2003) (1961–2003) (2004–2040) (1961–2040)
no trend negative
Lapse Rate no trend no trend Slope=−0.01 Slope=-0.0068
R2=0.17 R2=0.29 positive positive Precipitable Water no trend no trend Slope=0.0324 Slope=0.0214
R2=0.46 R2=0.58 negative
Relative Humidity Slope=−0.2 no trend no trend no trend
R2=0.63
Fig. 6. Summer values of Lapse Rate.
Fig. 7. Summer values of Precipitable Water.
4 Conclusions
The research allows to identify the following likely fate for the hailstorm hazard over the considered area in Italy:
– The climate scenario has a fairly good agreement with
the Reanalysis over the study area, with regard to those forcings that are relevant to the occurrence of hail-storms, especially in the warm season, which sheds
Fig. 8. Summer values of Relative humidity.
some light of confidence in the climate predictions into the next decades;
– The annual probability of occurrence of hailstorms will
likely increase in the next future, both on an annual and multi-annual time basis;
– The hailstorm hazard in Spring will likely increase in
the future, even if far more slowly than the observed recent rapid growth;
– In Summer, the growing trend of the hailstorm
fre-quency is detectable since the second half of the 1970’s, and will likely be stationary or weakly growing in the future, at higher levels than only 20 years ago;
– In Autumn, the observed recent weak increase of
hail-storm frequency is not represented by the climate sce-nario, which on the other hand projects it into the future;
– The two most important forcings of the hailstorm
fre-quency, that is the Lapse Rate and the Precipitable Wa-ter, show a discordant behaviour in the future: the Lapse Rate generally decreases, while the Precipitable Water generally increases, the latter being moderately domi-nant with regard to the hailstorm frequency trends.
F. Piani et al.: Recent trends and climatic perspectives 223
Table 7. Summer trends of the original atmospheric variables. Only trends significant at the 95% level are reported.
Year Reanalysis CCCma CCCma CCCma
(1961–2003) (1961–2003) (2004–2040) (1961–2040)
no trend negative
Lapse Rate no trend no trend Slope=−0.01 Slope=-0.0068
R2=0.17 R2=0.29 positive positive Precipitable Water no trend no trend Slope=0.0324 Slope=0.0214
R2=0.46 R2=0.58 negative
Relative Humidity Slope=−0.2 no trend no trend no trend
R2=0.63
The hailstorm hazard is thus growing, and will likely con-tinue increasing in the next decades, mostly due to Spring and, at a lower level, Autumn and Summer seasons, posing serious concerns to the safety of the seasonal crops and to the insurance policies.
It is to be stressed again that the results described above have to be taken with caution, mostly due to the fact that the hailstorms frequency trends in the past are derived on the basis of the Reanalysis data by means of statistical al-gorithms calibrated on a small size observational data base (two years), due to the lack of homogeneous and continu-ous hailstorm data over the area of interest. Results are as well affected by uncertainties due to the coarse resolution of the atmospheric gridded datasets (3.75◦×3.75◦Lat-Lon), compared to the typically small spatial scale relevant to the occurrence and features of hailstorm events.
Further uncertainties derive from using a single model grid mesh and a single global climate model.
In order to more effectively separate the underlying signal from the inherent climatic noise, densely and continuously monitored areas should be considered for the application and validation of the herein described methodology and algorithms.
Edited by: U. Ulbrich Reviewed by: two referees
References
Billet, J., DeLisi, M., and Smith, G.B.: Use of regression techniques to predict hail size and the probability of large hail. Weather and Forecasting, 12, 1, 154–164, 1997.
Brimelow, J. C., Reuter, G. W., and Poolman, E. R.: Modeling max-imum hail size in Alberta thunderstorms, Weather and Forecast-ing, 17, 5, 1048–1062, 2002.
Brooks, H. E., Lee, J. W., and Craven J. P.: Developing global climatologies of severe thunderstorms from Reanalysis-derived soundings, 14thSymposium on Global Change and Climate
Vari-ations, American Meteorological Society 83rd Annual Meeting, Long Beach (CA-USA), 2003.
Brunetti, M., Maugeri, M., Nanni, T., and Navarra, A.: Droughts and extreme events in regional daily italian precipitation series, Int. J. Climatol., 22, 5432–316, 2002.
Changnon, S. A.: Trends in hail in the United States, Proc. Work-shop on the Societal and Economic Impacts of Weather, Boulder, CO, NCAR, 19–31, 1997.
Coleman, T.: The impact of climate change on Insurance against catastrophes. Preprints of 2003 Biennial Convention of The In-stitute of Actuaries of Australia, 2003.
Danielsen, E. F.: Inherent difficulties in hail probability prediction, Meteorol. Monogr., Am. Met. Soc., 38, 135–143, 1997. Dessens, J. and Fraille R.: Hailstone size distributions in the
south-west of France. Atmos. Res., 33, 57–73, 1994.
Downton, M., Miller, J. Z. B., and Pielke Jr., R. A.: A Reanalysis of the U.S. National Flood Loss Database, Natural Hazards Review, in press, 2005.
Edwards, R. and Thompson, R.: Nationwide Comparisons of Hail Size with WSR-88D Vertically Integrated Liquid Water and De-rived Thermodynamic Sounding Data, Weather and Forecasting, 13, 2, 277–285, 1998.
Flato, G. M. and Boer, G. J.: Warming Asymmetry in Climate Change Simulations, Geophys. Res. Lett., 28, 195–198, 2001. Giaiotti, D., Gianesini, E., and Stel, F.: Heuristic considerations
pertaining to hailstone size distributions in the plain of Friuli Venezia Giulia, Atmos. Res., 57, 269–288, 2001.
Giaiotti, D., Nordico S., and Stel, F.: The climatology of hail in the plain of Fiuli Venezia Giulia, Atmos. Res., 67–68, 247–259, 2003.
Greene, D. R. and Clark, R. A.: Vertically integrated liquid—A new analysis tool, Mon. Wea. Rev., 100, 548–552, 1972.
Houghton, J.: The Physics of Atmospheres, 3rd Ed., Cambridge University Press (paperback), 336, 2002.
Kalnay E., Kistler, R. E., Collins, W. et al.: The NCEP-NCAR 40-Year Reanalysis Project, Bull. Am. Met. Soc., 77, 437–471, 1996.
Kistler R. E. Kalnay, E.; Collins, W. et al.: The NCEP–NCAR 50-Year Reanalysis: Monthly Means CDROM and Documentation, Bull. Am. Met. Soc., 82, 247–268, 2001.
Kitzmiller, D. H. and Breidenbach, J. P.: Probabilistic nowcasts of large hail based on volumetric reflectivity and storm
environmen-224 F. Piani et al.: Recent trends and climatic perspectives
tal characteristics, Preprints, 26th Conf. on Radar Meteorology, Norman, OK, Am. Met. Soc., 157–159, 1993.
Kitzmiller, D. H. and Breidenbach, J. P.: Detection of severe local storm phenomena by automated interpretation of radar and storm environment data, NOAA Tech. Memo. NWS TDL 82, 33, 1995 (available from National Oceanic and Atmospheric Administra-tion, U.S. Department of Commerce Office of Systems Develop-ment (W/OSD2), 1325 East–West Highway, Silver Springs, MD 20910.).
Munich Re.: Review of natural disasters 1999, Report No. 2946-M-e, 2000.
Stull, R. B.: Meteorology for Scientists and Engineers, 2nd Ed. Brooks/Cole Thomson Learning, (paperback), 502, 2000. Von Storch, H. and Zwiers, F. W.: Statistical Analysis in Climate
Research, Cambridge University Press, 484, 1999.
Watson, R. T., the Core Writing Team: IPCC Third Assessment Report: Climate Change 2001, Stand-alone Edition, 2001. Wilks, D. S.: Statistical Methods in the Atmospheric Sciences: an
Introduction, International Geophysics Series, Academic Press, 59, 464, 1995.