HAL Id: hal-03044604
https://hal.archives-ouvertes.fr/hal-03044604
Submitted on 7 Dec 2020
HAL is a multi-disciplinary open access
archive for the deposit and dissemination of
sci-entific research documents, whether they are
pub-lished or not. The documents may come from
teaching and research institutions in France or
abroad, or from public or private research centers.
L’archive ouverte pluridisciplinaire HAL, est
destinée au dépôt et à la diffusion de documents
scientifiques de niveau recherche, publiés ou non,
émanant des établissements d’enseignement et de
recherche français ou étrangers, des laboratoires
publics ou privés.
Arthur Mouragues, Philippe Bonneton, Bruno Castelle, Vincent Marieu, R
Jak Mccarroll, Isaac Rodriguez-padilla, Tim Scott, Damien Sous
To cite this version:
Arthur Mouragues, Philippe Bonneton, Bruno Castelle, Vincent Marieu, R Jak Mccarroll, et al..
High-Energy Surf Zone Currents and Headland Rips at a Geologically Constrained Mesotidal Beach. Journal
of Geophysical Research. Oceans, Wiley-Blackwell, 2020, 125, �10.1029/2020jc016259�. �hal-03044604�
High-Energy Surf Zone Currents and Headland Rips at a
Geologically Constrained Mesotidal Beach
Arthur Mouragues1 , Philippe Bonneton1, Bruno Castelle1 , Vincent Marieu1 , R. Jak McCarroll2 , Isaac Rodriguez-Padilla1, Tim Scott2 , and Damien Sous3,4
1University of Bordeaux; CNRS; UMR 5805 EPOC, Pessac, France,2Coastal Processes Research Group, School of Biological and Marine Sciences, University of Plymouth, Plymouth, UK,3University of Toulon; Aix Marseille University; CNRS; IRD; Mediterranean Institute of Oceanography (MIO), La Garde, France,4University Pau and Pays Adour; E2S UPPA; Chaire HPC-WAVES; SIAME, Anglet, France
Abstract
We analyze Eulerian and Lagrangian measurements of wave-induced circulation collected during a 3-week field experiment at a high-energy mesotidal barred beach with the presence of a 500-m headland and a submerged reef. Small changes in wave and tide conditions were found to largely impact circulation patterns. Three main regimes were identified depending on offshore wave obliquity: (1) Under shore-normal configuration, the flow was dominated by cross-shore motions, except for moderate waves at low tide, with the presence of a quasi-steady circulation cell on the reef. (2) Under shadowedconfiguration, an onshore-directed current flowing away from the headland and a weak oscillating eddy were present outside and inside the shadow region, respectively. (3) Under deflection configuration, a deflection rip flowing against the headland and extending well beyond the surf zone was present, with activity maximized around low tide for moderate waves. Under 4-m oblique waves, the deflection rip was active regardless of the tide with mean depth-averaged velocities up to 0.7 m/s 800-m offshore in 12-m depth, with energetic low-frequency fluctuations. Our results emphasize the ability of deflection rips to transport materials far offshore, suggesting that such rips can transport sediment beyond the depth of closure. This study indicates that a wide variety of wave-driven circulation patterns can occur and sometimes coexist on beaches with prominent geological settings. Changes in the dominant driving mechanism can occur as a result of small changes in wave and tide conditions, resulting in more spatially and temporally variable circulation than along open sandy beaches.
Plain Language Summary
Most field experiments about wave-induced circulation patterns have been conducted along open sandy beaches, while experiments in geologically constrained environments are scarce. We performed intensive field measurements at a high-energy beach with the presence of a 500-m headland and a submerged natural reef. Three main circulation patterns were identified depending on the offshore wave obliquity. For shore-normal waves, cross-shore motions dominated the nearshore region, while oblique wave configurations resulted in more complex horizontal circulation. In particular, under intense headland-directed longshore current, the flow was deflected seaward against the headland. This deflection resulted in an intense seaward flowing jet (deflection rip) extending well beyond the surf zone edge, particularly during storm conditions. Such findings highlight the ability of these deflection rips to dominate water and sediment exchanges between the nearshore and the inner shelf region. Our study further outlines the more spatially and temporally variable circulation patterns occurring along geologically constrained beaches compared to open sandy beaches, ranging from small recirculating cells across the reef to a large deflection rip extending hundreds of meters beyond the surf zone.1. Introduction
Wave breaking is the main driver for nearshore currents and sediment transport along wave-dominated coasts. Alongshore variations in breaking wave heights are among the major driving mechanisms for surf zone circulations such as rip currents (Bowen, 1969). These alongshore variations can arise from various causes (Castelle et al., 2016), which commonly include alongshore variations in surf zone morphology (channel rips; e.g., Bruneau et al., 2009), offshore wave energy focusing induced by wave refraction due to
RESEARCH ARTICLE
10.1029/2020JC016259
Key Points:
• In situ measurements are analyzed to identify the main circulation patterns occurring at a high-energy geologically constrained • Small changes in offshore wave
height and obliquity or tide elevation were found to impact circulation patterns across the entire field
• This study emphasizes the ability of deflection rips to extend far offshore, particularly during very energetic oblique wave conditions
Supporting Information: • Supporting Information S1 • Movie S1 • Movie S2 • Movie S3 • Movie S4 • Movie S5 • Figure S1 Correspondence to: A. Mouragues, arthur.mouragues@u-bordeaux.fr Citation:
Mouragues, A., Bonneton, P., Castelle, B., Marieu, V.,
McCarroll, R. J., Rodriguez-Padilla, I., et al. (2020). High-energy surf zone currents and headland rips at a geologically constrained mesotidal beach. Journal of Geophysical
Research: Oceans, 125, e2020JC016259. https://doi.org/10.1029/2020JC016259
Received 25 MAR 2020 Accepted 3 OCT 2020
Accepted article online 14 OCT 2020
©2020. The Authors.
This is an open access article under the terms of the Creative Commons Attribution License, which permits use, distribution and reproduction in any medium, provided the original work is properly cited.
offshore bathymetric variations (focused rips; e.g., Dalrymple et al., 2011) and shadowing effect induced by the presence of a rigid boundary (shadow rips; e.g., Gourlay, 1974; Pattiaratchi et al., 2009). Deflection effect can also induce rip currents along boundaries (deflection rips; e.g., Scott et al., 2016). These bathy-metrically and boundary-controlled mechanisms induce rip currents that are relatively persistent in space and time. On the other hand, transient flash rips can arise on beaches with weak topographic control, such as alongshore-uniform beaches, and are solely controlled by the hydrodynamic forcing (Feddersen, 2014). Depending on the beach characteristics and offshore wave forcing, transient flash rips are typically driven by shear instabilities of longshore currents (Ozkan-Haller & Kirby, 1999) and by vorticity generated by short-crested wave breaking (Johnson & Pattiaratchi, 2006). There is a natural continuum from weakly bathymetrically controlled rips, such as transient rips, to strongly bathymetrically controlled rips, such as channel rips (McCarroll, Brander, et al., 2018). Hence, some of the above-mentioned mechanisms may act together to produce rip currents and surf zone circulations at different spatial and temporal scales (Castelle et al., 2016).
Most rip current studies have focused on the dynamics of persistent channel rips on alongshore-variable open sandy beaches (e.g., Austin et al., 2010; Bruneau et al., 2009) or transient flash rips on alongshore-uniform open sandy beaches (e.g., Castelle et al., 2014; Johnson, 2004; Murray et al., 2013). Channel rips have received much more attention than flash rips owing to their predictable nature and their ubiquity along wave-dominated coastlines. Depending on the incident wave obliquity, two flow patterns are commonly observed on alongshore-variable open sandy beaches: counter-rotating circulation cells for shore-normal waves and a sinuous longshore current for oblique waves (MacMahan et al., 2010). However, these classic flow patterns can become complex with the presence of strong geological constraints (e.g., headlands, reef, and submarine canyons), which is typical of embayed beaches where many forms of rips may occur, such as boundary-controlled rips, hereafter referred to as headland rips.
Embayed beaches are ubiquitous along rugged coastlines (Loureiro et al., 2012b; Scott et al., 2011; Short, 2010) and can be characterized by different overall circulation regimes. Short and Masselink (1999) categorized embayed beach circulations as (1) normal circulation, in case of a narrow surf zone compared to the embayment, with rip currents present along the embayment which are not affected by headland rips; (2) cellular circulation, in case of a wide surf zone, compared to the embayment, with headland rips present at both ends of the embayment or one single rip current occurring in the middle of the embayment. Such a classification only depends on surf zone and embayment respective widths and does not account for the off-shore wave obliquity. Yet, the latter affects the induced hydrodynamics along the embayment, in particular, by favoring a cellular circulation as the offshore wave obliquity increases (Castelle & Coco, 2013).
While several studies have looked at embayment-scale circulation by tracking morphological changes (e.g., Loureiro et al., 2012a, 2012b) and through modeling on idealized bathymetries (Castelle & Coco, 2012, 2013), very few studies have relied on in situ velocity measurements along embayed beaches (e.g., McCarroll et al., 2014), and almost none of them have been conducted under high-energy wave conditions. In par-ticular, there is a lack of multiday circulation field data (GPS drifters) in waves over 2 m as measurements in such high-energy conditions are very challenging. In addition, field data-based studies looking at surf zone currents in the vicinity of embayment boundaries where headland rips can be present are scarce (Coutts-Smith, 2004; McCarroll et al., 2014; Pattiaratchi et al., 2009; Scott et al., 2016; Sous et al., 2020). Headland rips are offshore-directed currents flowing against a boundary (e.g., headlands and groynes) and are driven by different mechanisms depending on the offshore wave obliquity with respect to the boundary (Castelle et al., 2016): (a) the seaward deflection of the alongshore current against the boundary (deflection rip) and (b) alongshore variations in wave breaking induced by shadowing effect of the bound-ary, generating a seaward flow against the boundary (shadow rip). Headland rip experimental studies are scarce and are generally associated with low- to moderate-energy offshore wave conditions, except for the unpublished work of Coutts-Smith (2004) and the present field experiment. Yet, headland rips are known to potentially extend much further offshore than most of the other rip types (Castelle & Coco, 2013; Scott et al., 2016). In addition, low-frequency fluctuations of headland rips have never been addressed with the exceptions of, for instance, Pattiaratchi et al. (2009), who measured low-frequency pulsations of a shadow rip using one single current profiler, and the unpublished work of Coutts-Smith (2004), who deployed cur-rent profilers offshore an embayment. More recently, Sous et al. (2020) measured low-frequency pulsations of headland rips using one single current profiler deployed at the same field site as in this study. These
Journal of Geophysical Research: Oceans
10.1029/2020JC016259
low-frequency fluctuations can be very energetic during storm events, potentially leading to very intense headland rips offshore, as scarcely touched upon by Coutts-Smith (2004). Of note, low-frequency fluctua-tions of surf zone currents have been extensively addressed along open rip-channeled sandy beaches, with flow velocities typically oscillating at frequencies within the infragravity band (0.004–0.04 Hz; e.g., MacMa-han, 2004a) and within the very low frequency (VLF) band (<0.004 Hz; e.g., Bruneau et al., 2009; Elgar et al., 2019). Characteristic periods of low-frequency motions measured in the field typically range from O(1) to O(10) min.The above headland rip mechanisms have been mostly established for idealized configurations with, for instance, alongshore-uniform sandy beach morphologies and/or well-defined boundaries (e.g., groynes). However, rugged coastlines are generally characterized by prominent geological constraints (Short, 2010) with the presence of natural rocky headlands and emerged and submerged rocks (e.g., reef) and can also comprise rip-channeled sandy beach morphologies. Such complex morphological configurations are then likely to induce a large spectrum of circulation patterns, which include headland rips and bathymetrically controlled rips with a potential competition/combination between one another. In the case of natural head-lands, the degree of morphological complexity can substantially hinder headland rip driving mechanisms, leading to significant discrepancies between the idealized headland rip patterns and actual observations and measurements, particularly under shadow rip configurations (this study, Sous et al., 2020).
Overall, the dynamics of headland rips is still a poorly understood topic that needs to be further addressed as they represent a dominant feature of the nearshore hydrodynamics and, consequently, of the underly-ing morphodynamics. In particular, headland rips can favor sediment exchanges between the surf zone and the inner shelf (e.g., McCarroll, Masselink, et al., 2018) which may act as a sink in the long-term sed-iment budget of embayed beaches. Most studies aiming at predicting nearshore sedsed-iment exchanges are based on the theoretical concept of the depth of closure (DoC), which corresponds to the maximal theo-retical depth from which wave-induced bottom elevation changes and net sediment exchange between the nearshore and the offshore are not significant. Yet, limitations of the DoC have been reported, especially when applied to embayed beaches. Indeed, recent modeling studies and field data-based sediment bud-get analysis of headland-bounded beaches have shown that significant sediment masses were transported from along headlands, mostly through bypass mechanisms during energetic wave conditions (McCarroll, Masselink, et al., 2018), to well beyond the DoC (Valiente et al., 2019). However, these morphological studies have relied on very scarce or no velocity measurements along the headland.
Accordingly, little is known on the relation between incident wave conditions and headland rip activity and, more generally, on the wave-induced circulation activity occurring along geologically constrained beaches. The present study attempts to bridge this knowledge gap by analyzing dense and high-frequency wave and current data collected during a comprehensive 3-week field experiment carried out in one of Anglet beaches (SW France) in October 2018 (Mouragues et al., 2020). After briefly presenting the field experiment in section 2, flow measurements are examined over the entire measurement period in section 3.1. Next, in section 3.2, six representative wave events with different offshore wave conditions are selected in order to depict the main circulation patterns, which are further discussed in section 4.
2. Field Experiment
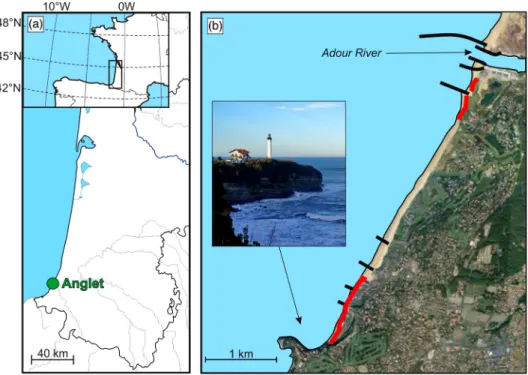
2.1. Field SiteFrom 3 to 26 of October 2018, a field experiment was conducted at La Petite Chambre d'Amour (PCA) beach located in Anglet within the rugged Basque coastline, SW France (Figure 1a). This coast is regularly exposed to energetic Atlantic swells coming from the W-NW direction and also experiences more variable locally generated wind waves (Abadie et al., 2005). The annual mean significant wave height and peak period are
Hs =1.57 m (up to 10 m during severe storms) and Tp = 10 s, respectively. The tidal regime is
semidiur-nal meso with a mean spring range of 3.85 m. PCA beach is situated at the most southern part of a 4-km embayment, comprising six groynes and bounded by the Adour estuary at the northern end and by Saint Martin headland at the southern end (Figure 1b). The morphology of PCA beach is seasonally modulated and is mostly double-barred. For more information on Anglet beach setting and beach morphodynamics, the reader should refer to Huguet et al. (2016). The beach is composed of medium to coarse (D50 ∼ 2 mm) sand with a steep beach face (∼1/10) and a more gentle sloped surf zone (∼1/50). The Saint Martin head-land bounding the southern end of the site is a 500-m rocky headhead-land which is bordered by rocks that can be
Figure 1. (a) Location of Anglet along the Aquitaine south coast (SW France). (b) Map of Anglet beach showing the location of the groynes (black thick lines), the Adour river, and a photo of Saint Martin headland. The red line indicates where the beach is backed by a seawall.
emerged around low tide and which extends further offshore than a submerged natural reef located approx-imately 150 m from the headland (see section 2.2.1). While the headland can potentially guide headland rips, the alongshore variability in the depth of the reef is expected to lead to bathymetrically controlled rips. 2.2. Experimental Setup and Methods
2.2.1. Morphological Measurements and Setup
A first multibeam bathymetric survey was carried on 26 June 2018 in order to accurately map the sub-merged reef and rocks bordering the headland. A second single-beam bathymetric survey with 50-m spaced cross-shore transects was conducted on 5 October 2018 in order to capture the sandy beach morphology just prior to the experiment. Additionally, a high-resolution topographic survey using photogrammetry (Laporte-Fauret et al., 2019) collected by an unmanned aerial vehicle (UAV) was performed at spring low tide on 24 October 2018 to measure the headland topography and the upper and intertidal sandy beach topography just after the experiment. The vertical uncertainty (95% CI) from bathymetric and topographic surveys is estimated to be less than 0.20 and 0.07 m, respectively. These multiple surveys were merged and gridded (mesh size of 2 m) using a natural neighbor interpolation method accounting for cross-shore tran-sect anisotropy (see Figure 2a showing the bathy-topo map relative to NGF-IGN69 leveling). The highest elevation of the submerged reef is approximately −2.9 m (NGF-IGN69), corresponding to −2.5 m relative to the mean sea level. Figures 2b and 2e show the substantial control of the reef on wave breaking patterns. Of note, the connection between the beach and the headland is rather curved (see Figures 2a, 2d, and 2e). A qualitative assessment of the beach, video images, and the bathy-topo map of the site (Figure 2a) indi-cate that the beach morphology was alongshore-uniform during the entire field experiment, corresponding to a low-tide terrace beach state according to the classification of Wright and Short (1984). It is therefore expected that both the reef and the headland affect surf zone circulation at PCA. Based on the latter, wave and current data were collected in the vicinity of the reef and the headland in order to assess the natural variability of bathymetrically controlled circulation and headland rips.
2.2.2. Hydrodynamic Data
Acoustic Doppler current profilers (ADCPs) and surf-zone drifters were deployed in the vicinity of the reef and the headland for measuring Eulerian and Lagrangian velocities, respectively. Eulerian and Lagrangian velocities are analyzed in terms of cross-shore and longshore velocities (UCand UL, respectively). UC> 0
Journal of Geophysical Research: Oceans
10.1029/2020JC016259
Figure 2. Experimental setup of the field campaign (modified from Mouragues et al., 2020). (a) Bathy-topo map of the field site. Color represents elevation (m) in NGF-IGN69 (Global French Levelling). Magenta points indicate the location of each sensor. The shaded area and the red star show the location of the reef and the lighthouse, respectively. Red lines indicate the headland-based camera view angle. (b) Example of a raw image recorded by the headland-based camera. (c) Aerial view of the field site. (d and e) Google Earth images showing the headland and the submerged reef during low-energy wave conditions (d) and moderate-energy wave conditions (e).
(UC< 0) indicates offshore (onshore)-directed flow, while UL> 0 (UL< 0) indicates a shore-parallel flow directed away from the headland (toward the headland; Figure 2a). The shore-parallel direction corresponds to 30◦in nautical convention.
Four ADCPs were installed at strategic locations across the field site (Figure 2a) and were continuously recording pressure and velocity profile throughout the water column. SIG1 (Nortek Signature 500 kHz; 4 Hz; cell size: 0.5 m), SIG2 (Nortek Signature 1,000 kHz; 8 Hz; cell size: 0.2 m), SIG3 (Nortek Signature 1,000 kHz; 1 Hz; cell size: 0.2 m), and AQ (Nortek Aquadopp; 1 Hz; cell size: 0.1 m) were deployed far offshore (800-m offshore, in 12–16 m depth), few meters off the reef (in 5.5–9.5 m depth), along the headland (in 7.5–11.5 m depth), and in the vicinity of the reef (in 1.75–6 m depth), respectively (Figure 2a). ADCP cells above the embedded pressure signal were considered as emerged cells and were discarded from the analysis. ADCP beam correlations were also visually checked to ensure the quality of data, especially close to the surface. Cells with a correlation lower than 95% were removed from the analysis. Depth-averaged horizontal veloci-ties were computed by averaging velociveloci-ties of each remaining cell. Current profiler measurements indicate that the vertical variability of the flow field is rather weak in direction but can be substantial in intensity. Consequently, this paper focuses on the depth-averaged flow dynamics, which will be investigated in section 3. Of note, the vertical variability of headland rips at PCA beach is out of the scope of the present work and has been recently studied by Sous et al. (2020) using one single current profiler located along the headland (close to SIG3 position). This will be further discussed in section 4. In addition to Eulerian depth-averaged
velocities, Eulerian surface velocities are provided in section 3.2.3 to quantitatively compare these with Lagrangian surface velocities along the headland and to further characterize deflection rip regimes. Char-acteristic periods of Eulerian velocity fluctuations are defined by identifying frequency peaks in the power spectral density (PSD) of depth-averaged Eulerian velocities. These PSDs are computed over 4 hr using Welch's method with two Hanning-windowed segments, which allowed emphasizing the low-frequency velocity fluctuations (O(10) min and O(102) min). The characteristic periods were not significantly affected by changes in fast Fourier transform computation parameters (e.g., type of windowing and number of window segments).
Six surf-zone drifters were released in the vicinity of the reef in order to measure Lagrangian surface current velocities, providing a wider spatial extent of circulation variability than Eulerian measurements. Drifters were modified from the design of MacMahan et al. (2009) and consisted of a 110-cm long thin PVC mast, upon which a GPS antenna was mounted. The mast was attached to a 40-cm long submerged PVC tube, acting as ballast, with a damping plate and external fins to minimize surfing behavior. The drifter positions were telemetered in real time to a coastal ground station to aid deployment logistics in large surf and data logging in case of loss of drifters in such a high-energy environment. Drifter positions were monitored using QPS Qinsy hydrographic data acquisition software. Drifter position and velocity uncertainties are estimated to be less than 3 m and approximately 0.1 m/s, respectively. Such drifter design has been previously used for measuring surface flows associated with rips (e.g., MacMahan et al., 2010; McCarroll et al., 2014; Scott et al., 2014, 2016). Data collected by the drifters (2.5 Hz) allowed studying surface current circulation pat-terns occurring during four days (on 18, 19, 22, and 23 October 2018). During drifter deployments, wind conditions were relatively weak, with mean wind speed around 2.5 m/s and reaching 5 m/s. Accordingly, the effect of wind slippage on drifter trajectory was not significant with a maximum windage error below 0.04 m/s, according to Murray (1975). The total deployment duration is approximately 11 hr 30 min, with individual deployment duration ranging from 2 hr to 3 hr 30 min and individual deployment spatial cover-age ranging from 330 to 950 m relative to the shoreline position. In order to investigate the mean Lagrangian circulation patterns, the studied site was divided into 40 × 40 m bins. Such a coarse spatial discretization allowed addressing the mean surface flow patterns. For each bin, the mean and standard deviation of independent drifter velocities and directions were computed. Each time a drifter passed through a bin, it was considered an independent observation. Because few drifters were recirculating and given that spatial scales of the observed circulation were relatively large compared to other drifter studies (e.g., MacMahan et al., 2010; McCarroll, Brander, et al., 2018; Spydell et al., 2007), the number of individual drifter data in each spatial bin was limited. Therefore, contrary to previous works, no threshold on independent drifter observations was implemented herein. Of note, the standard deviation of drifter velocity and direction was computed based on the total instantaneous data point within each bin corresponding to the sum of raw data point for all drifters in a given bin. Averaged over the four drifter deployments, the minimum, the maximum, and the mean of the total instantaneous data point was 4, 7,921, and 1,377, respectively.
2.2.3. Video Data
Images of the field site were collected in order to provide a visual insight of circulation patterns. A fixed camera was installed at the top of the lighthouse (located at the tip of the headland; Figure 2a) approxi-mately 70 m above the mean sea level and recorded high-frequency images (1 Hz) of circulation occurring on the reef and close to the most landward half of the headland (Figure 2b). The collected images were recti-fied using spatially distributed ground control points (GCPs) and converted into cross-shore and longshore coordinates. A moving average (over 30 s) was applied to the rectified images in order to filter out waves and emphasize foam and streaks and further qualitatively depict surface currents. The resulting images were compiled into videos, hereafter referred to as timex videos, some of which are provided as supporting information (a text file [Supporting Information S1] is also provided to explain in detail the content of the supporting information). Depending on data availability, instantaneous drifter trajectories (red dots), ADCP velocity magnitudes and directions (magenta arrows), and smoothed bathymetry contours (yellow lines) are overlaid on timex videos. Additional video monitoring was made using a camera-equipped UAV (e.g., Figure 2c). In the present paper, timex videos derived from the fixed camera are used to visualize circulation patterns. Detection algorithms for computing surface current velocities such as particle image velocimetry or optical flow were not implemented and are subject to future work. Here, a visual interpreta-tion of timex videos is made to complement the quantitative analysis of hydrodynamic data collected by the ADCPs and the drifters. This analysis will be presented in section 3.2.
Journal of Geophysical Research: Oceans
10.1029/2020JC016259
Figure 3. Offshore wave and tide conditions during the field experiment. (a) Tidal level (blue line), significant wave height (Hs; black line), and maximum wave height (Hmax; red dots). (b) Peak wave period (Tp; blue dots) and mean wave period (Tm02; black line). (c) Peak wave incidence (θp; blue dots) and its 12 hr-averaged values (black line).
(d)𝑓(PL) =sign(PL)√|PL|, where sign(PL) corresponds to the sign of PL, (blue dots) and its 12 hr-averaged values (black line). Positive (negative) values of wave incidence and longshore wave power correspond to deflection (shadowed) configuration (see Figure 2a). Shaded areas show six events selected for further analysis.
2.3. Offshore Wave and Tide Conditions
Offshore wave conditions were obtained from a permanent directional wave buoy moored in 50 m water depth located about 5 km offshore of Anglet. During the field experiment, PCA beach was exposed to inci-dent wave conditions characterized by long-period high- to low-energy wave events. Offshore significant wave height Hsranged from 0.4 to 4.2 m (Figure 3a), while offshore peak wave period Tpand mean wave
period Tm02ranged from 6 to 16 s and from 5 to 11 s, respectively (Figure 3b). Offshore wave conditions were moderately to highly energetic (average Hsof 1.5 m) and featured several wave events with Hsexceeding 2 m.
Incident wave conditions were also characterized by a wide range of wave obliquity, from shore-normal to very oblique waves (Figure 3c). The peak wave incidence (angle of wave incidence relative to the shore normal)𝜃pranged from −23 to 27◦. The sign of𝜃pis set depending on which side of the headland waves
are coming from (Figure 2a). While𝜃p = 0 indicates shore-normal waves (hereafter called shore-normal
configuration),𝜃p< 0 and𝜃p> 0 mean that the headland is located at the updrift (hereafter called shadowed
configuration) or downdrift (hereafter called deflection configuration) side of the embayment, respectively. Overall, the first and third weeks of measurements correspond to deflection configuration, while the second week was mostly shadowed configuration.
Such a variability is emphasized by the temporal evolution of the alongshore component of offshore wave power PL(Figure 3d), which is indicative of the portion of wave power available to drive alongshore currents
in the surf zone (Price & Ruessink, 2011). PLis a function of the incident wave power P and the peak wave
incidence𝜃pand is computed as
PL=Psin(𝜃p)cos(𝜃p), (1) where P is defined as P = 𝜌g 2 64𝜋H 2 sTp, (2)
Figure 4. 20-min time-averaged water depth (h0; black line) and depth-averaged cross-shore (UC; blue line) and
longshore (UL; red line) velocities for each sensor. (a) SIG1; (b) SIG2; (c) SIG3; and (d) AQ. Positive UC(UL) corresponds to an offshore-directed (directed away from the headland) current. Shaded areas show six events selected for further analysis.
with𝜌 being the sea water density, g the gravity constant, and Hsand Tpare the offshore significant wave
height and peak wave period, respectively. High positive (negative) values of PLindicate high-energy swell
under deflection (shadowed) configuration. Near-zero PLindicate shore-normal wave conditions. For the
sake of graphic visualization, the temporal evolution of PL is depicted as𝑓(PL) = sign(PL)
√
|PL|, where
sign(PL) corresponds to the sign of PL(Figure 3d). Based on the offshore wave climate during the field
exper-iment, the alongshore offshore wave power ranged from −15 kW/m on the 14th to 40 kW/m on the 7th, which corresponds to the most energetic wave event of the measurement period. In addition to the offshore wave condition variability, the experiment was characterized by different tidal level with tidal range varying from 4.4 m during spring tides to 1.1 m during neap tides (Figure 3a).
3. Results
In this section, depth- and 20-min-averaged Eulerian velocities are first presented in order to provide an overview of the flow response during the entire experiment. Based on the latter, circulation patterns are identified and further analyzed in detail using Eulerian (depth- and 5-min-averaged) and Lagrangian measurements along with timex videos (supporting information).
3.1. Eulerian Measurement Overview
Figure 4 shows the temporal evolution of both cross-shore (UC; blue line) and longshore (UL; red line)
20-min time- and depth-averaged velocities and water depth (black line) recorded by each ADCP during the field experiment. The most offshore sensor, SIG1, measured velocities during the whole experiment in water depth ranging from 12 to 16 m (Figure 4a). With the exception of the seaward flow (UC∼0.4 m/s)
induced by a very energetic deflection wave event on 7 October (HS =4 m), offshore velocities are rather
Journal of Geophysical Research: Oceans
10.1029/2020JC016259
Figure 5. Five-minute time-averaged water depth (h0; black line) and depth-averaged cross-shore (UC; blue line) and
longshore (UL; red line) velocities for Events F1 (left column) and F2 (right column) measured by SIG2 (a, b), SIG3 (c, d), and AQ (e). Positive UC(UL) corresponds to an offshore-directed (directed away from the headland) current. Shaded areas indicate drifter deployment periods. Note that velocity measurements on the reef (AQ) were not available during Event F1.
on the 14th. Measurements from SIG2, SIG3, and AQ indicate that velocity intensity and direction undergo significant time variations, with stronger intensities close to the shoreline. Nearshore currents measured by AQ in 1.75–6 m depth are strongly modulated by the tide, with the more intense flow as the water depth decreases. On the 7th, during the very energetic deflection wave event, AQ measured a seaward current flow-ing on the order of 0.8 m/s. Durflow-ing the shadowed wave period between the 13th and the 18th, AQ measured an alongshore current flowing away from the headland and reaching 0.35 m/s on the 16th. Nearshore cur-rents at SIG2 in 5.5–9.5 m depth and SIG3 in 7.5–11.5 m depth are also tidally modulated and have a similar pattern. SIG2 and SIG3 measured a seaward current flowing around 0.2–0.4 m/s and 0.3–0.4 m/s during the deflection wave event on the 23th, respectively. During the shadowed wave period, SIG2 and SIG3 measured a rather weak alongshore current flowing away from the headland on the order of 0.1 m/s at both measure-ment locations. Overall, a strong variability in current dynamics (intensity and direction) is observed over the whole measurement period.
3.2. Rip-Flow Patterns
In order to address the effect of the offshore wave forcing on the hydrodynamics and depict the main observed rip-flow patterns, six representative events are selected according to the mean offshore significant wave height Hsand peak wave incidence𝜃p. The corresponding date of each event is shown in Figures 3
and 4. Events S1 and S2 denote shadowed moderate-energy weakly oblique (Hs =1.6 m and 𝜃p= −5◦) and
high-energy moderately oblique (Hs =2.2 m and 𝜃p= −10◦) wave conditions, respectively. Events F1 and F2 correspond to shore-normal moderate-energy (Hs = 1.0 m and 𝜃p=0◦) and high-energy (Hs = 1.9 m and 𝜃p = 0◦) wave conditions, respectively. Finally, Events D1 and D2 refer to deflection
moderate-high-energy moderately oblique (Hs=1.75 m and 𝜃p=10◦) and very high-energy highly oblique
(Hs=4.0 m and 𝜃p=20◦) wave conditions, respectively.
3.2.1. Shore-Normal Configuration
In this section, we describe the circulation patterns depicted under near shore-normal incident waves dis-criminating moderate-energy (Event F1, Hs = 1.0 m, Tp = 11 s) and high-energy (Event F2, Hs=1.9 m,
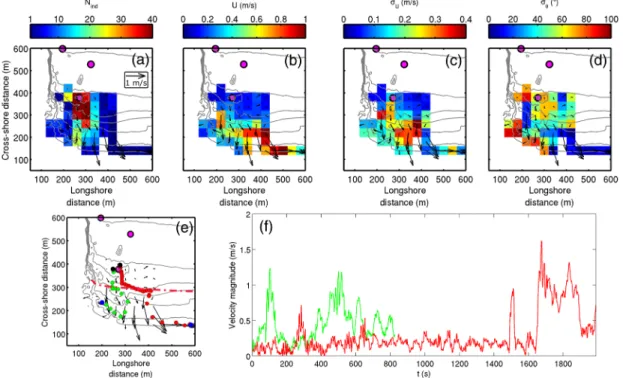
Figure 6. Mean Lagrangian surface currents during drifter deployment in the morning of 22 October (Event F1:Hs=1.0 m) overlaid on the smoothed bathymetry. (a) Number of independent observations Nind. (b) Drifter velocity intensity U (m/s). (c) Standard deviation of drifter velocity intensityσU(m/s). (d) Standard deviation of drifter directionσθ(◦). (e) Raw trajectory of one single drifter with black and blue points showing the start and the end of deployment, respectively. The dashed red line shows the approximate surf zone edge. (f) Temporal evolution of raw velocity magnitude of one single drifter, whose trajectory is shown in panel (e). Magenta points indicate the location of each sensors.
Tp=14 s) wave conditions. The left panels in Figure 5 show the time evolution of Eulerian currents at SIG2 and SIG3 during a whole tide cycle on 22 October 2018 (Event F1), with the corresponding mean Lagrangian flow near neap low tide level shown in Figure 6. Given that only SIG2 and SIG3 were collecting data at that time, Eulerian currents were only measured far offshore of the surf zone. Lagrangian measurements in the surf zone indicate the presence of an approximately 150-m wide circulation cell flowing anticlock-wise against the headland. Mean offshore- and onshore-directed flows reached 0.3 and 0.5 m/s, respectively (Figure 6b), while instantaneous velocities were highly variable reaching 0.7 m/s (Figure 6f). While mostly recirculating, the rip cell slightly oscillated, resulting in large𝜎Uand𝜎𝜃(Figures 6c and 6d) and in
occa-sional drifter exits from the surf zone. The offshore-directed velocity peaks captured further offshore at SIG3 around low tide (Figure 5c) are hypothesized to be the signature of such surf zone exits. A detailed inspec-tion of the timex video indicates that the rip cell activity is significantly affected by wave breaking on the reef (see Movie S1) and is mostly active around low tide, which is in line with the tidal modulation of the offshore-directed flow captured by SIG3. Movie S1 also indicates that the surface currents inside the surf zone further away from the headland are onshore dominated, with their temporal variability largely con-trolled by wave groupiness. These onshore-directed motions at the surface were also captured by the drifters, which measured a dominant, strong onshore-directed flow away from the rip cell.
For high-energy wave conditions (Event F2), Eulerian measurements show slightly stronger velocities than during Event F1, with systematically onshore-directed flows and directed away from the headland at SIG2 and SIG3 with a mean peaking at 0.1 m/s and no tidal modulation (Figures 5b and 5d). This is in line with the Lagrangian measurements shown in Figure 7 revealing mean onshore-directed surface currents flowing slightly away from the headland, exceeding 0.5 m/s in the surf zone, with instantaneous velocities peaking at 2 m/s close to the shore (Figure 7f). While the weak positive alongshore component measured by the drifters and the current profilers is assumed to be caused by the slightly oblique incident waves (Figure 3c), a close inspection of the video images at that time indicates that surface flows are primarily onshore dominated inside the surf zone along the entire beach, with the temporal variability of these surface flows affected by wave groupiness (see Movie S2). In addition, measurements at AQ, which was located close to the outer edge
Journal of Geophysical Research: Oceans
10.1029/2020JC016259
Figure 7. Mean Lagrangian surface currents during drifter deployment in the morning of 18 October (Event F2:Hs=1.9 m) overlaid on the smoothed
bathymetry. (a) Number of independent observations Nind. (b) Drifter velocity intensity U (m/s). (c) Standard deviation of drifter velocity intensityσU(m/s).
(d) Standard deviation of drifter directionσθ(◦). (e) Raw trajectory of one single drifter with black and blue points showing the start and the end of deployment, respectively. The dashed red line shows the approximate surf zone edge. (f) Temporal evolution of raw velocity magnitude of one single drifter whose
trajectory is shown in panel (e). Magenta points indicate the location of each sensors.
of the surf zone during drifter deployment (see Movie S2), show a slight tidal modulation with cross-shore and alongshore velocities both varying approximately from −0.3 to 0.3 m/s (Figure 5e). Velocities also show large VLF motions with characteristic periods of 27 and 68 min.
Overall, the mean flow patterns observed for near shore-normal incident waves are primarily associated with onshore-directed motions at the surface that are modulated by wave groups (Figure 8). Wave-driven currents on the reef and along the headland were tidally modulated only for moderate-energy wave condi-tions. For such conditions, the submerged reef exerts control on surf zone currents, with the formation of a quasi-steady circulation cell flowing anticlockwise against the headland around low tide, with occasional exit behavior (Figure 8a). By contrast, for high-energy wave conditions, this circulation is overwhelmed by a dominant onshore-directed flow at the surface inside the surf zone (Figure 8b). For both cases, the onshore-directed surface flows inside the surf zone (see onshore-directed red thin arrows in Figure 8) are likely to be associated with the presence of an undertow near the bed (see offshore-directed dashed blue thin arrows in Figure 8), suggesting that circulation patterns during shore-normal waves are primarily cross-shore. The latter assumption will be discussed in section 4.
3.2.2. Shadowed Configuration
In this section, the circulation patterns observed under shadowed configuration and for moderate-energy weakly oblique (Event S1, Hs=1.6 m, 𝜃p= −5◦) and high-energy moderately oblique (Event S2, Hs=2.2 m, 𝜃p = −10◦) wave conditions are described. The left-hand panels in Figure 9 show the time evolution of
Eulerian currents at SIG2, SIG3, and AQ during a whole tide cycle on 19 October 2018 (Event S1), with the corresponding mean Lagrangian flow near neap rising tide level shown in Figure 10. Lagrangian mea-surements indicate the presence of an onshore/alongshore current flowing away from the headland of 0.1–0.2 m/s near the outer edge of the surf zone, which is in line with Eulerian measurements of AQ showing an onshore/alongshore current flowing away from the headland of 0.1–0.2 m/s (Figure 9e). This onshore/alongshore current is also present far offshore where SIG2 and SIG3 recorded average intensities of approximately 0.1 m/s at both locations (Figures 9a and 9c). Lagrangian measurements also indicate that this onshore/alongshore current strengthened inside the inner surf zone, where it reached approximately
Figure 8. Schematic of the flow patterns observed under near shore-normal incident waves for (a) moderate-energy (Event F1) and (b) high-energy (Event F2) wave conditions superimposed onto the colored bathymetry. In all panels, the dashed-dotted red line indicates the approximate outer edge of the surf zone. The onshore-directed red thin arrows represent onshore-directed surf zone flows near the surface, while the offshore-directed dashed blue thin arrows show the potential presence of an undertow flowing offshore near the bed inside the surf zone. In panel (a), the continuous red circle indicates the quasi-steady circulation cell, with occasional exit behavior showed by offshore-directed dashed red arrows close to the cell and at SIG3. In panel (b), the thick red arrow represents the onshore-directed flow captured by SIG2 and SIG3.
Figure 9. Five-minute time-averaged water depth (h0; black line) and depth-averaged cross-shore (UC; blue line) and
longshore (UL; red line) velocities for Events S1 (left column) and S2 (right column) measured by SIG2 (a, b), SIG3 (c, d), and AQ (e, f). Positive UC(UL) corresponds to an offshore-directed (directed away from the headland) current. Shaded areas indicate drifter deployment periods.
Journal of Geophysical Research: Oceans
10.1029/2020JC016259
Figure 10. Mean Lagrangian surface currents during drifter deployment in the morning of 19 October (Event S1:Hs=1.6 m andθp= −5◦) overlaid on the smoothed bathymetry. (a) Number of independent observations Nind. (b) Drifter velocity intensity U (m/s). (c) Standard deviation of drifter velocity intensity
σU(m/s). (d) Standard deviation of drifter directionσθ(◦). (e) Raw trajectory of two drifters with black and blue points showing the start and the end of deployment, respectively. The dashed red line shows the approximate surf zone edge. (f) Temporal evolution of raw velocity magnitude of the two drifters whose trajectory is shown in panel (e) with corresponding colors. Magenta points indicate the location of each sensors.
1 m/s. Eulerian measurements show no tidal modulation of currents, except in the surf zone where AQ mea-sured onshore-directed velocities reaching almost 0.3 m/s and where VLF fluctuations with characteristic periods of 31 and 54 min were measured. Timex videos (see Movies S3 and S4) display drifters moving within this onshore/alongshore current. They also suggest the presence of a transient clockwise recirculation eddy flowing against the headland, with some drifters moving toward the headland. Lagrangian measurements display a highly fluctuating current (high values of𝜎Uand𝜎𝜃) flowing toward the headland with
instan-taneous surface velocities peaking around 1.2 m/s (Figure 10f). In addition to the visual interpretation of timex videos, a pixel intensity time-space diagram along a cross-shore transect on the reef shows the con-tribution of wave group breaking on the reef to the mean flow, with the mean onshore-directed flow during wave-group breaking events (see supporting information). This indicates that surf zone currents close to the headland are affected by incoming wave groups, suggesting that the variability of the transient eddy is influenced by incoming wave groups.
For high-energy and moderately oblique incident waves (Event S2), only the Eulerian measurements were available at this time. All sensors measured much more unstable velocities than during Event S1 (see the right-hand panels in Figure 9). Given the fact that video images were not available during Event S2, we hypothesize the transient recirculating eddy observed for Event S1 to be also present for Event S2 and to cover a much wider area, extending far offshore at least where SIG2 is positioned. Measurements from SIG2 show a weak mean offshore-directed flow (0.05 m/s), with intense offshore-directed peaks reaching 0.25 m/s (Figure 9b). All Eulerian velocities display VLF motions, especially SIG3 and AQ, which exhibit strong fluctuations of the alongshore current, reaching 0.15 and 0.5 m/s, respectively. Characteristic periods of these fluctuations are 33 and 57 min for SIG3 and O(102) min for AQ. As for Event S1, currents are weakly modulated by the tide, except for AQ with a more intense onshore-directed flow around low tide.
Overall, the mean flow patterns observed for shadowed configuration are characterized by the presence of an onshore oblique current directed away from the headland and a recirculating transient eddy far and close to the headland, respectively (Figure 11). Tidal modulation of currents was weak regardless of the offshore wave height and wave incidence, except in the vicinity of the reef. Timex videos indicate that the temporal variability of the transient eddy is influenced by incoming wave groups and that its spatial coverage increases
Figure 11. Schematic of the flow patterns observed under shadowed configuration for (a) moderate-energy and weakly oblique (Event S1) and (b) high-energy and moderately oblique (Event S2) wave conditions superimposed onto the colored bathymetry. In all panels, the thick red arrow represents the dominant alongshore current, and the dashed red circle indicates the transient recirculation eddy.
with increasing incident wave height and obliquity. This eddy is assumed to be concentrated within the submerged reef for moderate-energy and weakly oblique wave conditions (Figure 11a) and to extend further offshore for high-energy and moderately oblique wave conditions (Figure 11b). Large VLF motions were also present for both situations.
3.2.3. Deflection Configuration
In this section, we analyze the circulation patterns observed under deflection configuration for moderate-high-energy moderately oblique (Event D1, Hs = 1.75 m and 𝜃p = 10◦) and very high-energy
highly oblique (Event D2, Hs = 4.0 m and 𝜃p = 20◦) wave conditions. Figure 12 displays the time
evo-lution of Eulerian currents at SIG2 and SIG3 during a whole tide cycle on 23 October 2018 (Event D1), with the corresponding mean Lagrangian flow near neap low tide level depicted in Figure 13. Lagrangian
Figure 12. Five-minute time-averaged water depth (h0; black line) and depth-averaged cross-shore (UC; blue line) and
longshore (UL; red line) velocities for Event D1 measured by SIG2 (a) and SIG3 (b). Positive UC(UL) corresponds to an offshore-directed (directed away from the headland) current. The shaded area indicates the drifter deployment period. Note that velocity measurements on the reef (AQ) were not available during Event D1.
Journal of Geophysical Research: Oceans
10.1029/2020JC016259
Figure 13. Mean Lagrangian surface currents during drifter deployment in the morning of 23 October (Event D1: Hs=1.75 m andθp=10◦) overlaid on the smoothed bathymetry. (a) Number of independent observations Nind.
(b) Drifter velocity intensity U (m/s). (c) Standard deviation of drifter velocity intensityσU(m/s). (d) Standard
deviation of drifter directionσθ(◦). (e) Raw trajectory of one single drifter with black and blue points showing the start and the end of deployment, respectively. The dashed red line shows the approximate surf zone edge. (f) Temporal evolution of raw velocity magnitude of one single drifter whose trajectory is shown in panel (e) with corresponding colors. Magenta points indicate the location of each sensors. The dashed blue line shows the maximum cross-shore extent of the headland.
mean surface current patterns are predominantly dominated by an offshore-directed current flowing against the headland, from the surf zone to at least 1,000 m offshore, where drifters were retrieved. Timex videos (see Movie S5) show that this current results from the deflection of the alongshore current against the headland. They also indicate that the deflection rip dynamics is slightly affected by the variability of wave breaking across the reef at the time scale of wave groups, resulting in high values of𝜎Uand𝜎𝜃of Lagrangian
surface currents in the vicinity of the reef and further offshore (Figures 13c and 13d). Along the headland, the deflection rip neck is rather concentrated within approximately 150 m from the headland and is char-acterized by the highly fluctuating intensity with instantaneous rip intensity averaging around 0.3 m/s and oscillating between 0.1 and 0.5 m/s, in 3–8 m water depth (Figures 13e and 13f). Offshore of the headland, the deflection rip head covers a much wider area than the rip neck, with a more stable intensity than the rip neck, averaging around 0.35 m/s and varying between 0.25 and 0.50 m/s, in 8–14 m water depth. In line with drifter measurements, Eulerian measurements show offshore-directed flows which are intense around low tide and weak around high tide (Figure 12). During drifter deployment corresponding to the neap low tide at this time, the mean depth-averaged (surface) deflection rip intensity at SIG2 and SIG3 was approx-imately 0.2 m/s (0.2 m/s) and 0.3 m/s (0.3 m/s), respectively, which is consistent with Lagrangian surface velocities. Around high tide, the mean depth-averaged deflection rip intensity is well below 0.1 m/s for each current profiler while the mean surface deflection rip intensity reaches 0.13 and 0.10 m/s at SIG2 and SIG3, respectively. Eulerian velocities also display strong VLF rip pulsations with characteristic periods around 30
Figure 14. Five-minute time-averaged water depth (h0; black line) and depth-averaged cross-shore (UC; blue line) and
longshore (UL; red line) velocities for Event D2 measured by SIG1 (a) and AQ (b). Positive UC(UL) corresponds to an offshore-directed (directed away from the headland) current. Note that velocity measurements off the reef (SIG2) and along the headland (SIG3) were not available during Event D2. Magenta dashed line in panel (b) shows the temporal evolution of wave breaking water depth hbrdefined ashbr=Hs,0∕0.6.
and 50 min. Around the second low tide in Figure 12, the deflection rip is much stronger due to increasing offshore wave obliquity (Figure 3c).
For very high-energy and highly oblique incident waves (Event D2), only the Eulerian data from SIG1 and AQ were available (Figure 14). The magenta dashed line in Figure 14b represents the time evolution of wave breaking water depth hbr defined as hbr = Hs,0∕0.6, meaning that AQ was always inside the surf zone during Event D2. Eulerian measurements indicate the presence of a strong deflection rip extending from the surf zone to far offshore, at least 800 m offshore where SIG1 is positioned. At this position, the deflection rip is strongly modulated by the tide with more intense velocities as the water depth decreases (Figure 14a). Around low tide, the mean depth-averaged (surface) deflection rip intensity at SIG1 is approx-imately 0.30 m/s (0.39 m/s) in 12-m water depth. Measurements at SIG1 also display strong and narrow VLF peaks, reaching a depth-averaged value of 0.7 m/s, with characteristic periods of 31 and 64 min. Around high tide, the mean depth-averaged deflection rip intensity is rather weak (0.1 m/s), while the surface deflection rip intensity averages around 0.28 m/s in 16-m water depth. Inside the surf zone, the mean depth-averaged intensity was also modulated by the tide, with increasing mean intensity as the tide is rising. Around low tide, the rip is also strongly unstable, with depth-averaged intensity averaging around 0.3 m/s and reaching 0.8 m/s in 2-m water depth (Figure 14b). Characteristic periods of VLF peaks at this time are 28 and 72 min. Overall, the mean flow pattern observed under moderate deflection configurations (Event D1) is largely con-trolled by the deflection of the alongshore current against the headland (Figure 15). Under more energetic deflection configurations (i.e., for increasing PL; Event D2), Eulerian measurements also suggest the
pres-ence of a strong deflection rip extending far offshore, which will be discussed in section 4. For both cases, the deflection rip is strongly modulated by the tide and exhibits strong VLF fluctuations.
4. Discussion
The nearshore circulation at PCA for shore-normal waves was essentially characterized by cross-shore motions close to the headland, except during moderate-energy wave conditions (Figure 8a). For such con-ditions, alongshore variations in breaking wave energy dissipation due to the alongshore variability in the depth of the reef led to the formation of a quasi-steady circulation cell active around low tide. During high-energy wave conditions (Figure 8b), because the horizontal spatial scale of the reef (characteristic
Journal of Geophysical Research: Oceans
10.1029/2020JC016259
Figure 15. Schematic of the flow patterns observed under deflection configuration for moderate-high-energy and moderately oblique (Event D1) wave conditions superimposed onto the colored bathymetry. Thick red arrows represent the prevailing deflection rip.
alongshore width of 20 m; see Figure 2d) was small compared to the length of incident waves (characteristic wavelength of 90 m for Tp=14s),
waves were not fully refracted by the reef, which led to predominant cross-shore surf zone motions close to the headland. These cross-shore surf zone motions are assumed to be characterized by a depth-varying flow inside the surf zone, which is now further described. Timex videos and drifters clearly indicate that surf zone surface motions were primarily onshore-directed under shore-normal configurations, except on the reef during moderate waves. Because current profilers were not located inside the surf zone at this time, preventing any measurements of the vertical variability of the flow field in the surf zone, the wave breaking-induced onshore-directed mass flux near the surface is hypothesized to be counter-balanced by the undertow flowing offshore in the surf zone near the bed (Figure 8). Of note, velocity measurements at AQ, which was located near the outer edge of the surf zone at this time, display nearly depth-uniform velocities (as for all other current profilers and not shown here), sug-gesting that the depth-varying flow was likely mostly present in the surf zone. Since timex videos show a modulation of the onshore-directed sur-face flow at the wave group scale, the depth-varying flow in the surf zone is assumed to be also modulated by wave groups. Based on a visual inspection of the timex videos corroborating visual observations during the field experiment, flash rips within the surf zone, which are typically observed under similar configurations (e.g., Castelle et al., 2014; Murray et al., 2013), were not observed here. This is assumed to be caused by the saturated surf zone, preventing any nonuniformities along breaking wave crest, which are responsible for flash rip occurrence under similar configurations (e.g., Johnson & Pattiaratchi, 2006).
Under oblique wave conditions, the nearshore circulation at PCA was predominantly controlled by the headland through wave shadowing or deflection effects, which is in line with previous studies. As described in Gourlay (1974) and observed in Pattiaratchi et al. (2009), the flow dynamics of the wave shadowing region, which is the region close to the headland that is being sheltered from the wave action, was driven by a recir-culating eddy, and an onshore oblique current directed away from the headland was present outside the wave shadowing region (Figure 11). Similar to Pattiaratchi et al. (2009), our findings suggest that the spatial coverage of the eddy increases with increasing incident wave height and obliquity. However, by contrast to previous studies with similar configurations (e.g., Castelle & Coco, 2012; McCarroll et al., 2014; Pattiaratchi et al., 2009; Scott et al., 2016), shadow rips were not extensively observed at PCA beach, which is in line with a recent experimental study at the same field site (Sous et al., 2020). This is hypothesized to result from the prominent offshore extent of the headland at PCA compared to these previous studies, leading to rela-tively wide wave shadowing-induced alongshore variations of wave height, which were not sharp enough to drive shadow rips. Shadow rip activity is also likely to be limited due to the beach curvature close to the headland (Figure 2a), potentially favoring an alongshore current flowing away from the headland through wave refraction rather than a shadow rip through shadowing effect (Castelle & Coco, 2012). The latter obser-vations suggest that bathymetric and topographic features (e.g., headland, reef, and beach) may contribute to the observed circulation altogether. In particular, in the case of shadowed configurations, the morpho-logical complexity of PCA beach is likely to induce a potential competition/combination between the wave shadowing-induced eddy and bathymetrically controlled rips enforced by breaking waves across the reef. Modeling works need to be further conducted to gain more insights regarding such processes.
During the experiment, the deflection rip was found to be the main mechanism responsible for drifter off-shore ejection, suggesting that deflection configurations are essential for large-scale exchanges of materials (e.g., sediments and pollutants) between the nearshore and the offshore (Figure 15). In situ measurements of deflection rips are scarce and generally associated with low-to-moderate energy and weakly varying wave and tide forcing (McCarroll et al., 2014; Scott et al., 2016). Under energetic oblique wave condi-tions, Coutts-Smith (2004) reported intense and highly fluctuating rips offshore an embayed beach, but
the associated data processing was unclear. The present paper is the first study based on an extensive set of in situ deflection rip measurements showing that such rips can extend very far offshore. During the moderate-high-energy deflection event (Figure 15a), the deflection rip extended at least 1,000 m off-shore where Lagrangian surface currents reached approximately 0.3 m/s in 14-m water depth (Figure 13). Such intense offshore Lagrangian velocities are likely to induce sediment transport beyond the 14-m water depth limit, corresponding to the approximate morphological DoC according to Hallermeier's formula (Hallermeier, 1978). Of note, the latter DoC has been computed using a 12-hr-per-year wave height and the corresponding wave period of 8.1 m and 10 s, respectively, which are based on the long-term wave climate variability along the Aquitaine south coast (Abadie et al., 2005). During the high-energy deflection event (Figure 14a), the depth-averaged deflection rip intensity reached up to 0.7 m/s at low tide in 12-m water depth. For the same energetic wave event, Mouragues et al. (2020) highlighted the weak vertical variability of this high-energy deflection rip at low tide. Sous et al. (2020) recently analyzed the vertical variability of head-land rip flow at PCA under both deflection and shadowed configurations using a current profiler located at the SIG3 position. While the flow under shadowed configurations was always nearly depth-uniform regard-less of the tide, they reported a depth-varying deflection rip intensity at high tide with high velocities near the surface and a nearly depth-uniform deflection rip intensity, which is similar to what has been observed but not shown in this study. The latter observations indicate that the flow near the bed is also intense and, in turn, likely to induce significant sediment transport. Such findings therefore suggest the critical ability of deflec-tion rips to transport sediment beyond the DoC. By contrast to previous studies along headland-bounded embayments (e.g., McCarroll, Masselink, et al., 2018), tide-induced currents were negligible compared to wave-driven currents.
Scott et al. (2016) categorized deflection rip behaviors as a function of the boundary length to surf zone width ratio, Lg/Xs. They showed that the alongshore current is fully deflected offshore with no
momen-tum exchanges between adjacent embayments when Lg/Xs> 1.25. The latter condition was met during
the moderate-high-energy deflection event with Lg/Xs (Lg = 500 m) ranging from 2.5 (Xs∼200 m) to 5
(Xs∼100 m) at low tide and high tide, respectively (the approximate value of Xswas estimated with the
rec-tified timex video). During such an event, Lagrangian surface velocities indicate that the alongshore current is fully deflected offshore and that the resulting deflection rip was more intense around low tide, which is in line with Eulerian measurements (Figure 12). The tidal modulation of this moderate-high-energy deflec-tion rip may result from the low tide terrace surf zone morphology (Figure 2a). Indeed, around high tide, incoming waves would tend to break with a more shore-normal incidence as they are refracted by the sub-merged single bar. By contrast, at low tide, the bar is esub-merged, preventing any wave refraction and leading to a more oblique wave incidence at the breaking point. Such mechanisms would further drive a more intense alongshore current at low tide than at high tide. In addition, the presence of emerged rocks at the toe of the headland (see around x = 250 m and𝑦 = 200 in Figure 2) could possibly hinder the deflection mechanism at high tide. During the high-energy deflection event, only Eulerian data far offshore (SIG1) and above the reef in the surf zone (AQ) were available. Although offshore Eulerian measurements indicate that the rip was mostly active around low tide, with much weaker depth-averaged intensities around high tide (Figure 14a), the spatial evolution of the deflection pattern with increasing PLis still unclear. Overall,
the data analysis presented above suggests that the circulation pattern may substantially differ as the inci-dent wave energy increases, which is in line with the conceptual embayment circulation model proposed by Short and Masselink (1999). Such circulation pattern may be potentially locally affected by the degree of local morphological complexity.
For each circulation pattern depicted in this study, wave-driven current intensities displayed VLF fluc-tuations. Similar to Sous et al. (2020), the PSD of instantaneous velocities of each event (not shown here) indicate that the majority of low-frequency motions are contained within the VLF frequency band (f < 0.004 Hz). These VLF motions were particularly intense during the high-energy deflection event. Figure 16 shows very energetic fluctuations of the deflection rip within the VLF frequency band with charac-teristic periods of approximately 30 and 60 min both far offshore and inside the surf zone. These VLF motions are a dominant feature of the velocity PSD, with their corresponding energy density peak value up to 3.5 times higher than the energy density peak within the sea-swell band. Their root mean squared (RMS) veloc-ity magnitude (Urms, VLF), computed according to Reniers et al. (2007), is also of the same order of magnitude as RMS velocity magnitude at higher frequencies (Urms, IGand Urms, Incident). Numerous studies have reported the presence of VLF fluctuations both in the field (MacMahan, 2004b; Bruneau et al., 2009) and in laboratory
Journal of Geophysical Research: Oceans
10.1029/2020JC016259
Figure 16. Velocity magnitude power spectral density (PSD) normalized by the maximum power within the sea-swell frequency band (0.05 < f < 0.2 Hz) of (a) SIG1 and (b) AQ. PSD is computed between 3 am and 1 pm in Figure 14. Vertical black lines indicate 0.004 and 0.04 Hz, delimiting very low frequency (VLF), infragravity (IG), and incident sea-swell frequency band. The red text indicates the characteristic period of the dominant very low frequency motions. The root mean square velocity magnitude Urmsis computed according to Reniers et al. (2007) using velocity time series extracted between 3 am and 1 pm and band-pass filtered within each frequency band.
conditions (Haller & Dalrymple, 2001). Such low-frequency fluctuations are generally related to nongravity rotational motions with the sea surface elevation PSD within the VLF band being 1–2 orders of magnitude lower than the velocity PSD (Lippmann et al., 1999). This is the case here when comparing sea surface ele-vation and velocity PSDs at SIG1 (not shown here) during the high-energy deflection event. VLF vortical motions are commonly hypothesized to be related to shear instabilities of alongshore currents (Oltman-Shay et al., 1989) or of rip currents (Haller & Dalrymple, 2001), to be associated with surf zone eddies (MacMahan, 2004b; Reniers et al., 2007), or to be related to short-crested breaking-wave-induced vorticity (Elgar & Raubenheimer, 2020). During the high-energy deflection event, the amplitude of VLF fluctuations at SIG1 increased with the mean velocity magnitude (see Figure 16a), suggesting that the rip becomes more unstable as it intensifies. Such a positive correlation suggests that VLF motions are related to shear insta-bilities of the deflection rip, as also suggested by Sous et al. (2020). While a few studies have focused on the depth variation of the mean flow (Haas, 2002; Reniers et al., 2004), the vertical structure of VLF motions remains poorly understood. A first inspection at the vertical variation of time-averaged horizontal velocities at SIG1 and AQ locations (not shown here) indicates that the standard deviation and characteristic periods are relatively depth-invariant at both low and high tide, as opposed to the associated mean flow (Mouragues et al., 2020; Sous et al., 2020). This suggests a rather weak vertical variation of VLF motions for the studied high-energy deflection rip that will need to be further explored.
5. Conclusion
An extensive set of in situ measurements has been analyzed in order to study wave-induced circulations occurring at a high-energy mesotidal geologically constrained beach with the presence of a rocky head-land and a submerged reef. During the experiment, the field site was exposed to a wide range of incident wave and tide conditions. Small changes in offshore wave height and obliquity were found to potentially alter circulation patterns close to the headland. Along with timex videos, Eulerian and Lagrangian mea-surements enabled the identification and description of typical rip flow patterns. Under shore-normal wave conditions, the mean flow was characterized by cross-shore motions, except for moderate waves at low tide on the reef, with a quasi-steady recirculation eddy. Under oblique waves, the mean flow was driven by the headland through wave shadowing and deflection effects. The wave shadowing region was characterized by a transient recirculation eddy, and typical shadow rips were not observed. On the contrary, deflection rips extended very far seaward with mean Lagrangian surface velocities around 0.3 m/s 1,000-m offshore