HAL Id: hal-00300896
https://hal.archives-ouvertes.fr/hal-00300896
Submitted on 19 Jan 2004HAL is a multi-disciplinary open access
archive for the deposit and dissemination of sci-entific research documents, whether they are pub-lished or not. The documents may come from teaching and research institutions in France or abroad, or from public or private research centers.
L’archive ouverte pluridisciplinaire HAL, est destinée au dépôt et à la diffusion de documents scientifiques de niveau recherche, publiés ou non, émanant des établissements d’enseignement et de recherche français ou étrangers, des laboratoires publics ou privés.
Measuring atmospheric naphthalene with laser-induced
fluorescence
M. Martinez, H. Harder, X. Ren, R. L. Lesher, W. H. Brune
To cite this version:
M. Martinez, H. Harder, X. Ren, R. L. Lesher, W. H. Brune. Measuring atmospheric naphthalene with laser-induced fluorescence. Atmospheric Chemistry and Physics Discussions, European Geosciences Union, 2004, 4 (1), pp.343-363. �hal-00300896�
ACPD
4, 343–363, 2004 Measuring atmospheric naphthalene with laser-induced fluorescence M. Martinez et al. Title Page Abstract Introduction Conclusions References Tables Figures J I J I Back Close Full Screen / EscPrint Version Interactive Discussion Atmos. Chem. Phys. Discuss., 4, 343–363, 2004
www.atmos-chem-phys.org/acpd/4/343/ SRef-ID: 1680-7375/acpd/2004-4-343 © European Geosciences Union 2004
Atmospheric Chemistry and Physics Discussions
Measuring atmospheric naphthalene with
laser-induced fluorescence
M. Martinez1, 2, H. Harder1, 2, X. Ren1, R. L. Lesher1, and W. H. Brune1
1
Department of Meteorology, Pennsylvania State University, University Park, Pennsylvania, USA
2
now at: Max-Planck-Institut f ¨ur Chemie, Mainz, Germany
Received: 9 December 2003 – Accepted: 18 December 2003 – Published: 19 January 2004 Correspondence to: M. Martinez ([email protected])
ACPD
4, 343–363, 2004 Measuring atmospheric naphthalene with laser-induced fluorescence M. Martinez et al. Title Page Abstract Introduction Conclusions References Tables Figures J I J I Back Close Full Screen / EscPrint Version Abstract
A new method for measuring gas-phase naphthalene in the atmosphere is based on laser-induced fluorescence at low pressure. The fluorescence spectrum of naphtha-lene near 308 nm was identified. Naphthanaphtha-lene fluorescence quenching by N2, O2 and H2O was investigated in the laboratory. No significant quenching was found
5
for H2O with mixing ratio up to 2.5%. The quenching rate of naphthalene fluores-cence is (1.98±0.18) ×10−11cm3 molecule−1 s−1 for N2, and (2.48±0.08)×10−10cm3 molecule−1s−1for O2at 297 K. Instrument calibrations were performed with a range of naphthalene mixing ratios between 5 and 80 parts per billion by volume (ppbv, 10−9). In the current instrument configuration, the detection limit is estimated to be about 20
10
parts per trillion by volume (pptv, 10−12) with 2σ confidence and a 1-min integration time. Measurement of atmospheric naphthalene in three cities, Nashville, TN, Hous-ton, TX, and New York City, NY, are presented. Good correlation between naphthalene and major anthropogenic pollutants is found.
1. Introduction
15
Polycyclic aromatic hydrocarbons (PAHs) are composed of two or more condensed aromatic rings containing only carbon and hydrogen. PAHs were discovered at the beginning of the last century due to their carcinogenic effects. They are formed during incomplete combustion of all types of organic matter and are therefore present in a wide variety of emissions, ranging from natural biomass burning to the exhaust of all types
20
of combustion engines (Finlayson-Pitts and Pitts, 1986). PAHs are present in both gas and particulate phases in the atmosphere, depending on the vapor pressure of each PAH, and can thus end up in the ground water and the soil. The simplest 2-ring PAH is naphthalene (C10H8), which is the most volatile PAH and therefore present mainly in
ACPD
4, 343–363, 2004 Measuring atmospheric naphthalene with laser-induced fluorescence M. Martinez et al. Title Page Abstract Introduction Conclusions References Tables Figures J I J I Back Close Full Screen / EscPrint Version Interactive Discussion thalenes by OH and NO3-initiated reactions (Sasaki et al., 1997). The main sources of
naphthalene in the urban atmosphere are motorvehicle exhaust and residential heat-ing; the predominant sink is its reaction with OH, leading to lifetimes of naphthalene typically shorter than one day (Atkinson and Arey, 1994).
PAHs in the atmosphere have been measured mostly by chromatographic
tech-5
niques (e.g. Fraser et al., 1998; Cam et al., 2000; Williamson et al., 2002) and more recently by proton transfer reaction-mass spectrometry (PTR-MS) (Hewitt et al., 2003). Brandenburger et al. (1998) used differential optical absorption spectroscopy (DOAS) to measure atmospheric naphthalene in a rural area and found that its mixing ratio was between 2 and 16 parts per trillion by volume (pptv, 10−12). Here we present first
mea-10
surements of atmospheric naphthalene by laser-induced fluorescence (LIF) in urban environments. Instrument calibrations are performed and fluorescence quenching of naphthalene is investigated in the laboratory.
2. Experimental description
The Penn State GTHOS/ATHOS (Ground-based/Airborne Tropospheric Hydrogen
Ox-15
ides Sensor) was used to measure atmospheric naphthalene, along with OH and HO2 radicals. It is based on the Fluorescent Assay by Gas Expansion (FAGE) technique, which was originally developed by Hard et al. (1984). A detailed description of this instrument can be found in Faloona et al. (2004).
The air sample expands through a pinhole inlet (1 mm diameter) as it is pulled into
20
a reduced pressure detection chamber by a vacuum pump. As the air flows through the laser beam, which passes 32 times through the detection volume in a White cell, the OH molecules are excited by spectrally narrow (∼4.7 GHz FWHM) laser pulses (3 kHz pulse repetition frequency) at one of several vibronic transition lines near 308 nm (A2Σ v’=0 ← X2Π v”=0). The UV laser beam is delivered to the detection module via a
25
0.20 mm diameter optical fiber (ThorLabs, Munich, Germany). The UV laser power en-tering the White cell is usually in the range of 2–12 mW. The OH fluorescence extends
ACPD
4, 343–363, 2004 Measuring atmospheric naphthalene with laser-induced fluorescence M. Martinez et al. Title Page Abstract Introduction Conclusions References Tables Figures J I J I Back Close Full Screen / EscPrint Version beyond the prompt scattering (Rayleigh and wall scattering) and is detected with a
mi-crochannel plate detector (Hamamatsu, Hamamatsu City, Japan) that is switched into a high gain state after the laser-generated scattering has ceased. The signal counter is also gated, and typically accepts counts from the detector for ∼300 ns between its start and stop times.
5
For all measurements performed by our research group, the Q1(2) vibronic transition line at 307.9951 nm (Dieke and Crosswhite, 1962) was used for OH measurements. The laser was tuned on and ∼0.0075 nm off resonance with the OH transition (called on-line and off-line) every 10 s to determine respectively the OH fluorescence plus background signals and the background signals, resulting in a measurement time
res-10
olution of 20 s. In order to be able to discern possible interferences from fluorescence of other trace gases, the offline background signals were recorded alternately at each side of the OH fluorescence wavelength. We have found that there is no significant in-terference for the instrument at the wavelength of the OH Q1(2) line (Ren et al., 2004). One of the two offline points, which has longer wavelength, was used to identify the
15
naphthalene fluorescence, as described in Sect. 3.1.
Zero air with a constant naphthalene mixing ratio required for instrument calibration and other studies in the laboratory was produced by passing a constant flow of zero air through a drying tube filled with naphthalene and cooled to 0◦C. The naphthalene mixing ratio in this air flow is determined by the saturated vapor pressure of
naphtha-20
lene, which is 0.763 Pa at 0◦C (Wania et al., 1994). A flow rate of 30-300 standard cubic centimeters per minute (sccm) of air containing this naphthalene vapor was then diluted with 13-40 standard liters per minute (slpm) of zero air to attain various mixing ratios of naphthalene and was supplied to the GTHOS inlet.
ACPD
4, 343–363, 2004 Measuring atmospheric naphthalene with laser-induced fluorescence M. Martinez et al. Title Page Abstract Introduction Conclusions References Tables Figures J I J I Back Close Full Screen / EscPrint Version Interactive Discussion 3. Results and discussion
3.1. Spectrum Identification of naphthalene fluorescence
The background signals recorded with GTHOS/ATHOS at one side of the OH on-line were usually identical within the noise to the background signals recorded at the other side. Only occasionally, when measurements were conducted in highly polluted air,
5
the background signals at the two offline wavelengths differed significantly. On these occasions the background signal at 308.0026 nm, which in the following we will call the “red offline”, was significantly higher than the background signal at 307.9876 nm, in the following called the “blue offline”, and sometimes even higher than the OH fluorescence signal when the atmospheric naphthalene mixing ratio was high.
10
Enhanced red offline signals appeared sporadically in our measurements in several field campaigns in urban environments. Field measurements in Nashville, TN, during the Southern Oxidant Study (SOS99), in Houston, TX, during the Texas Air Quality Study (TexAQS2000), and in New York City during the PM2.5 Technology Assessment and Characterization Study, New York (PMTACS-NY2001) sometimes showed these
15
enhanced background signals during nighttime, when the boundary layer was shal-low and stable enough to accumulate high levels of pollutants. We also observed the enhanced red offline occasionally when ATHOS was installed on the NASA DC-8 air-craft inside the NASA Dryden hangar, at Edwards Air Force Base, CA, in preparation for the Transport and Chemical Evaluation over the Pacific (TRACE-P) measurement
20
campaign, especially when the motorized gangway was moved around the DC-8. Dur-ing this campaign, a strongly enhanced red offline was further observed at the airport at Kona, Hawaii, while the DC-8 was waiting for takeoff on the runway right behind the NASA P-3 aircraft. On several occasions, the enhanced red offline signals were recorded at and near the airport of Hong Kong.
25
During TRACE-P in the Dryden hangar and at Kona, wavelength spectra of the flu-orescence were recorded by tuning the ATHOS dye laser while the red offline signal was strongly enhanced. The spectra show several features in addition to the
ACPD
4, 343–363, 2004 Measuring atmospheric naphthalene with laser-induced fluorescence M. Martinez et al. Title Page Abstract Introduction Conclusions References Tables Figures J I J I Back Close Full Screen / EscPrint Version cence lines of ambient OH. The similarity of these features to the absorption lines of
naphthalene as reported by Dorn et al. (1988) and by Neuroth et al. (1991) prompted us to measure naphthalene fluorescence spectra with GTHOS in the laboratory. Com-parison of the spectra taken in the field and the naphthalene spectra taken in the labo-ratory strongly indicates that the enhanced red offline corresponds to the fluorescence
5
of naphthalene (Fig. 1). As naphthalene is a constituent of petroleum and its refined products, it can be expected to appear in urban air polluted by traffic as well as in aircraft exhaust.
3.2. Calibration
The sensitivity of GTHOS/ATHOS for OH and naphthalene was determined in the
lab-10
oratory for the different configurations used in several field missions and normalized to the OH sensitivities measured in the field. A detailed description of the OH calibration can be found in Faloona et al. (2004). For the naphthalene calibration, an air flow with various naphthalene mixing ratios between 5 and 80 parts per billion by volume (ppbv, 10−9) were supplied to the GTHOS inlet as described in Sect. 2. Calibrations show that
15
the fluorescence signal is linear with naphthalene mixing ratio over this range (Fig. 2). The sensitivity was then calculated from the mean ratio of the signal normalized to laser power exiting the White cell and the mixing ratio. Table 1 summarizes the sensitivities and experimental conditions for the campaigns where we have observed naphthalene. Water vapor reduces the sensitivity for OH by quenching the OH excited state
20
molecules (Bailey et al., 1999). Therefore the sensitivity of our instrument for OH must be corrected for the effect of varying water vapor that is encountered in the field (Faloona et al., 2004). For naphthalene no significant reduction of the sensitivity was observed when water vapor mixing ratios of 2.5% were added to the zero air used as carrier gas (Fig. 2).
ACPD
4, 343–363, 2004 Measuring atmospheric naphthalene with laser-induced fluorescence M. Martinez et al. Title Page Abstract Introduction Conclusions References Tables Figures J I J I Back Close Full Screen / EscPrint Version Interactive Discussion 3.3. Lifetime of naphthalene fluorescence
The lifetime of the naphthalene fluorescence was studied in the laboratory by narrowing the counter gate to ∼15 ns and varying the period between the laser pulse and the start time of the counter gate. The fluorescence starts with the excitation of the fluorescing molecules and after that decays exponentially. The total decay rate,Γ, comprises the
5
radiative decay rate, γnat(1/γnatis the radiative lifetime), and the non-radiative decay of the excited state by collisional deactivation with nitrogen, oxygen, and water molecules, as described by the rate coefficients, kN
2, kO2, and kH2O, respectively. The quenching rate coefficients of OH and their temperature dependences have been determined by Bailey et al. (1997; 1999). The decay rate is related to the fluorescence intensity and
10
can be expressed as
Intensity=[OH∗]oexp(−Γt) Γ=γnat+ kN
2(T )[N2]+ kO2(T )[O2]+ kH2O(T )[H2)], (1) where [OH∗]o is the initial population of excited state OH(A2Σ) established from the laser excitation, t is time, [] denotes the number density of the enclosed chemical species, and the quenching rate coefficients have been written as functions of
temper-15
ature, T , since their quenching efficiency increases at lower temperatures. The same equation can be applied to calculate the quenching of the naphthalene fluorescence.
We determined the radiative lifetime and the quenching rate coefficients for naph-thalene at 297 K by studying the decay of the naphnaph-thalene fluorescence at different detection pressures and with pure nitrogen, pure oxygen and zero air as carrier gases.
20
Figure 3a shows the fluorescence signal decay with time observed for OH and naph-thalene in zero air at 4.5 hPa. The fluorescence lifetime measured for OH in 4.5 hPa of air is 138±5 ns, in good agreement with the fluorescence lifetime of 132±4 ns calcu-lated from the quenching coefficients determined by Bailey et al. (1997) at 294 K. The fluorescence lifetimes for naphthalene in N2and O2derived from exponential fits to the
25
measured decays are plotted in Figs. 3b and 3c.
The fluorescence lifetime of naphthalene decreases with pressure in both oxygen and nitrogen. The quenching rate coefficients, kN
2 and kO2, can be calculated from 349
ACPD
4, 343–363, 2004 Measuring atmospheric naphthalene with laser-induced fluorescence M. Martinez et al. Title Page Abstract Introduction Conclusions References Tables Figures J I J I Back Close Full Screen / EscPrint Version Eq. (1) using the decay rates measured at pure nitrogen and pure oxygen,
respec-tively, yielding kN 2 (297 K) = (1.98±0.18)×10 −11 cm3 molecule−1 s−1 and kO 2(297 K) = (2.43±0.08)×10−10
cm3 molecule−1 s−1. Oxygen contributes more significantly to the quenching of naphthalene fluorescence than nitrogen by a factor of 12. Collisions with water molecules do not deactivate excited naphthalene molecules significantly, as
5
shown in Fig. 2. The upper limit for the quenching coefficient of naphthalene with water, kH
2O, as derived from the humid N2and O2lifetimes and their statistical uncertainties, is ∼1.3×10⁻¹⁰cm3 molecule−1 s−1 (297 K). The sensitivity numbers in Table 1 would only decrease by about 3–6% if kH
2O is equal to this upper limit at H2O mixing ratios of 1.5–3.5% measured during the campaigns. The radiative lifetimes calculated by
ex-10
trapolating the decay rates in nitrogen and oxygen to 0 hPa are in good agreement, yielding an average radiative lifetime of 340±10 ns.
3.4. Field measurements 3.4.1. SOS99
We first observed naphthalene in the atmosphere during the SOS99 campaign, which
15
took place in Nashville, TN, in summer 1999. The detection limit, as given by the 2σ noise of the 30-min averages of the naphthalene signal, was about 35 pptv during this campaign.
Enhanced naphthalene mixing ratios were usually observed during nights when the wind speed was low and high levels of pollutants were detected. Figure 4 shows the
20
data collected during the campaign for naphthalene and NOx (=NO+NO2). Naphtha-lene correlated with pollutants like NOx and CO (r2=0.41 and 0.42, respectively), and especially with hydrocarbons, which, like naphthalene, are predominantly emitted by fuel combustion, such as n-pentane and i-butanal (r2=0.55 and 0.53, respectively).
ACPD
4, 343–363, 2004 Measuring atmospheric naphthalene with laser-induced fluorescence M. Martinez et al. Title Page Abstract Introduction Conclusions References Tables Figures J I J I Back Close Full Screen / EscPrint Version Interactive Discussion 3.4.2. TexAQS2000
Naphthalene, along with OH and HO2, was measured as a part of the multi-investigator study TexAQS2000, which took place in Houston, Texas in August and September 2000 (Fig. 5).
We only occasionally observed naphthalene above detection limits, which were
simi-5
lar to Nashville. Like in Nashville, enhanced naphthalene mixing ratios in Houston were observed during nights with low wind speed and high pollutant concentrations, however wind speeds were generally higher than in Nashville. Due to the small number of occa-sions when naphthalene reached measurable values, correlation with other pollutants is poor (R2=0.07 for NOxand 0.12 for CO). However, the strong enhancement in
naph-10
thalene lasting for several hours in the early morning of September 5 (Julian day= 249) coincided with CO levels of up to 900 ppbv, the highest measured during the campaign, and enhanced NOx of up to 60 ppbv.
3.4.3. TRACE-P
Highly polluted air was sampled in Hong Kong airport and sometimes during the last
15
minutes before landing in Hong Kong. Naphthalene mixing ratios there were typically a few hundred pptv.
At Kona airport, while the DC-8 was waiting for takeoff on the runway right behind the NASA P-3 aircraft and thus sampling air strongly polluted by the P-3 exhaust, measured naphthalene mixing ratios reached 3 ppbv.
20
3.4.4. PMTACS-NY2001
Naphthalene was also measured during the PMTACS-NY field campaign, which took place in New York City in summer 2001. The optics and their arrangement were im-proved between TexAQS2000 and PMTACS-NY and the sensitivity in OH detection cell was increased (Table 1). The background-limited naphthalene detection limit was
25
ACPD
4, 343–363, 2004 Measuring atmospheric naphthalene with laser-induced fluorescence M. Martinez et al. Title Page Abstract Introduction Conclusions References Tables Figures J I J I Back Close Full Screen / EscPrint Version typically 6 pptv, for 2σ confidence and a 10-min integration time. Naphthalene was
continuously measured for about one month from 30 June to 2 August 2001 (Fig. 6). The typical diurnal variation of naphthalene had the maximum naphthalene appear-ing in the early mornappear-ing, with an average mixappear-ing ratio up to about 40 pptv (Fig. 7), and the minimum naphthalene in the late afternoon, with an average mixing ratio of about
5
12 pptv. The day-to-day diurnal variation was large. The highest observed naphthalene mixing ratio was about 250 pptv, which was observed in the early morning of 21 July 2001 (Julian day= 202) (Fig. 6). Naphthalene correlated very well with NOx(r2=0.56), indicating that both have same sources, most likely vehicle exhaust. Good correlation was also found between naphthalene and CO (r2=0.56), and between naphthalene
10
and total non-methane hydrocarbons (NMHC) (r2=0.46).
4. Conclusions
We have established a new method for gas-phase naphthalene measurements in the atmosphere using laser-induced fluorescence technique at low pressure. The fluo-rescence spectrum of naphthalene near 308 nm is identified. Calibrations performed
15
with a range of naphthalene mixing ratios between 5 and 80 ppbv show that the flu-orescence is linear with naphthalene mixing ratio over this range. The detection limit of the current GTHOS is 20 pptv for 2σ uncertainty and 1-min integration, compara-ble to or better than other fast techniques, e.g. ∼12 pptv for DOAS technique for 2σ confidence and a 200-s integration (Brandenburger et al., 1998) and ∼100 pptv for
20
PTR-MS technique for 2σ confidence and a 40-s integration (M. Alexander, personal communication, 2003). Naphthalene fluorescence quenching by O2, N2 and H2O was studied. Quenching rate coefficients of N2 and O2 were measured to be kN
2 (297
K) = (1.98±0.18)×10−11 cm3 molecule−1 s−1 and kO
2 (297 K) = (2.43±0.08)×10
−10 cm3 molecule−1 s−1 while the upper limit for the quenching rate coefficient for H2O is
ACPD
4, 343–363, 2004 Measuring atmospheric naphthalene with laser-induced fluorescence M. Martinez et al. Title Page Abstract Introduction Conclusions References Tables Figures J I J I Back Close Full Screen / EscPrint Version Interactive Discussion of LIF for detecting naphthalene in the ambient air. Atmospheric naphthalene mixing
ratio has been measured at three urban sites, Nashville, TN, Houston, TX, and New York City, NY, and good correlation between naphthalene and several pollutants that are predominantly emitted by fuel combustion is found.
Acknowledgements. This work is supported by grants primarily from NSF (ATM-9974335), and
5
NOAA (40RANR901074 and 40RANROM1560) for the measurements in Nashville and Hous-ton, and from the U.S. EPA through State University of New York at Albany (cooperative agree-ment # R828060010) for the measureagree-ments in New York City. The authors thank the science teams who participated in these campaigns, and especially E. J. Williams, C. A. Stroud, and J. J. Schwab for providing the NOxand hydrocarbon data used in this work.
10
References
Arey, J., Atkinson, R., Zielinska, B., and McElroy, P. A.: Diurnal concentrations of volatile poly-cyclic aromatic hydrocarbons and nitroarenes during a photochemical air pollution episode in Glendora, California, Environ. Sci. Technol., 23, 321–327, 1989.
Atkinson, R. and Arey, J.: Atmospheric chemistry and gas-phase polycyclic aromatic hydrocar-15
bons: formation of atmospheric mutagens, Environ. Health Perspect., 102, Suppl. 4, 117– 126, 1994.
Bailey, A. E., Heard, D. E., Paul, P. H., and Pilling, M. J.: Collisional quenching of OH(A2Σ+, v’=0) by N2, O2, and CO2between 204 and 294 K. Implications for atmospheric
measure-ments of OH by laser-induced fluorescence, J. Chem. Soc., Faraday Trans., 93, 2915–2920, 20
1997.
Bailey, A. E., Heard, D. E., Henderson, D. A., and Paul, P. H.: Collisional quenching of OH (A2Σ+, v’=0) by H2O between 211 and 294 K and the development of a unified model for quenching, Chem. Phys. Lett., 302, 132–138, 1999.
Brandenburger, U., Brauers, T., Dorn, H. -P., Hausmann, M., and Ehhalt D. H.: In-situ measure-25
ments of tropospheric hydroxyl radicals by folded long-path laser absorption during the field campaign POPCORN, J. Atmos. Chem., 31, 181–204, 1998.
Cam, D., Gagni, S., Meldolesi, L., and Galletti, G.: Determination of polycyclic aromatic
ACPD
4, 343–363, 2004 Measuring atmospheric naphthalene with laser-induced fluorescence M. Martinez et al. Title Page Abstract Introduction Conclusions References Tables Figures J I J I Back Close Full Screen / EscPrint Version
drocarbons in sediment using solid-phase microextraction with gas chromatography mass spectrometry, J. Chromatogr. Sci., 38, 55–60, 2000.
Dieke, G. H. and Crosswhite H. M.: The ultraviolet bands of OH, J. Quant. Spectr. Rad. Trans., 2, 97–111, 1962.
Dorn, H.-P., Callies, J., Platt, U., and Ehhalt, D. H.: Measurement of tropospheric OH concen-5
trations by laser long-path absorption spectroscopy, Tellus, 437–445, 1988.
Faloona, I. C., Tan, D., Lesher, R. L., Hazen, N. L., Frame, C. L., Simpas, J. B., Harder, H., Mar-tinez, M., Di Carlo, P., Ren, X., and Brune, W. H.: A laser induced fluorescence instrument for detecting tropospheric OH and HO2: Characteristics and calibration, J. Atmos. Chem., in press, 2004.
10
Finlayson-Pitts, B. J. and Pitts, J. N.: Atmospheric Chemistry: Fundamentals and experimental techniques, John Wiley & Sons, New York, 1986.
Fraser, M. P., Cass, G. R., Simoneit, B. R. T., and Rasmussen, R. A.: Air quality model evalua-tion data for organics. 5. C6-C22nonpolar and semipolar aromatic compounds, Environ. Sci.
Technol., 32, 1760–1770, 1998. 15
Hard, T. M., O’Brien, R. J., Chan, C. Y., and Mehrabzadeh A. A.: Tropospheric free radical determination by FAGE, Environ. Sci. Technol., 18, 768–777, 1984.
Hewitt, C. N., Hayward, S., and Tani, A.: The application of proton transfer reaction-mass spectrometry (PTR-MS) to the monitoring and analysis of volatile organic compounds in the atmosphere, J. Environ. Monit., 5, 1–7, 2003.
20
Neuroth, R., Dorn, H. -P., and Platt, U.: High resolution spectral features of a series of aromatic hydrocarbons and BrO: Potential interferences in the atmospheric OH-measurements, J. Atmos. Chem., 12, 278–298, 1991.
Ren, X., Harder, H., Martinez, M., Faloona, I., Tan, D., Lesher, R. L., Di Carlo, P., Simpas, J. B., and Brune, W. H.: Interference testing for atmospheric HOxmeasurements by laser-induced 25
fluorescence. J. Atmos. Chem., in press, 2004.
Sasaki, J., Aschmann, S. M., Kwok, E. S. C., Atkinson, R., and Arey, J.: Products of the gas-phase OH and NO3 radical-initiated reactions of naphthalene, Environ. Sci. Technol., 31, 3173–3179, 1997.
Stevens, P. S., Mather, J. H., and Brune, W. H.: Measurement of tropospheric OH and HO2by 30
ACPD
4, 343–363, 2004 Measuring atmospheric naphthalene with laser-induced fluorescence M. Martinez et al. Title Page Abstract Introduction Conclusions References Tables Figures J I J I Back Close Full Screen / EscPrint Version Interactive Discussion
Chem. Eng. Data, 39, 572–577, 1994.
Williamson, K. S., Petty, J. D., Huckins, J. N., Lebo, J. A., and Kaiser, E. M.: HPLC-PFD determination of priority pollutant PAHs in water, sediment, and semipermeable membrane devices, Chemosphere, 49, 703–715, 2002.
5
ACPD
4, 343–363, 2004 Measuring atmospheric naphthalene with laser-induced fluorescence M. Martinez et al. Title Page Abstract Introduction Conclusions References Tables Figures J I J I Back Close Full Screen / EscPrint Version
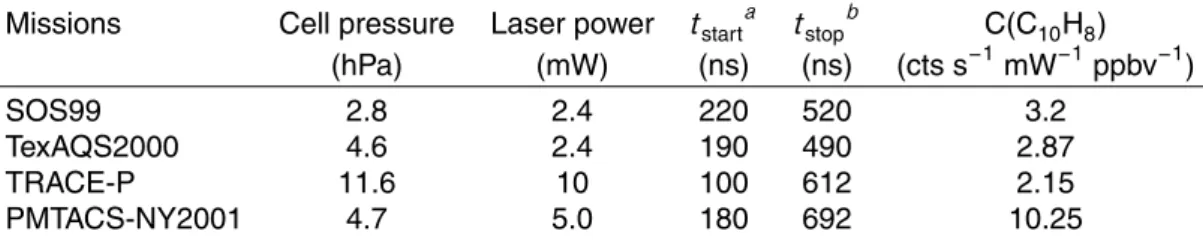
Table 1. GTHOS/ATHOS sensitivities for naphthalene in zero air for different instrument
config-urations, characterized by pressure in the detection volume, power of the laser beam exiting the White cell, and the measurement start and stop times after the laser pulse exited the detection volume. The 1σ-uncertainties for the naphthalene sensitivities are about 20%.
Missions Cell pressure Laser power tstarta tstopb C(C10H8) (hPa) (mW) (ns) (ns) (cts s−1mW−1ppbv−1) SOS99 2.8 2.4 220 520 3.2 TexAQS2000 4.6 2.4 190 490 2.87 TRACE-P 11.6 10 100 612 2.15 PMTACS-NY2001 4.7 5.0 180 692 10.25 a
: tstart: start time of integration gate after the laser pulse exited the detection chamber.
b
ACPD
4, 343–363, 2004 Measuring atmospheric naphthalene with laser-induced fluorescence M. Martinez et al. Title Page Abstract Introduction Conclusions References Tables Figures J I J I Back Close Full Screen / EscPrint Version Interactive Discussion c C10H8 307.98 308.0 308.02 308.04 wavelength [nm] fl u o re s c e n c e s ig n a l [a .u .] d OH C10H8 308.12 308.14 308.16 308.18 wavelength [nm] OH b P-3 exhaust a NY air Q1(3) Q1(2)
Fig. 1. Fluorescence spectra. Row (a): ambient air recorded in New York City; Row (b):
ambient air recorded for wavelengths near the Q1(2) and Q1(3) OH transitions at Kona airport while waiting for takeoff behind the NASA P-3 aircraft, sampling its exhaust; Row (c) and (d): naphthalene and the OH reference recorded in the laboratory for wavelengths near the Q1(2) and Q1(3) OH transitions. The solid vertical lines indicate the wavelengths used for the offline measurements. The spectral resolution in row (b) is lower due to faster scanning.
ACPD
4, 343–363, 2004 Measuring atmospheric naphthalene with laser-induced fluorescence M. Martinez et al. Title Page Abstract Introduction Conclusions References Tables Figures J I J I Back Close Full Screen / EscPrint Version
0
100
200
300
400
500
0
20
40
60
Naphthalene (ppbv)
S
ignal (
c
ts
s
-1mW
-1)
80
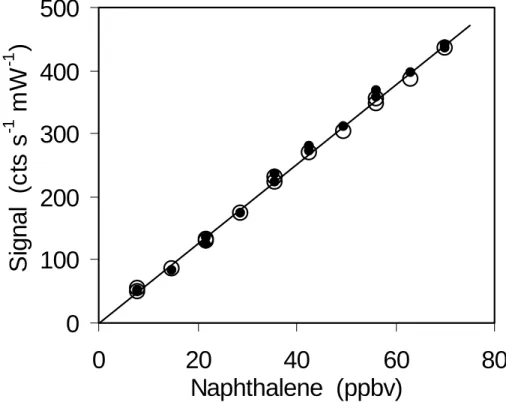
Fig. 2. Calibration of naphthalene LIF in dry zero air (solid circles) and in zero air containing
about 2.5% water vapor (open circles). For dry air the sensitivity was 6.3±0.2 cts s−1 mW−1 ppbv−1. The sensitivity in humid air of 6.2±0.1 cts s−1 mW−1 ppbv−1 was the same within 1σ error limits.
ACPD
4, 343–363, 2004 Measuring atmospheric naphthalene with laser-induced fluorescence M. Martinez et al. Title Page Abstract Introduction Conclusions References Tables Figures J I J I Back Close Full Screen / EscPrint Version Interactive Discussion 100 150 200 250 0 500 1000 1500 2000
measurement start time [ns]
fl u o re s c e n c e s ig n a l [a .u .] OH C10H8 (a) 0 1x10¹⁷ 2x10¹⁷ 3x10⁶ 4x10⁶ 5x10⁶ 6x10⁶ (b) C10 H8 f luor quenching r a te [s -1 ] N2 density [cm-3] 0 1x10¹⁷ 2x10¹⁷ 1x10⁷ 2x10⁷ 3x10⁷ 4x10⁷ (c) C10 H8 f luor quenching r a te [s -1 ] O2 density [cm-3]
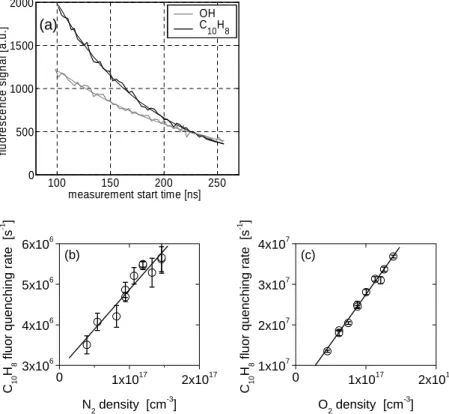
Fig. 3. Laboratory lifetime studies of naphthalene fluorescence. Panel (a): Variation of the
fluorescence signal with time after excitation and simple exponential fits for OH (grey) and naphthalene (black) in 4.5 hPa zero air. The fluorescence lifetimes derived from the exponen-tial fits are 138±5 ns for air and 90±2 ns for naphthalene. Panel(b): quenching rate of the
naphthalene fluorescence as a function of nitrogen density, giving a least squares linear fit of y= 1.98×10⁻¹¹x+ 2.87×10⁶(r2=0.93); Panel (c): quenching rate of the naphthalene fluores-cence as a function of oxygen density, giving a least squares linear fit of y= 2.43×10⁻¹⁰x + 3.00×10⁶(r2=0.99).
ACPD
4, 343–363, 2004 Measuring atmospheric naphthalene with laser-induced fluorescence M. Martinez et al. Title Page Abstract Introduction Conclusions References Tables Figures J I J I Back Close Full Screen / EscPrint Version
0
100
200
300
C
10H
8[p
p
tv
]
170 176 182 188 194
0
50
100
150
Julian day, CST
NO
x[p
p
b
v
]
Fig. 4. Naphthalene and NOxmixing ratios measured in Nashville, TN, during SOS99, from 19 June to 16 July 1999.
ACPD
4, 343–363, 2004 Measuring atmospheric naphthalene with laser-induced fluorescence M. Martinez et al. Title Page Abstract Introduction Conclusions References Tables Figures J I J I Back Close Full Screen / EscPrint Version Interactive Discussion
0
100
200
300
C
10H
8[p
p
tv
]
230 236 242 248 254
0
50
100
150
Julian day, CST
NO
x[p
p
b
v
]
Fig. 5. Naphthalene and NOx mixing ratios measured in Houston, TX, during TexAQS2000, from 17 August to 16 September 2000.
ACPD
4, 343–363, 2004 Measuring atmospheric naphthalene with laser-induced fluorescence M. Martinez et al. Title Page Abstract Introduction Conclusions References Tables Figures J I J I Back Close Full Screen / EscPrint Version 0 100 200 300 C 10 H 8 [p pt v] 0 100 200 300 182 186 190 194 198 202 206 210 214
Julian day of 2001, EDT
NO x [ p pt v]
Fig. 6. Naphthalene and NOx mixing ratios in New York City, during the PMTACS-NY2001 campaign from 1 July to 3 August 2001.
ACPD
4, 343–363, 2004 Measuring atmospheric naphthalene with laser-induced fluorescence M. Martinez et al. Title Page Abstract Introduction Conclusions References Tables Figures J I J I Back Close Full Screen / EscPrint Version Interactive Discussion
0
10
20
30
40
50
0:00
6:00
12:00
18:00
0:00
Time of day, EDT
N
a
pht
halene [
ppt
v
]
Fig. 7. Average diurnal profile of naphthalene in 30 min intervals.