HAL Id: hal-00300844
https://hal.archives-ouvertes.fr/hal-00300844
Submitted on 12 Jun 2002HAL is a multi-disciplinary open access
archive for the deposit and dissemination of sci-entific research documents, whether they are pub-lished or not. The documents may come from teaching and research institutions in France or abroad, or from public or private research centers.
L’archive ouverte pluridisciplinaire HAL, est destinée au dépôt et à la diffusion de documents scientifiques de niveau recherche, publiés ou non, émanant des établissements d’enseignement et de recherche français ou étrangers, des laboratoires publics ou privés.
The UV-visible absorption cross-sections of IONO2
J. C. Mössinger, D. M. Rowley, R. A. Cox
To cite this version:
J. C. Mössinger, D. M. Rowley, R. A. Cox. The UV-visible absorption cross-sections of IONO2. Atmospheric Chemistry and Physics Discussions, European Geosciences Union, 2002, 2 (3), pp.765-788. �hal-00300844�
ACPD
2, 765–788, 2002 The IONO2 absorption cross-sections J. C. M ¨ossinger et al. Title Page Abstract Introduction Conclusions References Tables Figures J I J I Back CloseFull Screen / Esc
Print Version Interactive Discussion
c
EGS 2002
Atmos. Chem. Phys. Discuss., 2, 765–788, 2002 www.atmos-chem-phys.org/acpd/2/765/
c
European Geophysical Society 2002
Atmospheric Chemistry and Physics Discussions
The UV-visible absorption cross-sections
of IONO
2
J. C. M ¨ossinger1, D. M. Rowley1,2, and R. A. Cox1
1
Centre for Atmospheric Science, Chemistry Department, University of Cambridge, UK
2
Present address Chemistry Department, University College London, UK Received: 8 April 2002 – Accepted: 3 June 2002 – Published: 12 June 2002 Correspondence to: J. C. M ¨ossinger (jcm34@hermes.cam.ac,uk)
ACPD
2, 765–788, 2002 The IONO2 absorption cross-sections J. C. M ¨ossinger et al. Title Page Abstract Introduction Conclusions References Tables Figures J I J I Back CloseFull Screen / Esc
Print Version Interactive Discussion
c
EGS 2002
Abstract
The UV-visible absorption spectrum of gaseous IONO2 has been measured over the wavelength range 245–415 nm using the technique of laser photolysis with time-resolved UV-visible absorption spectroscopy. IONO2 was produced in situ in the gas phase by laser flash photolysis of NO2/CF3I/N2 mixtures. Post-flash spectra were deconvolved 5
to remove contributions to the observed absorption from other reactant and product species. The resulting spectrum attributed to IONO2 consists of several overlapping broad absorption bands. Assuming a quantum yield of unity for IONO2 photolysis, model calculations show that during sunlit hours at noon, 53◦N, the first order solar photolysis rate coefficient (J value) for IONO2is 4.6 × 10⁻²s−1.
10
1. Introduction
Iodine chemistry has been implicated in tropospheric ozone depletion since the 1980s (Chameides and Davis, 1980; Davis et al., 1996; Jenkin et al., 1985). Atmospheric iodine source gases are readily photolysed by sunlight, yielding iodine atoms. Iodine atoms react with ozone forming IO. Any subsequent reactions of IO forming an iodine 15
atom lead to catalytic ozone loss. In competition, IO can be sequestered into reservoir species. One of the main gaseous reservoir species for iodine in the atmosphere is believed to be IONO2(Chameides and Davis, 1980; Davis et al., 1996; Jenkin, 1992; Jenkin et al., 1985).
IONO2is formed by the reaction of IO with NO2 20
IO+ NO2+ M → IONO2+ M (R1)
The rate of formation of IONO2in reaction (1) is well known (De More et al., 1997) but the amount of IONO2 residing in the atmosphere and its consequent impact on the atmospheric chemistry depends on its loss processes. Gas phase IONO2 loss processes include photolysis, thermal decomposition and heterogeneous uptake. 25
ACPD
2, 765–788, 2002 The IONO2 absorption cross-sections J. C. M ¨ossinger et al. Title Page Abstract Introduction Conclusions References Tables Figures J I J I Back CloseFull Screen / Esc
Print Version Interactive Discussion
c
EGS 2002
IONO2can be photolysed via two possible routes:
IONO2+ hν → IO + NO2 (R2a)
→ I+ NO3 (R2b)
However, no studies of the absorption cross-sections, the photolysis quantum yields or the products of IONO2photolysis have been reported to date.
5
Thermal decomposition of IONO2could proceed as in reaction (3).
IONO2−→ IO∆ + NO2 (R3)
However, recent observations imply that reaction (3) is a slow process at ambient temperature (Dillon, 2001; Plane, 2002).
A recent study has provided the first experimental evidence that IONO2can be lost 10
from the gas phase via a heterogeneous process. In a laboratory study, Holmes et al. (2001) showed that IONO2is taken up efficiently by dry and frozen salt surfaces to form the di-halogens IBr and ICl, which are then released back into the gas phase.
IONO2 has been synthesised in the laboratory in solution. However, IONO2 was found to be unstable and the first attempts to observe its ultraviolet-visible absorption 15
spectrum failed (Schmeisser and Braendle, 1961). The absorption cross-sections for IONO2 in the UV-visible are essential, in order to evaluate the daytime atmospheric photolysis rate of IONO2and the efficiency of the tropospheric ozone loss cycle involv-ing IONO2.
Broske and Zabel (1998) attempted to measure the gas phase UV-visible absorp-20
tion spectrum of IONO2 by photolysis of I2/NO2mixtures in a large reaction chamber equipped for in situ spectroscopy. A diode array detector was used to monitor the UV-visible absorption spectrum. However, because of the low concentrations of IONO2 produced under their experimental conditions and the presence of strong absorbers such as INO2, produced by the reaction of iodine atoms produced from I2 photoly-25
sis with NO2, they were unable to retrieve the spectrum of IONO2. Nevertheless, the UV-visible absorption spectrum of gaseous INO2was reported (Atkinson et al., 2000).
ACPD
2, 765–788, 2002 The IONO2 absorption cross-sections J. C. M ¨ossinger et al. Title Page Abstract Introduction Conclusions References Tables Figures J I J I Back CloseFull Screen / Esc
Print Version Interactive Discussion
c
EGS 2002
In order to avoid the effects of complicating chemistry involving iodine atoms pro-duced in the IO source reactions, as well as the effects of secondary chemistry, a pulsed laser photolysis system and a photochemical source of IO with no initial iodine atom production (NO2/CF3I) was used in this study. We report here, for the first time observation of a gas phase ultraviolet-visible spectrum attributed to IONO2. The results 5
were used to calculate the atmospheric photolysis rates of IONO2, and the atmospheric chemistry of IONO2is discussed briefly.
2. Experimental
The IONO2 absorption spectrum was obtained using the technique of laser flash pho-tolysis with UV absorption spectroscopy, utilising a CCD detection system. The appa-10
ratus has been described in detail elsewhere (Rowley et al., 1996), therefore only a brief description is given here.
During an experiment gases were flowed slowly and continuously through a 98.2 cm long cylindrical quartz cell kept at a total pressure of 760 Torr. Reactions were initiated in the cell using a pulsed excimer laser beam passed longitudinally along the 15
cell. Concentrations of reactant and product gases in the cell were monitored using UV-vis absorption spectroscopy. The analysis light beam from a xenon arc lamp was passed through the cell, counter propagating the laser beam, and focused onto the entrance slit of a 0.25 m focal length astigmatic Czerny-Turner spectrograph fitted with three interchangeable diffraction gratings ruled at 150, 300 and 600 grooves/mm. In 20
order to protect the spectrograph and detector from impinging reflected laser light a narrow band filter was used in the 350 nm region. Wavelength resolved analysis light from the spectrograph was then imaged across the top 30 rows of a CCD detector, to record spectra. Signal (charge) transfer then enabled recording of sequential spectra, which were acquired before, during and after photolysis.
25
ACPD
2, 765–788, 2002 The IONO2 absorption cross-sections J. C. M ¨ossinger et al. Title Page Abstract Introduction Conclusions References Tables Figures J I J I Back CloseFull Screen / Esc
Print Version Interactive Discussion c EGS 2002 reaction scheme: NO2+ hν → NO + O(3P) (R4) O(3P)+ CF3I → CF3+ IO (R5) IO+ NO2+ M → IONO2+ M (R1) CF3+ NO2→ CF2O+ FNO (R6) 5
net : 3NO2+ CF3I → CF2O+ FNO + IONO2
The reaction was initiated using 351 nm XeF excimer laser photolysis of NO2to form O(3P) (DeMore et al., 1997). N2(Messer, 99.996%), 2000 ppm NO2in N2(Messer) and CF3I (Fluorochem, 99%) were used as supplied. Gas mixtures were flowed through the reaction cell at a total pressure of 760 Torr and at 298 K via mass flow controllers or 10
ball flow meters (for NO2in N2) and their concentrations (see Table 1 for concentrations used) were calculated from known calibrated flow rates. Postflash absorbance spectra were recorded relative to preflash spectra using Beer’s law (A = ln(Ipreflash/Ipostflash)). Consequently, the observed absorbances show changes in absorption brought about by the laser flash and by subsequent chemistry. The total absorption spectrum of the 15
gas mixture was recorded using a 150 g/mm and a 300g/mm grating giving a 130 nm and a 65 nm wavelength coverage respectively. In the 245–335 nm region the 150g/mm grating was used with a 50 µm spectrograph entrance slit giving a resolution (fwhm) of 1.67 nm. In the 385–415 nm region the 300g/mm grating was used with a 10
µm entrance slit and a resolution (fwhm) of 0.55 nm. In both cases a CCD was used
20
to record sequential spectra at a time resolution of 1 ms.
Under the conditions chosen (Table 1) numerical models show that the chemistry of IO and CF3dominates, as O(3P) reacts mainly (93%) with CF3I. In addition, only small amounts of NO are expected (from NO2photolysis and the O(3P)+ NO2reaction (7%))
ACPD
2, 765–788, 2002 The IONO2 absorption cross-sections J. C. M ¨ossinger et al. Title Page Abstract Introduction Conclusions References Tables Figures J I J I Back CloseFull Screen / Esc
Print Version Interactive Discussion
c
EGS 2002
and I atom production from the reaction IO+ NO → I + NO2is consequently unimpor-tant. Thus, the possible formation of INO2via reaction I+ NO2+ M → INO2+ M is un-likely. IONO2is expected to be the only major iodine containing product formed under the experimental conditions used, as the reaction of NO2with IO dominates over other possible reactions with IO. Thus, the IONO2spectrum can in principle be obtained from 5
the experimental spectrum, after subtraction of the absorption due to CF2O and FNO formed via reaction (6) and addition of absorbance due to NO2 and CF3I consumed in reactions (4) and (5), respectively. However, it should be noted that the yield for reaction (5) is 0.85 (Gilles et al., 1996). The identity of the remaining reaction channels is unknown (Gilles et al., 1996). Other products that could be formed via reaction (5) 10
such as IF or CF3IO could also contribute to the overall absorption spectrum obtained. However, since their absorption cross-sections have not been reported to date it is not possible to correct for their contribution to the overall absorption. Thus an uncertainty of ± 15% remains in the IONO2spectrum determined. Other secondary and side re-actions that occur were taken into account by using the numerical integration package 15
FACSIMILE (Curtis and Sweetenham, 1987) to model the post flash chemistry in order to calculate the final product distribution. Details of the chemical reaction scheme used are listed in Table 2. Spectra were not recorded below 245 nm or between 335–385 nm, due to low light levels of the analysis light beam in these regions, the latter due to the attenuation by the laser beam filter in the 350 nm region. The overall error on the 20
IONO2 absorption cross-sections including the uncertainty due to the unknown reac-tion channels menreac-tioned above is 25%. This excludes possible systematic errors that could result from the chemical mechanism used in the FACSIMILE model.
3. Results and discussion
The absorption spectrum recorded in the short wavelength region (245–345 nm) of 25
the spectrum (Fig. 1), i.e. the absorbance calculated relative to pre-laser intensities, represents the change in absorption due to the overall chemical reaction initiated by
ACPD
2, 765–788, 2002 The IONO2 absorption cross-sections J. C. M ¨ossinger et al. Title Page Abstract Introduction Conclusions References Tables Figures J I J I Back CloseFull Screen / Esc
Print Version Interactive Discussion
c
EGS 2002
the laser flash. In the analysis it was assumed that only the 5 principal species (NO2, CF3I, FNO, CF2O and IONO2) contribute to this absorption. Thus a negative change in absorption results from NO2and CF3I consumption and a positive change in absorption due to IONO2, CF2O and FNO production make up the observed spectrum. The post flash spectrum obtained was reproducible and remained constant over the time-scale 5
of the spectral acquisition (the photolysed gas flowed out of the cell over a period of 10–15 s). The total absorption spectrum measured and the absorption spectrum of IONO2can be expressed as shown in Eq. (1) and (2), respectively.
Atotal= AIONO
2+ ACF2O+ AFNO− ANO2− ACF3I (1)
AIONO
2 = Atotal− ACF2O− AFNO+ ANO2+ ACF3I (2)
10
Thus, IONO2 was found by spectral deconvolution. The contribution of each ab-sorber to the total absorption at each wavelength recorded during an experiment is given by:
A(λ)= σi(λ) × l ×∆ci (3)
where A(λ) is the absorbance of a species i at wavelength λ, l is the pathlength of the 15
reaction cell used [cm],∆c = change in concentration of species i [molecules cm−3] and σi(λ)= absorption cross-section of species i at that wavelength [molecule−1cm2]. In order to obtain the IONO2spectrum the amounts and the absorption cross-sections of all other chemical species involved have to be known.
The absolute cross-sections of CF3I, FNO and CF2O have been reported in the liter-20
ature (DeMore et al., 1997) and were smoothed to the spectral resolution used for the present experiment (CF2O only absorbs at wavelength shorter than 245 nm and its con-tribution to the overall absorption is thus not shown in Fig. 2). The change in concen-tration of each species after the laser flash is determined by the O atom concenconcen-tration produced from NO2photolysis in the flash and the stoichiometry of subsequent chem-25
ACPD
2, 765–788, 2002 The IONO2 absorption cross-sections J. C. M ¨ossinger et al. Title Page Abstract Introduction Conclusions References Tables Figures J I J I Back CloseFull Screen / Esc
Print Version Interactive Discussion
c
EGS 2002
system was constructed in the numerical integration package FACSIMILE (Curtis and Sweetenham, 1987). The model incorporated simulations of photolysis, flow out and the chemical reaction scheme given in Table 2. The model provided the simulated change in concentration of each species during an experiment for all given experimen-tal conditions with the initial post flash O atom concentration being the only variable. 5
The initial O atom concentration was determined from the change in NO2concentration in any given experiment, which itself was obtained from the measured initial change in absorption of NO2 and its cross-section. Together with the known cross-sections, the contribution of each species to the absorption spectra was then subtracted from the overall post flash spectrum recorded as shown in Fig. 2 for the 245–335 nm region of 10
the spectrum. The absorption cross-sections of IONO2 were then obtained assuming the remaining absorption was attributed to the simulated amount of IONO2 generated in the reaction. The same procedure was also applied to the data obtained in the longer wavelength region (385–415 nm) as shown in Fig. 3. However, in this wavelength re-gion only NO2absorbs significantly and thus the NO2 spectrum had to be subtracted 15
from the total absorption spectrum. The IONO2 absorption spectrum over the entire wavelength range of 245–415 nm was obtained by fitting the observed spectrum to three Gaussian functions. This enabled interpolation of the IONO2absorption in spec-tral regions where absorbance could not be recorded. The resulting spectrum consists of a broad continuous absorption band as shown in Fig. 4. The IONO2cross-sections 20
are listed in Table 3. The fact that the structural features of FNO and NO2do not ap-pear to a significant extent in the final spectrum provides support for the deconvolution procedure used. The IONO2 absorption spectrum obtained is compared in Fig. 5 to the INO2 spectrum (Atkinson et al., 2000). It is distinctly different, supporting the as-signment to IONO2. There is also a possibility of a contribution to the apparent IONO2 25
spectrum from formation of light scattering aerosol produced in the IO radical chem-istry. A maximum potential contribution to the absorption from aerosol was calculated assuming all absorption at λ = 450 nm was due to aerosol extinction and that the at-tenuation at lower wavelength followed a 1/λ4 functional dependence on wavelength.
ACPD
2, 765–788, 2002 The IONO2 absorption cross-sections J. C. M ¨ossinger et al. Title Page Abstract Introduction Conclusions References Tables Figures J I J I Back CloseFull Screen / Esc
Print Version Interactive Discussion
c
EGS 2002
After subtraction of this component the lower curve in Fig. 5 was obtained which corre-sponds to minimum values for the IONO2cross-sections. Examination of time resolved absorption spectra also show no evidence for time delayed aerosol growth for the first two experiments performed in a clean flow tube. After rapid formation of IONO2 the absorption remained constant over the whole time period of the experiment (500 ms). 5
Only after multiple experiments in the flow tube did we observe a time delayed increase in overall absorption with time, possibly due to the presence of aerosols, presumably formed in heterogeneous processes initiated on the walls of the reaction cell.
Figure 6 shows a comparison of the IONO2 absorption and the (IONO2-aerosol) absorption with those of ClONO2(Burkholder et al., 1994) and BrONO2(Burkholder et 10
al., 1995). All spectra show similar broad band absorption features. The absorption due to IONO2 is red shifted and is significantly more intense at all wavelengths than the chlorine and bromine analogues.
4. Atmospheric implications
The IONO2absorption cross-sections recorded here were used to calculate the tropo-15
spheric solar photolysis rate of IONO2using a photochemical box model (McFiggans et al., 2000). We assumed a quantum yield of unity for IONO2 photolysis throughout the absorption band. The resulting photolysis rate coefficient (J-value) for IONO2is shown in Fig. 7 as a function of time of day in the marine boundary layer, for July 53◦N at Mace Head, Ireland, where measurements of atmospheric composition had taken place in 20
1997. The calculated photolytic lifetime of IONO2under these conditions is less than one minute. At the same location and time, the surface to volume ratio (S/V) of the fine fraction of the sea-salt aerosol present was determined to be 60 ± 10 µm2cm−3 with an effective particle radius of 250 nm (McFiggans et al., 2000). Using these values, the lifetime of IONO2with respect to heterogeneous uptake on sea-salt aerosols, τhet 25
[s], was calculated to be ∼ 10 h using Eqs. (4) and (5) below, and assuming a reactive uptake coefficient of γ = 0.01 (Holmes et al., 2001). Equation (4) assumes spherical
ACPD
2, 765–788, 2002 The IONO2 absorption cross-sections J. C. M ¨ossinger et al. Title Page Abstract Introduction Conclusions References Tables Figures J I J I Back CloseFull Screen / Esc
Print Version Interactive Discussion
c
EGS 2002
geometry of the sea-salt particle. It also takes diffusion of IONO2to the particle surface into account (Turco et al., 1989).
khet= 0.25 × γ × ω × S/V
(1+ (3 × γ × r)/(4 × λ)) (4)
τhet= 1
khet (5)
where ω= the average molecular speed of IONO2at any given temperature [cm s−1], 5
khet = first order rate constant for loss of IONO2 on the aerosol [s−1], λ= mean free path of a molecule in air at any given temperature and pressure [cm].
During daytime, solar photolysis is thus expected to be the major loss process for IONO2 and IOx is not lost from the gas phase. However, the reaction of IONO2 with sea-salt aerosol may become a significant loss process for IONO2 during night time. 10
Uptake of IONO2is expected to form the di-halogens ICl and IBr (Holmes et al., 2001), which are released into the gas phase during the night. At dawn, IBr and ICl are photol-ysed. Hence IOxwould not be lost permanently from the gas phase via this reaction as suggested previously (Chatfield and Crutzen, 1990; Davis et al., 1996; Jenkin, 1992), and the uptake of IONO2represents a possible route to liberation of bromide and chlo-15
ride from sea-salt aerosols, as has been predicted by more recent modelling studies (McFiggans et al., 2000; Vogt et al., 1999). Thermal decomposition of IONO2 may also contribute to the night time loss of IONO2. However, recent observations seem to suggest that this will be a very slow process at room temperature (Plane, 2002). Depending upon the photolysis product yields, photolysis of IONO2 could contribute 20
ACPD
2, 765–788, 2002 The IONO2 absorption cross-sections J. C. M ¨ossinger et al. Title Page Abstract Introduction Conclusions References Tables Figures J I J I Back CloseFull Screen / Esc
Print Version Interactive Discussion c EGS 2002 IO+ NO2+ M → IONO2+ M (R1) IONO2+ hν → I + NO3 (R2b) NO3+ hν → NO + O2 (R7) NO+ O3→ NO2+ O2 (R8) I+ O3→ IO+ O2 (R9) 5 2O3→ 3O2
However, it is important to note, that this cycle will not operate if the products of IONO2photolysis are IO+ NO2. No studies of the photolysis products of IONO2 have been reported, and such studies are essential to elucidate further the role of atmo-spheric IONO2.
10
5. Conclusions
The UV-visible cross-sections of IONO2 have been determined over the wavelength ranges 240–335 nm and 385–415 nm Both data sets were used to interpolate an IONO2 absorption spectrum over the wavelength range of 240–415 nm. The result-ing spectrum consists of several overlappresult-ing broad absorption bands. Based on the 15
IONO2 absorption cross-section, the tropospheric solar photolysis rate coefficient of IONO2 has been calculated. This indicates that the photochemical lifetime of atmo-spheric IONO2is less than one minute under most sunlit conditions and consequently that photolysis is the main loss process for gaseous IONO2. Thus, IONO2 is thus not expected to act as a stable reservoir of atmospheric iodine during daytime.
20
Acknowledgements. The authors thank William Bloss for help with the experimental system
and Gordon McFiggans for calculating the photolysis rate coefficient for IONO2. Many thanks
to John Crowley for helpful comments on the manuscript. J. C. M ¨ossinger would like to thank Girton College Cambridge for a Junior Research Fellowship. D. M. Rowley would like to thank NERC for the award of an Advanced Fellowship.
ACPD
2, 765–788, 2002 The IONO2 absorption cross-sections J. C. M ¨ossinger et al. Title Page Abstract Introduction Conclusions References Tables Figures J I J I Back CloseFull Screen / Esc
Print Version Interactive Discussion
c
EGS 2002
References
Atkinson, R., Baulch, D. J., Cox, R. A., Hampson, Jr., R. F., Kerr, J. A. and Troe, J.: Evaluated Kinetic and Photochemical Data for Atmospheric Chemistry, Supplement VIII, J. Phys. Chem. Ref. Data, 167–266, 2000.
Burkholder, J. B., Ravishankara, A. R., and Solomon, S.: Temperature-dependence of the 5
ClONO2UV absorption spectrum, Geophys. Res. Lett., 21, 585–588, 1994.
Burkholder, J. B., Ravishankara, A. R., and Solomon, S.: UV visible and IR absorption cross-sections of BrONO2, J. Geophys. Res., 100, 16 793–16 800, 1995.
Broske, R. and Zabel, F.: The UV-visible absorption spectrum of IONO2, in Laboratory Experi-ments of Iodine Chemistry in the Stratosphere-LEXIS, EC, Brussels, 1998.
10
Chameides, W. L. and Davis, D. D.: Iodine: Its possible role in tropospheric photochemistry, J. Geophys. Res, 85, 7383–7393, 1980.
Chatfield, R. B. and Crutzen, P. J.: Are there interactions of iodine and sulfur species in marine air photochemistry, J. Geophys. Res, 95D, 22 319–22 341, 1990.
Curtis, A. R. and Sweetenham, W. P.: FACSIMILE, AERE Harwell publication R 12805, Com-15
puter Science and Systems Division, Harwell Laboratory, Oxfordshire, UK, 1987.
Davis, D., Crawford, J., Liu, S., McKeen, S., Bandy, A., Thornton, D., Rowland, F., and Blake, D.: Potential impact of iodine on tropospheric levels of ozone and other critical oxidants, J. Geophys. Res, 101, 2135–2147, 1996.
DeMore, W. B., Sander, S. P., Golden, D. M., Hampson, R. F., Kurylo, M. J., Howard, C. J., 20
Ravishankara, A. R., Colb, C. E., and Molina, M. J.: Chemical Kinetics and Photochemical Data for use in Stratospheric Modeling, Evaluation No 12. Pasadena, CA, Jet Propulsion Laboratory, 1997.
Dillon, T.: Ph.D. thesis, University of Leeds, UK, 2001.
Gilles, M. K., Turnipseed, A. A., Talukdar, R. K., Rudich, Y., Villalte, P. W., Huey, L. G., 25
Burkholder, J. B., and Ravishankara, A. R.: Reactions of O (P-3) with alkyl iodides: Rate coefficients and reaction products, J. Phys. Chem., 100, 14 005–14 015, 1996.
Holmes, N. S., Adams, J. W., and Crowley, J. N.: Uptake and reaction of HOI and IONO2 on frozen and dry NaCl/NaBr surfaces and H2SO4, PCCP, 3, 1679–1687, 2001.
Jenkin, M. E.: The photochemistry of iodine containing compounds in the marine boundary 30
layer, Technical Report AEA-EE-0405, Harwell Laboratory, Oxfordshire, UK, 1992.
ACPD
2, 765–788, 2002 The IONO2 absorption cross-sections J. C. M ¨ossinger et al. Title Page Abstract Introduction Conclusions References Tables Figures J I J I Back CloseFull Screen / Esc
Print Version Interactive Discussion
c
EGS 2002
behaviour, J. Atmos. Chem., 2, 359–375, 1985.
McFiggans, G., Plane, J. M. C., Allan, B. J., Carpenter, L. J., Coe, H., and O’Dowd, C.: A modelling study of iodine chemistry in the marine boundary layer, J. Geophys. Res.-Atmos, 105, 14 363–14 369, 2000.
Plane, J. M. C.: Thermal decomposition of IONO2, pers. commun., 2002. 5
Rowley, D. M., Harwood, M. H., Freshwater, R. A., and Jones, R. L.: A novel flash photolysis/UV absorption system employing charge-coupled device (CCD) detection: A study of the BrO+ BrO reaction at 298 K, J. Phys. Chem., 100, 3020–3031, 1996.
Schmeisser, M. and Braendle, K.: Halogennitrate und ihre Reaktionen, Angew. Chem., 73, 388–393, 1961.
10
Turco, R. P., Toon, O. B., and Hamill, P.: Heterogeneous physicochemistry of the polar ozone hole, J. Geophys. Res., 94, 16 493–16 510, 1989.
Vogt, R., Sander, R., von Glasow, R., and Crutzen, P. J.: Iodine chemistry and its role in halogen activation and ozone loss in the marine boundary layer: A model study, J. Atmos. Chem., 32, 375–395, 1999.
ACPD
2, 765–788, 2002 The IONO2 absorption cross-sections J. C. M ¨ossinger et al. Title Page Abstract Introduction Conclusions References Tables Figures J I J I Back CloseFull Screen / Esc
Print Version Interactive Discussion
c
EGS 2002
Table 1. Concentrations used and generated during an experiment
Before laser photolysis After laser photolysis/ O atom reaction N2/ molecules cm−3 2.5 × 10¹⁹ 2.5 × 10¹⁹ NO2/ molecules cm−3 4.0 × 10¹⁵ 3.9 × 10¹⁵ CF3I/ molecules cm −3 5.5 × 10¹⁶ 5.5 × 10¹⁶ CF3/ molecules cm−3 – 7.5 × 10¹³ IO/ molecules cm−3 – 7.5 × 10¹³ NO/ molecules cm−3 – 8.5 × 10¹³ NO3/ molecules cm−3 – 1.0 × 10¹²
ACPD
2, 765–788, 2002 The IONO2 absorption cross-sections J. C. M ¨ossinger et al. Title Page Abstract Introduction Conclusions References Tables Figures J I J I Back CloseFull Screen / Esc
Print Version Interactive Discussion
c
EGS 2002
Table 2. Chemical reaction scheme used in the FACSIMILE model (Curtis and Sweetenham, 1987)
Reaction Rate coeff. 295 K/cm−3 Reference molecule−1s−1 O(3P)+ NO2→ NO+ O2 1.10 × 10 −11 (DeMore, et al., 1997) O(3P)+ NO2→ NO3 4.20 × 10⁻¹² (DeMore, et al., 1997) O(3P)+ CF3I → CF3+ IO 1.10 × 10⁻¹¹(*0.85) (Addison, et al., 1979) NO2+ CF3→ CF2O+ FNO 1.53 × 10⁻¹¹ (Pagsberg, et al., 1998) NO+ CF3→ CF3NO 1.89 × 10⁻¹¹ (Ley, et al., 1995)
CF3+ CF3→ C2F6 8.32 × 10⁻¹² (Rossi and Golden, 1979) IO+ IO → 2I + O2 8.60 × 10⁻¹¹(*0.7) (Bloss, et al., 2001) IO+ IO → OIO + I 8.60 × 10⁻¹¹(*0.3) (Bloss, et al., 2001) O(3P)+ IO → O2+ I 1.20 × 10
−10
(DeMore, et al., 1997) IO+ NO2→ IONO2 9.00 × 10⁻¹² (DeMore, et al., 1997) I+ NO2→ INO2 7.50 × 10⁻¹² (DeMore, et al., 1997) I+ NO → INO 4.50 × 10⁻¹³ (DeMore, et al., 1997) IO+ NO → I + NO2 2.20 × 10⁻¹¹ (DeMore, et al., 1997) I+ INO2→ I2+ NO2 8.32 × 10⁻¹¹ (v.d. Bergh and Troe, 1976) I+ NO3→ IO+ NO2 4.50 × 10
−10
ACPD
2, 765–788, 2002 The IONO2 absorption cross-sections J. C. M ¨ossinger et al. Title Page Abstract Introduction Conclusions References Tables Figures J I J I Back CloseFull Screen / Esc
Print Version Interactive Discussion
c
EGS 2002
Table 3. The absorption cross-sections of IONO2at 298 K
λ/nm σ298/molecule cm−2 240 1.05 × 10⁻¹⁷ 245 1.40 × 10⁻¹⁷ 250 1.35 × 10⁻¹⁷ 255 1.19 × 10⁻¹⁷ 260 1.06 × 10⁻¹⁷ 265 9.85 × 10⁻¹⁸ 270 8.83 × 10⁻¹⁸ 275 8.54 × 10⁻¹⁸ 280 8.22 × 10⁻¹⁸ 285 7.71 × 10⁻¹⁸ 290 7.07 × 10⁻¹⁸ 295 6.47 × 10⁻¹⁸ 300 5.52 × 10⁻¹⁸ 305 5.16 × 10⁻¹⁸ 310 4.93 × 10⁻¹⁸ 315 4.83 × 10⁻¹⁸ 320 4.54 × 10⁻¹⁸ 325 4.46 × 10⁻¹⁸
ACPD
2, 765–788, 2002 The IONO2 absorption cross-sections J. C. M ¨ossinger et al. Title Page Abstract Introduction Conclusions References Tables Figures J I J I Back CloseFull Screen / Esc
Print Version Interactive Discussion
c
EGS 2002
Table 3. Continued...The absorption cross-sections of IONO2at 298 K
λ/nm σ298/molecule cm−2 325 4.46 × 10⁻¹⁸ 330 4.29 × 10⁻¹⁸ 335 4.00 × 10⁻¹⁸ 340 3.86 × 10⁻¹⁸ 345 3.69 × 10⁻¹⁸ 350 3.52 × 10⁻¹⁸ 355 3.34 × 10⁻¹⁸ 360 3.13 × 10⁻¹⁸ 365 2.90 × 10⁻¹⁸ 370 2.64 × 10⁻¹⁸ 375 2.37 × 10⁻¹⁸ 380 2.10 × 10⁻¹⁸ 385 1.82 × 10⁻¹⁸ 390 1.58 × 10⁻¹⁸ 395 1.29 × 10⁻¹⁸ 400 1.02 × 10⁻¹⁸ 405 8.29 × 10⁻¹⁹ 410 6.95 × 10⁻¹⁹ 415 6.03 × 10⁻¹⁹
ACPD
2, 765–788, 2002 The IONO2 absorption cross-sections J. C. M ¨ossinger et al. Title Page Abstract Introduction Conclusions References Tables Figures J I J I Back CloseFull Screen / Esc
Print Version Interactive Discussion
c
EGS 2002
Figure 1. Post flash absorption spectrum in the low wavelength region (245-340 nm) following flash photolysis of NO2-CF3I mixtures.
0 0.01 0.02 0.03 0.04 0.05 0.06 0.07 245 265 285 305 325 wavelength/nm Absorbance
Fig. 1. Post flash absorption spectrum in the low wavelength region (245–340 nm) following flash photolysis of NO2-CF3I mixtures.
ACPD
2, 765–788, 2002 The IONO2 absorption cross-sections J. C. M ¨ossinger et al. Title Page Abstract Introduction Conclusions References Tables Figures J I J I Back CloseFull Screen / Esc
Print Version Interactive Discussion
c
EGS 2002
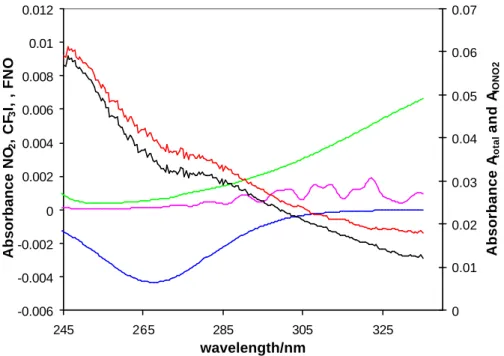
Figure 2. Spectral stripping procedure in the low wavelength region (245-335 nm). Note changes in scale on the left and right hand axis. Black, pink, green and blue lines show the total absorption spectrum and absorption of FNO, NO2, and CF3I respectively. The
red spectrum is attributed to IONO2 after the stripping procedure. The contribution of
CF2O is not shown as it only adsorbs below 245 nm.
-0.006 -0.004 -0.002 0 0.002 0.004 0.006 0.008 0.01 0.012 245 265 285 305 325 wavelength/nm Absorbance NO 2 , CF 3 I, , FNO 0 0.01 0.02 0.03 0.04 0.05 0.06 0.07 Absorbance A total and A IONO2
Fig. 2. Spectral stripping procedure in the low wavelength region (245–335 nm). Note changes in scale on the left and right hand axis. Black, pink, green and blue lines show the total ab-sorption spectrum and abab-sorption of FNO, NO2, and CF3I, respectively. The red spectrum is attributed to IONO2after the stripping procedure. The contribution of CF2O is not shown as it only adsorbs below 245 nm.
ACPD
2, 765–788, 2002 The IONO2 absorption cross-sections J. C. M ¨ossinger et al. Title Page Abstract Introduction Conclusions References Tables Figures J I J I Back CloseFull Screen / Esc
Print Version Interactive Discussion
c
EGS 2002
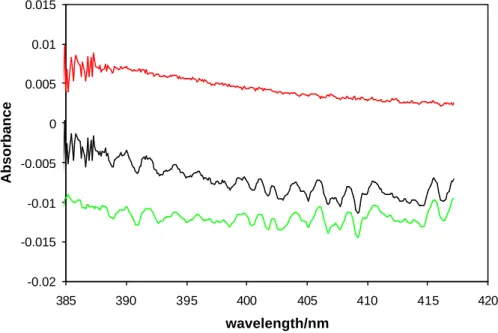
Figure 3. Spectral stripping procedure in the high wavelength region (385-415 nm). Black, green and red lines show the total absorption spectrum, absorption of NO2 and
IONO2 after the stripping procedure, respectively.
-0.02 -0.015 -0.01 -0.005 0 0.005 0.01 0.015 385 390 395 400 405 410 415 420 wavelength/nm Absorbance
Fig. 3. Spectral stripping procedure in the high wavelength region (385–415 nm). Black, green and red lines show the total absorption spectrum, absorption of NO2 and IONO2 after the stripping procedure, respectively.
ACPD
2, 765–788, 2002 The IONO2 absorption cross-sections J. C. M ¨ossinger et al. Title Page Abstract Introduction Conclusions References Tables Figures J I J I Back CloseFull Screen / Esc
Print Version Interactive Discussion
c
EGS 2002
Figure 4. Absorption spectrum of IONO2. Red line: data recorded in the 245-335 nm
region. Green line: data recorded in the 385-415 nm region. Black line: Fit to data.
1.00E-19 1.00E-18 1.00E-17 1.00E-16 245 275 305 335 365 395 425 wavelength/nm cross-section/molecule cm -2
Fig. 4. Absorption spectrum of IONO2. Red line: data recorded in the 245–335 nm region. Green line: data recorded in the 385–415 nm region. Black line: Fit to data.
ACPD
2, 765–788, 2002 The IONO2 absorption cross-sections J. C. M ¨ossinger et al. Title Page Abstract Introduction Conclusions References Tables Figures J I J I Back CloseFull Screen / Esc
Print Version Interactive Discussion
c
EGS 2002
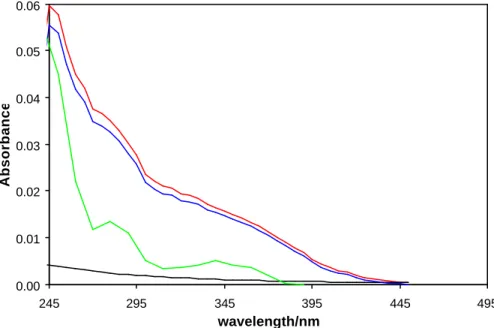
Figure 5. Comparison of the absorption spectrum of IONO2 (red), INO2 (green) recorded
by Broske and Zabel (1998) (scaled by using equal concentrations), the predicted absorption due to aerosol formation as a function of 1/λ4 (black) and the contribution due to aerosol absorption subtracted from the original absorption spectrum of IONO2 (blue).
0.00 0.01 0.02 0.03 0.04 0.05 0.06 245 295 345 395 445 495 wavelength/nm Absorbance
Fig. 5. Comparison of the absorption spectrum of IONO2 (red), INO2 (green) recorded by Broske and Zabel (1998) (scaled by using equal concentrations), the predicted absorption due to aerosol formation as a function of 1/λ4(black) and the contribution due to aerosol absorption subtracted from the original absorption spectrum of IONO2(blue).
ACPD
2, 765–788, 2002 The IONO2 absorption cross-sections J. C. M ¨ossinger et al. Title Page Abstract Introduction Conclusions References Tables Figures J I J I Back CloseFull Screen / Esc
Print Version Interactive Discussion
c
EGS 2002
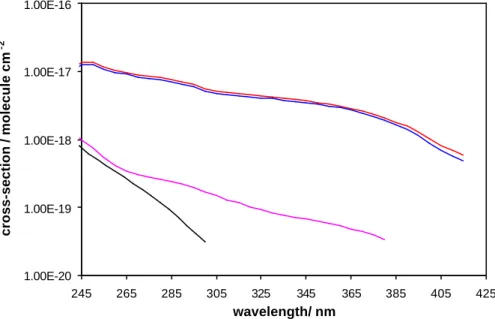
Figure 6. Comparison of the absorption spectra of ClONO2 (black), BrONO2 (pink),
IONO2 (red) and (IONO2-aerosol contribution) (blue).
1.00E-20 1.00E-19 1.00E-18 1.00E-17 1.00E-16 245 265 285 305 325 345 365 385 405 425 wavelength/ nm cross-section / molecule cm -2
Fig. 6. Comparison of the absorption spectra of ClONO2(black), BrONO2(pink), IONO2(red) and (IONO2-aerosol contribution) (blue).
ACPD
2, 765–788, 2002 The IONO2 absorption cross-sections J. C. M ¨ossinger et al. Title Page Abstract Introduction Conclusions References Tables Figures J I J I Back CloseFull Screen / Esc
Print Version Interactive Discussion
c
EGS 2002
Figure 7. J-values for IONO2 as a function of time of day in the marine boundary layer,
for midsummer 53 °N (Mace Head, Ireland, July 1997).
0 0.005 0.01 0.015 0.02 0.025 0.03 0.035 0.04 0.045 0.05 4:00 6:00 8:00 10:00 12:00 14:00 16:00 18:00 20:00 time of day/hours jIONO 2
Fig. 7. J-values for IONO2 as a function of time of day in the marine boundary layer, for midsummer 53◦N (Mace Head, Ireland, July 1997).