HAL Id: hal-00301574
https://hal.archives-ouvertes.fr/hal-00301574
Submitted on 1 Jan 2002
HAL is a multi-disciplinary open access
archive for the deposit and dissemination of
sci-entific research documents, whether they are
pub-lished or not. The documents may come from
teaching and research institutions in France or
abroad, or from public or private research centers.
L’archive ouverte pluridisciplinaire HAL, est
destinée au dépôt et à la diffusion de documents
scientifiques de niveau recherche, publiés ou non,
émanant des établissements d’enseignement et de
recherche français ou étrangers, des laboratoires
publics ou privés.
High resolution snow distribution data from complex
Arctic terrain: a tool for model validation
Ch. Jaedicke, A. D. Sandvik
To cite this version:
Ch. Jaedicke, A. D. Sandvik. High resolution snow distribution data from complex Arctic terrain: a
tool for model validation. Natural Hazards and Earth System Science, Copernicus Publications on
behalf of the European Geosciences Union, 2002, 2 (3/4), pp.147-155. �hal-00301574�
Natural Hazards and Earth System Sciences (2002) 2: 147–155 c
European Geosciences Union 2002
Natural Hazards
and Earth
System Sciences
High resolution snow distribution data from complex Arctic terrain:
a tool for model validation
Ch. Jaedicke1and A. D. Sandvik2
1University Courses at Svalbard, Box 156, N-9170 Longyearbyen, Norway
2Geophysical Institute, University of Bergen, Allegaten 70, N-5007 Bergen, Norway
Received: 20 September 2001 – Revised: 18 January 2002 – Accepted: 18 March 2002
Abstract. Blowing snow and snow drifts are common
fea-tures in the Arctic. Due to sparse vegetation, low tempera-tures and high wind speeds, the snow is constantly moving. This causes severe problems for transportation and infras-tructure in the affected areas. To minimise the effect of drift-ing snow already in the designdrift-ing phase of new structures, adequate models have to be developed and tested. In this study, snow distribution in Arctic topography is surveyed in two study areas during the spring of 1999 and 2000. Snow depth is measured by ground penetrating radar and manual methods. The study areas encompass four by four kilome-tres and are partly glaciated. The results of the surveys show a clear pattern of erosion, accumulation areas and the evolu-tion of the snow cover over time. This high resoluevolu-tion data set is valuable for the validation of numerical models. A simple numerical snow drift model was used to simulate the measured snow distribution in one of the areas for the winter of 1998/1999. The model is a two-level drift model coupled to the wind field, generated by a mesoscale meteorological model. The simulations are based on five wind fields from the dominating wind directions. The model produces a sat-isfying snow distribution but fails to reproduce the details of the observed snow cover. The results clearly demonstrate the importance of quality field data to detect and analyse errors in numerical simulations.
1 Introduction
In cold regions, such as the Arctic or alpine terrain, wind transport of snow plays an important role for the winter snow distribution. The snow is moved from exposed erosion areas to accumulation areas, forming a snow distribution pattern which is typical for the terrain and the prevailing wind condi-tions. The resulting snow pattern often interferes with the in-frastructure in these areas, causing problems for mobility and security. The accumulating snow masses block traffic lanes,
Correspondence to: Ch. Jaedicke (chrisj@unis.no)
bury houses and infrastructure, and significantly increase the risk of avalanches. Additionally, the decreased visibility on traffic lanes during snowstorms can cause severe difficulties for any vehicle.
These problems caused an early interest in the process of snow drift. Already Johnson (1852) observed and docu-mented areas in complex terrain, which can be exposed to snow accumulations, and tested a number of snow fences. Mellor (1965) gives an overview of the effects of snow drift on infrastructure. He shows that the consideration of snow drift in the design and the correct location of buildings and infrastructure can prevent severe problems. Snow fences are used to protect the effected areas from snowdrifts. They col-lect the blowing snow by breaking the natural wind flow. This causes turbulence in which the snow can settle down. Different snow fences were tested and applied by Tabler (1980, 1988, 1994), Zhonlong and Yuan (1980). Also, the design of roads and road structures can be improved to avoid snowdrift problems (Norem, 1974; Tabler, 1994).
The detailed study of drifting snow showed that saltation and suspension are the major transport modes (Budd et al., 1966; Pomeroy and Gray, 1990). The wind has to reach a cer-tain threshold velocity before the snow particles loosen from the surface (Schmidt, 1980). They start to jump up in hy-perbolas from the ground and saltate along the snow surface. As the wind speeds increases, lighter particles are picked up by the turbulent eddies of the boundary layer and are trans-ported in suspension. Airborne snow particles surrounded by unsaturated air will start to sublimate. This is a major loss of snow mass from seasonal snow covers to the atmosphere (Schmidt, 1972, Pomeroy et al., 1997; Bintanya, 1998; Dery et al., 1998; Mann et al., 2000). For the future design or for the improvement of structures in snowdrift areas, knowl-edge of the erosion and accumulation pattern in the terrain allows one to avoid the most affected areas. This kind of in-formation can be provided by field surveys (Norem, 1974) or three-dimensional numerical snowdrift models. Such mod-els are either based on a wind field generated by a separate wind model (Pomeroy et al., 1997; Liston and Sturm, 1998;
148 Ch. Jaedicke and A. D. Sadnvik: High resolution snow distribution data
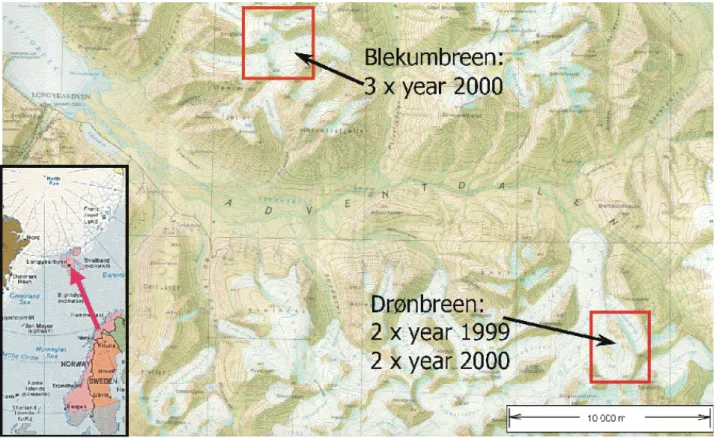
Fig. 1. Map of the valley Adventdalen showing the two study areas and the number of surveys during the field season 1999 and 2000. The
position of Spitsbergen in relation to the main land Norway is shown in the small map in the left corner.
Michaux et al., 2000) or use two-phase flow models to sim-ulate the snow transport (Gauer, 1998; Sundsbø and Bang, 1998; Thiis, 1999). For the development and verification of such models, high quality field data for the entire model do-main is needed.
This study presents high resolution snow distribution data in a complex terrain. The data covers two study areas which were surveyed for two and three times during the spring of 1999 and 2000, respectively. A ground penetrating radar sys-tem is developed for the application under Arctic conditions and is used for the surveys. The snow distribution in one of the study areas is simulated by a three-dimensional numeri-cal snowdrift model. The model numeri-calculates the snowdrift for the saltation and the suspension layer, based on wind fields generated by a mesoscale meteorological model.
2 Site description
The two study areas are located at 78◦N on the island of Spitsbergen about 40 km from the settlement Longyearbyen (Fig. 1). They are 4 × 4 km (Blekumbreen) and 3×4 km (Drønbreen) in size and reach from elevations of 300 m to 1000 m. The areas are partly covered by glaciers. The ice-free ground consists of moraine materials and sedimentary rock without higher vegetation. This is a good cross section of many typical features of the terrain of western Spitsber-gen. The annual mean air temperature is −6◦C and is −16◦C
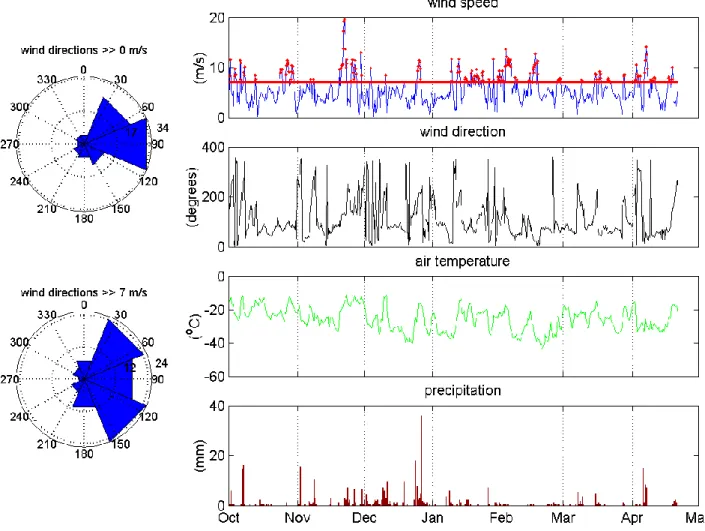
in the coldest period, February to March. The prevailing wind direction in the area is from the east during the win-ter months. The amount of annual precipitation in the area is estimated from Hagen et al. (1993) to be 600 mm/a. Fig-ure 2 shows the meteorological conditions during the winter season 1998/1999 taken from ECMWF (European Centre for Medium range Weather Forecast) re-analysis (six hour values at the 1000 hPa level). The precipitation data stems from the meteorological station at Longyearbyen airport. The absence of higher vegetation and melting periods during winter give ideal conditions for snowdrift experiments.
3 Field studies
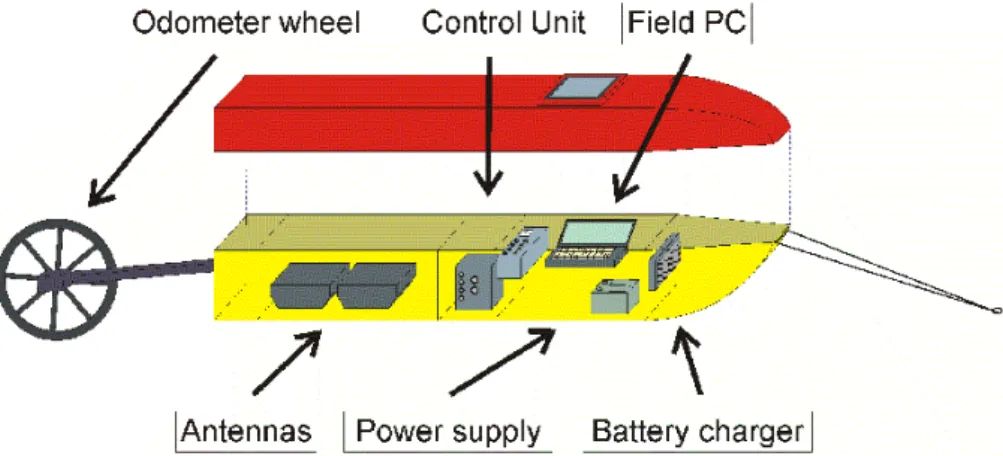
The snow distribution in the two study areas was surveyed during spring 1999 (Drønbreen) and spring 2000 (Blekum-breen). The snow depth was measured by a ground penetrat-ing radar (GPR) system. The GPR is based on a commer-cially available system (Sensors and software, 1995) which was further developed for the use in Arctic conditions. The whole system is moved in a specially designed sledge behind a snowmobile (Fig. 3). This sledge contains the radar anten-nas, the control unit, a field PC, GPS and a power supply. The electric power supply is based on a 12 V car battery and is designed to work in cold conditions down to −30◦C. The radar was triggered off every metre by an odometer wheel and data are continuously recorded on the field PC.
Ch. Jaedicke and A. D. Sadnvik: High resolution snow distribution data 149
Fig. 2. Meteorological conditions during the winter season 1998/1999 (ECMWF re-analysis, six hour values at the 1000 hPa level). The
precipitation data is derived from the meteorological station at Longyearbyen airport.
The GPR can be equipped with 225, 450 and 900 MHz antennas. The frequency of the system decides the penetra-tion depth and resolupenetra-tion of the instrument. High frequencies generate smaller wavelengths and allow for a higher resolu-tion while the penetraresolu-tion depth decreases. The 900 MHz an-tennas allow for a penetration of up to 10 m in snow, which is sufficient for the conditions in the study areas. The radar system measures the travel time from emitting the radar sig-nal into the ground until the receiver antenna detects the re-flected signal. The velocity of the electromagnetic waves in the snow has to be known to calculate the snow depth. Both snow density and the free water content of the snow influ-ences the velocity (Annan et al., 1995). A high content of free water will slow down the electromagnetic wave in wet snow. The velocity of the radar wave in snow can be found from manual measurements of the snow depth just between the antennas of the radar.
During the surveys the instrument was calibrated in the field by probing the snow several times with an avalanche probe. This calibration yields an accuracy of +/− 0.05 m snow depth at 900 MHz. The achieved radar profiles are digi-tised and the snow depth is calculated using the calibration
values from the survey. The water equivalent is calculated from the radar snow depth and snow densities, measured in several snow pits. A similar radar system was applied by Sand and Bruland (1998), who measured snow depth in sev-eral catchments on Spitsbergen.
Some of the radar profiles were continued manually in steep terrain, which was not accessible for the snowmo-bile. The snow free areas of bare ground were carefully ob-served and marked on a map. The radar profiles were marked with bamboo pins to allow for an accurate repetition of the measurements along the same lines. All profiles were posi-tioned by differential GPS. The radar, together with the man-ual measurements and bare ground observations, provide ap-proximately 17 000 data points for each survey.
4 Numerical modelling
4.1 Model structure
A simple three-dimensional snowdrift model is used to pre-dict the snow distribution in the study area. The model
150 Ch. Jaedicke and A. D. Sadnvik: High resolution snow distribution data
Fig. 3. Schematic plot of the radar sledge. The compartments contain from the left: Spare parts and cables, antennas, control unit, power
supply and computer, battery charger. The sledge is about 180 × 40 × 50 cm in size.
is based on wind fields generated by a meteorological mesoscale model. The wind fields are used to calculate the equilibrium snow drift flux at each grid point for a number of typical wind directions. Every six hours, the wind speed given by the ECMWF re-analysis is tested if it exceeds a cer-tain threshold value. If the wind speed is above this thresh-old, the wind field from the corresponding wind direction is activated. This creates a new snow cover, which is the start-ing point for the next six hour period.
4.2 Snowdrift model
The snowdrift model is mainly based on the work by Pomeroy et al. (1997) and Liston and Sturm (1998). The in-put wind speed at 10 m above the ground is generated by the wind model. The model calculates the flux of saltation Qsalt
and of suspension Qsuspfor each grid point of the simulated
wind field using constant values of threshold friction velocity u∗t h(0.25 m/s) and terminal fall velocity s (0.3 m/s). The
val-ues of snow concentration c(z) and wind speed u(z) are used, together with constant values of air temperature (−15◦C) and
relative humidity (80%), in a separate routine to calculate the sublimation from the airborne snow particles (Liston and Sturm, 1998).
4.3 Wind model
The non-hydrostatic numerical mesoscale model MEMO (Flassak, 1990; Moussiopoulos, 1994; Grøn˚as and Sandvik, 1999) was used to generate the wind fields for the study area. The model solves the momentum equation, the con-tinuity equation and optionally several transport equations for scalars on a staggered grid. The applied model ver-sion includes the following dependent variables of the three wind components: pressure, potential temperature and tur-bulent kinetic energy. The vertical coordinate is normalised to the underlying terrain. In the present study, the study area (Drønbreen), with a 50 m resolution, was enclosed in three nesting levels up to 500 m. Vertically, the atmosphere was divided exponentially into 25 terrain following layers from
10 m to 4000 m. Only one surface type, snow covered land (z0= 0.1 m) was used.
The wind field in the study area will be highly influenced by the atmospheric stability, wind speed and direction. Wter climatology at Spitsbergen is dominated by low-level in-versions due to net radiative loss of energy from the sur-face. The initial model atmosphere is stable stratified (con-stant potential temperature gradient equal to 0.71◦C/100 m and −15◦C at the surface). Five wind directions (N, NE, E, SE, S) were simulated, imposing a uniform wind of 10 m/s at the upstream boundary.
4.4 Coupling
The equilibrium snowdrift flux is calculated for each grid point in the model domain separately for the five wind di-rections. The resulting five erosion fields are applied on the model domain, depending on the wind direction and speed for every six hours during the winter season (1 November 1998 – 1 May 1999). For example, 8 m/s wind from 48◦in the ECMWF re-analysis activates the NE erosion field and produces a new snow distribution. Due to the limited access of only five wind fields, all wind speeds over the threshold will activate the same wind field based on the 10 m/s simula-tions. The threshold wind speed (7 m/s) is a tuning parameter to fit the model results to the observed snow distribution and is constant for the whole winter season.
The precipitation record from Longyearbyen airfield (an-nual precipitation 200 mm/a) is used to generate the precipi-tation in the study area. Based on the estimations of Hagen et al. (1993), the precipitation at Longyearbyen airfield is mul-tiplied by a factor of three and a height factor adjusts the precipitation in the study area. The initial snow depth is zero at all grid points and the distribution of snow starts after the first precipitation event.
Ch. Jaedicke and A. D. Sadnvik: High resolution snow distribution data 151
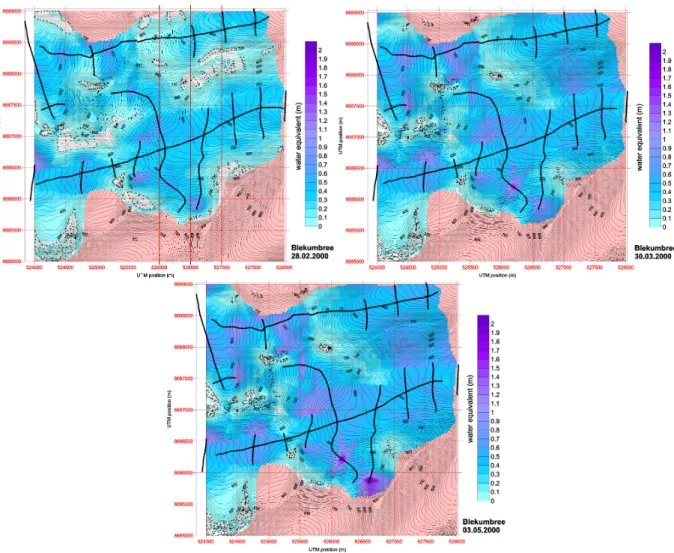
Fig. 4. Snow distribution in the Blekumbreen study area in spring 2000. The three plots show results from the surveys 28 February 2000,
30 March 2000 and 3 May 2000. Strong black lines are the radar profiles, black crosses indicate areas with bare ground. The pink areas are blank from the interpolation.
5 Results
5.1 Field data
The results from three surveys of the snow distribution in the Blekumbreen area are illustrated in Figs. 4a–c. The strong black lines show the radar profiles and crosses mark the ar-eas of bare ground. Together, they give a good impression of the data coverage. The data was interpolated to a 50 m grid using Kriging. Areas without data coverage are blanked to avoid misinterpretation. A detailed accumulation and ero-sion pattern can be seen in the plots. Mountain ridges and exposed backs are free of snow, while lee slopes and depres-sions collect most of the snow. The time in between the sur-veys is roughly one month and the increase of the snow depth can be seen from survey to survey. Accumulation areas in-crease their snow depth significantly more than the average. The average snow depth is increasing from 170 to 330 and 410 mm water equivalent (WEQ) for the three surveys. The maximum snow depth at the end of the season is 1600 mm
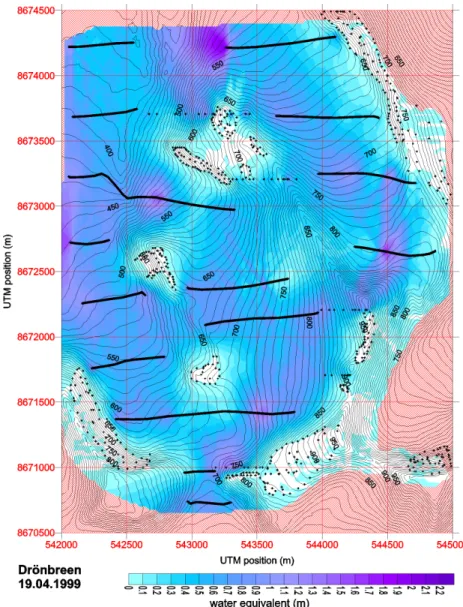
WEQ. Figure 5 shows the snow distribution in the study area on Drønbreen (4 × 3 km) at the end of the season 1999. It was surveyed by the same methods as described above. The situation on Drønbreen is simulated with the help of a nu-merical snowdrift model.
5.2 Numerical modelling
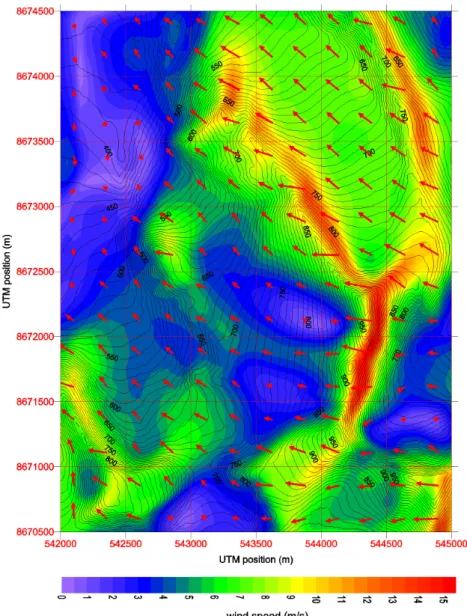
The wind field generated by the MEMO model for 10 m/s wind from the prevailing direction east is shown in Fig. 6. Wind speeds reach a maximum of 15 m/s on the mountain ridges and low wind speeds dominate in the valleys. The high resolution of 50 m includes many details around the to-pographic features in the study area. The wind directions vary significantly from place to place. Given an adequate snowdrift model, this is a good basis for detailed modelling of snow distribution in the area. The other directions (N, NE, SE, S) show similar features and including recirculation zones behind step ridges.
152 Ch. Jaedicke and A. D. Sadnvik: High resolution snow distribution data
Fig. 5. Measured snow depth in the Drønbreen area at the end of the winter season (19 April 1999). The black lines are the radar profiles,
black dots show areas with bare ground. The crossed areas are blank from the interpolation.
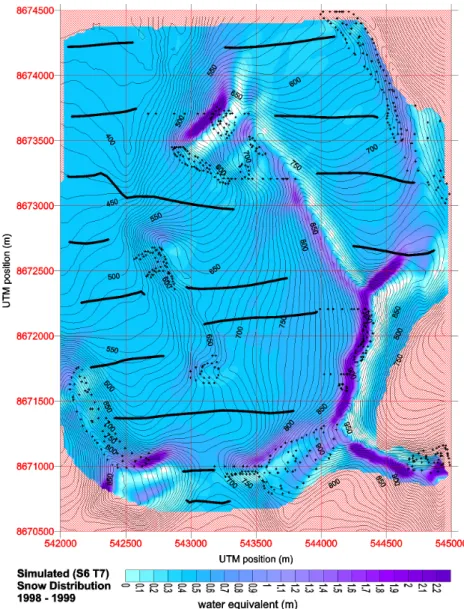
shown in Fig. 7. It gives a good overview of erosion and ac-cumulation areas. The erosion areas are located in the wind-ward slopes and are partly free of snow. The major part of the accumulation takes place in the lee slopes behind ridges and tops. On the smoother terrain, the simulated snow dis-tribution is rather uniform. The mean snow depths are 550 ±330 mm WEQ and 520 ± 380 mm WEQ in the model and the field data, respectively. The model gives a sublimation of 79 mm, compared to 410 mm precipitation during the model run.
6 Discussion
The applied field methods illustrate the snow distribution in the study areas and also the time evolution of the snow cover very well. The ground penetrating radar system allows one to cover large areas with little field effort, compared to manual
measurements. The pulling snowmobile, as well as the radar sledge itself, densify the snow on the radar profiles. This problem is eliminated by calibrating the radar on the track directly between the antennas under the radar sledge. Inter-polation of the field data by Kriging produces a snow distri-bution which could be expected in nature. The data coverage does not include steep slopes, introducing a larger interpola-tion error at these locainterpola-tions. Still, the data coverage is suf-ficient to include both accumulation and erosion areas in the plots. Small topographic features, such as melt water chan-nels and moraines, cause sudden snow depth changes over short distances of only a few metres. In comparison to field data based on a small number of transects (Pomeroy et al., 1997; Gauer, 1998) or aerial photography (Liston and Sturm, 1998), the presented data is an improvement in resolution and accuracy, and presents a valuable tool for the validation of three-dimensional snowdrift models.
nu-Ch. Jaedicke and A. D. Sadnvik: High resolution snow distribution data 153
Fig. 6. Wind field in the Drønbreen area for uniform wind (10 m/s) from east. The arrows show the wind direction. The wind speed is
indicated by the shading and the size of the arrows.
merical capability of simulating wind fields in steep moun-tainous terrain at a high resolution. The strongly vary-ing wind direction shows that statistical models that only change the wind speed in the terrain (Liston and Sturm, 1998; Pomeroy et al., 1997) are not applicable in complex terrain. However, the high computing capacities needed for such a model limit the number of cases which can be simulated. Five wind directions (N, NE, E, SE, S) at one wind speed (10 m/s), as used in this study, should be considered as the minimum number of needed wind simulations for our case.
The results of the drift model are promising, considering the simplicity of the model and the limited number of avail-able wind fields. The deviations of simulated and observed snow distribution may be caused by four major reasons:
1. The limited number of available wind fields. The ap-plied approach uses the same wind field for all wind speeds over the threshold value, causing an
underesti-mation of drift in very strong wind conditions. The lack of wind fields for different wind speeds causes the same erosion and accumulation areas for all wind speeds and prohibits the altering of erosion and accumulation pat-terns due to wind speed variations at a single grid point. Wind fields for five different wind speeds and eight wind directions should be used.
2. Equilibrium snowdrift profiles at all grid points. The as-sumption causes the drift transport to be higher behind bare ground areas than observed in nature. Takeuchi (1980) estimates the distance needed to achieve an equi-librium snowdrift profile to be 200–400 m. The effect of the needed fetch was included in models by Pomeroy et al. (1997), Liston and Sturm (1998) and Essery et al. (1999) and has to be implemented in future versions of the model.
154 Ch. Jaedicke and A. D. Sadnvik: High resolution snow distribution data
Fig. 7. Simulated snow depth in the Drønbreen area at the end of the winter season (19 April 1999). For orientation the data coverage from
the field survey is shown: strong black lines are radar profiles, black crosses indicate areas with bare ground. The pink areas are blank from the interpolation.
3. Constant threshold velocity throughout the winter. The response of the snow cover to the wind is strongly de-pendent on the threshold wind speed of the snow. Since the snow properties change with time, the threshold ve-locity should follow these changes.
4. Limited applicability of Pomeroy and Gray’s saltation formulation. The applied saltation routine may intro-duce an error to the drift concentration calculated for each grid point (Lehning et al., 2000).
The results from the simulation show that the use of station-ary wind fields is a promising approach. A complete clas-sification of wind fields for different speeds and directions is the first priority to improve the results. Furthermore, the assumption of equilibrium profiles should be replaced by a routine that considers the effect of the needed fetch.
7 Conclusion
High resolution snow distribution measurements by ground penetrating radar in two study areas produced a valuable data set for the validation of snowdrift models. The erosion and accumulation pattern, as well as the time evolution of the snow cover, is included in the data set. The applied ground penetrating radar is a practical tool to achieve high resolution data coverage with a comparably low field effort.
A three-dimensional snowdrift model has been developed and was tested against the field data. The model is based on wind simulation from a mesoscale meteorological model, which is able to produce detailed wind fields in steep com-plex terrain. The comparison of the drift model results with the field data shows that the model produces promising snow distributions from the five applied wind fields. A complete classification of wind fields for different wind speeds and
di-Ch. Jaedicke and A. D. Sadnvik: High resolution snow distribution data 155 rections is needed to improve the results. The high resolution
snowdrift data will help to verify the results of future snow-drift models.
Acknowledgements. Thanks to O. Brandt for the field assistance and the technical unit at UNIS for the support. The Norwegian Polar Institute gratefully provided the topographic data. The work was founded by the Norwegian Research Council, project num-ber 122462/720 and 121740/410. Supercomputing resources were made available by the Norwegian Research Council.
References
Annan, A. P., Cosway, S. W., and Sigurdsson, T.: GPR for snowpack water content. Proceedings of the Fifth International Conference on Ground Penetrating Radar (Kitchener, Ontario, Canada): 465–476, 1995.
Bintanja, R.: The contribution of snowdrift sublimation to the sur-face mass balance of Antarctica, Annals of Glaciology, 27: 251– 259, 1998.
Budd, W. F., Dingle, W. B. J., and Radok, U.: The Byrd snow drift project: outline and basic results, in Ruben, M. J., ed: Studies in Antarctic meteorology, Washington, D.C., AGU, (Antarctic research series, 9, 71–87, 1966.
Dery, S. J., Taylor, P. A., and Xiao, J.: The thermodynamic effects of sublimating, blowing snow in the atmospheric boundary layer, Boundary layer meteorology, 89, 251–283, 1998.
Essery, R., Long, L., and Pomeroy, M.: A distributed model of blowing snow over complex terrain, Hydrological processes, 13, 2423–2438, 1999.
Flassak, T.: Ein nicht-hydrostatisches Model zur Beschreibung der Dynamik der planetaren Grenzschicht, Ber. VIDZ, Reihe 15, VDI Verlag D¨usseldorf, Germany, 1990.
Gauer, P.: Blowing and drifting snow in alpine terrain: numerical simulation and related field measurements, Proceedings of the in-ternational symposium on snow and avalanches, Chamonix, An-nals of Glaciology, 26, 174–178, 1998.
Grøn˚as, S. and Dagrun Sandvik, A.: Numerical Simulations of local winds over steep orography in the storm over north Norway on 12 October 1996, J. of Geophysical Research, 104, 1–12, 1999. Hagen, J. O., Liestol, O., Roland, E., and J¨orgensen, T.: Glacier
At-las of Svalbard and Jan Mayen, Norwegian Polar Institute, mede-leser, No. 129, 145, 1993.
Johnson, G. D. B.: Nogle ord om snedreev, snefog och snefonner, P. T. Mallings forlags boghande, Christiania, Reprinted in faximilia Scientia et Tecnica Norvegica 31, NTH, Trondheim, 1969, 22, 1852.
Lehning, M., Doorschot, J., and Bartelt, P.: A snowdrift index based on SNOWPACK model calculations, Annals of Glaciology, 31,
5382–3865, 2000.
Liston, G. E. and Sturm, M.: A snow-transport model for complex terrain, J. Glaciology, 44, 498–516, 1998.
Mann, G. W., Anderson, P. S., and Mobbs, S. D.: Profile measure-ments of blowing snow at Halley, Antarctica, J. of Geophysical Research, 24 491–24 585, 2000.
Mellor, M.: Blowing Snow. Cold regions science and engineering part iii, section A3c, Hanover, New Hampshire: 80, 1965. Michaux, J. L., Naaim-Bouvet, F., Naaim, M.: Drifting snow
stud-ies over an mountainous instrumented site: Measurements and numerical model at small scale, Annals of Glaciology, 32, 2000. Moussiopolous, N.: The Zooming model, model structure and ap-plication, EUROTRAC Int. Sci. Secr., Garmisch-Patenkirchen, Germany: 260, 1994.
Norem, H.: Utforming av veger i drivsn¨oomr˚ader (design of roads in drift snow areas), Norges Tekniske Ho¨ogskole, Trondheim: 131, 1974.
Pomeroy, J. W. and Gray, D. M.: Saltation of snow, Water resources research, 26, 1583–1594, 1990.
Pomeroy, J. W., Marsh, P., and Gray, D. M.: Application of a dis-tributed blowing snow model to the Arctic, Hydrological pro-cesses, 11, 1451–1464, 1997.
Sand, K. and Bruland, O.: Application of Georadar for snow cover surveying, Nordic Hydrology, 2, 4–5, 361–370, 1998.
Schmidt, R. A.: Sublimation of wind transported snow- a model, U. S. forest service research paper no. RM-90, Rocky Mountain forest range experiment station, U. S. department of agriculture, Fort Collins, May, 24, 1972.
Schmidt, R. A.: Threshold Wind-speeds and elastic impact in snow transport, J. Glaciology, 26: 453–467, 1980.
Sensors and software: pulseEKKO 1000 ground penetrating radar system, user’s guide: Sensors and Software inc., Canada, 80, 1995.
Sundsbø, P. A. and Bang, B.: Calculation of snow drift around road-side safety barriers. Proceedings of the international snow sci-ence workshop 1998, Sunriver, Oregon, 279–283, 1998. Tabler, R. D.: Geometry and density of drifts formed by snow
fences, J. Glaciology, 26, 405–419, 1980.
Tabler, R. D.: Snow fence handbook, Tabler association, Laramie, Wyoming, 1988.
Tabler, R. D.: Design guidelines for the control of blowing snow, National research council, Washington, 364, 1994.
Takeuchi, M.: Vertical Profile and horizontal increase of drift snow transport, J. Glaciology, 26, 481–492, 1980.
Thiis, T. K.: A comparison of simulations and full scale measure-ments of snowdrifts around buildings, Wind and structures, 3, 1–10, 1999.
Zhonglong, W. and Yuan, C.: Research on prevention of snowdrifts by blower fences, J. Glaciology, 26, 435–445, 1980.
