HAL Id: hal-00513877
https://hal.archives-ouvertes.fr/hal-00513877
Submitted on 1 Sep 2010
HAL is a multi-disciplinary open access
archive for the deposit and dissemination of sci-entific research documents, whether they are pub-lished or not. The documents may come from teaching and research institutions in France or
L’archive ouverte pluridisciplinaire HAL, est destinée au dépôt et à la diffusion de documents scientifiques de niveau recherche, publiés ou non, émanant des établissements d’enseignement et de recherche français ou étrangers, des laboratoires
For Peer Review Only
Introducing Dislocation Climb by Bulk Diffusion in Discrete Dislocation Dynamics
Journal: Philosophical Magazine & Philosophical Magazine Letters Manuscript ID: TPHM-07-Sep-0259.R1
Journal Selection: Philosophical Magazine Date Submitted by the
Author: 28-Jan-2008
Complete List of Authors: Mordehai, Dan; CEA/Saclay, SRMP Clouet, Emmanuel; CEA, SRMP Fivel, Marc; INPG, CNRS/SIMAP Verdier, Marc; INPG, CNRS/SIMAP Keywords: diffusion, dislocation dynamics Keywords (user supplied): dislocation climb, dislocation loops
Note: The following files were submitted by the author for peer review, but cannot be converted to PDF. You must view these files (e.g. movies) online.
Climb_basic3D_final.tex climb_PhilMag.bib philmag.bst rotating.sty tPHM2e.cls upmath.sty
For Peer Review Only
LMPGM, Universit´e Lille, 59655 Villeneuve d’Ascq Cedex, FRANCE3SIMaP, Grenoble INP, CNRS/UJF, BP 75, 38402 St Martin d’H`eres, FRANCE
(September 2007)
We report a method to incorporate dislocation climb controlled by bulk diffusion in a 3-dimensional discrete dislocation dynamics (DDD) simulation for fcc metals. In this model we couple the vacancy diffusion theory to the DDD in order to obtain the climb rate of the dislocation segments. The model capability to reproduce the motion of climbing dislocations is examined by calculating several test-cases of pure climb-related phenomena and comparing the results with existing analytical predictions and experimental observations. As test cases, the DDD is used to study the activation of Bardeen-Herring sources upon the application of an external stress or under vacancy supersaturation. Loop shrinkage and expansion due to vacancy emission or absorption is shown to be well described by our model. In particular, the model naturally describes the coarsening of a population of loops having different sizes.
1 Introduction
It is known that dislocations play a role in metals plasticity and that the dynamic evolution of their microstructure in the bulk governs the macroscopic mechanical properties. One of the main computational tools to study the dynamic collective evolution of dislocations in a solid under an external loading at the mesoscopic scale is Dislocation Dynamics (DD). In this simulation technique each dislocation is represented as an elastic entity, which obeys certain rules for motion and interaction with other dislocations, such as drag force upon gliding, cross-slip, junction formation etc. Based upon these rules, DD simulations were used to study the role of the dislocation microstructure in strain hardening [1,2], nanoindentation [3], low-strain fatigue [4], crack-tip plasticity [5] etc. However, in order to perform a quantitative creep deformation analysis in a DD simulation, it is first required to define reliable rules for dislocation climb.
Diffusion-controlled dislocation climb is a non-conservative motion that occurs by absorbing or emitting point defects into and from dislocations. Accordingly, a mesoscopic level simulation that aims to include dislocation climb should also take into consideration the diffusion of point defects. As far as we know, no 3-dimensional DD simulation has been coupled with the diffusion theory of point defects in order to calculate the climb rate, whereas the vast majority of the DD calculations either prohibit motion in the climb direction or treats climb as the conservative glide motion, i.e. with a typical constant drag coefficient for climb motion.
Several groups introduced dislocation climb in a two-dimensional DD simulations. Amodeo and Ghoniem [6] assumed a proportional dependency between the climb force and the climb rate, based upon the phe-nomenological expression for the dislocation climb rate given by Argon et al. [7]. However, this method was used to perform a study of persistent slip bands, in timescales where climb is negligible, while the sug-gested climb mechanism was omitted and dislocations were restricted to glide, with a postulated minimum distance between glide planes to represent dislocation dipole annihilation via climb.
A model of the same principles, but with a different proportionality factor between the climb rate and the climb force, was taken in the two-dimensional DD technique presented by Roters et al. [8]. Nevertheless, their model was utilized to determine the stress-strain curve of Al under torsion state at 300 K, a problem
∗Corresponding author. Email: [email protected]
Philosophical Magazine 14 15 16 17 18 19 20 21 22 23 24 25 26 27 28 29 30 31 32 33 34 35 36 37 38 39 40 41 42 43 44 45 46 47 48 49 50 51 52 53 54 55 56 57 58 59 60
For Peer Review Only
which is mostly glide-dominated, and the authors did not report what was the contribution of the climbing segments to their calculations or what was the ability of this model to describe accurately dislocation climb. Several other classes of mesoscopic calculations attempted to treat dislocation climb. Ghoniem et al. developed a Parametric Dislocation Dynamics (PDD), in which the equation of motion of dislocation loops was obtained from an energy variational principle [9]. In this analysis they included in the Gibbs energy the contribution of the chemical potential due to absorption or emission of point defects at dislocations, i.e. the osmotic force. In addition, thermal dislocation climb is introduced through a constant drag coefficient for motion in the climb direction, of the same manner that is introduced for glide. Another technique was suggested by Xiang et al., who proposed an implementation of the three-dimensional level-set method for DD calculations [10]. They postulated that the climb rate is proportional to the climb force, with a drag coefficient 10 times bigger than the one for glide [11]. This simulation was used to demonstrate the shrinkage of circular shape prismatic loops [10] and to analyze the passage of an edge dislocation over an obstacle via climb [11].
The methods presented above, that treat dislocation climb as glide motion, are insufficient to capture some of the phenomena which are related to dislocation climb. For instance, climb is a thermally activated process, and temperature-dependent climb model is required in order to reproduce the correct temperature dependency of the climb rate. In the case where the point-defects concentration in the bulk is different from the equilibrium value, e.g. due to irradiation, quenching or point-defects emission from other dislocations, dislocations may climb even without the existence of a mechanical climb force, a phenomenon which ’glide-like’ models fail to capture. Moreover, dislocation climb is different in the bulk than near surfaces, and it cannot be expressed with such models. In order to capture these climb-related phenomena, one should introduce a climb model in a DD calculation which is based on the diffusion theory of point defects.
In this paper we present a method to incorporate a vacancy diffusion-based dislocation climb model by bulk diffusion in a three-dimensional Discrete Dislocation Dynamics simulation (DDD), in which each dislocation line is represented by pure edge and screw dislocation segments on a 3D lattice, with a lattice parameter xl [12]. We focus our discussion to fcc crystals. The paper is arranged as follows. In section 2 we outline the climb model which is incorporated in the DDD, by addressing several questions: what is the climb direction, what is the climb rate and how to introduce the climb model in the DDD line discretization method we use. Then, the model is verified by comparing the DDD results with analytical analysis for several test-case scenarios of climb-related phenomena. In sections 3 and 4 we study the Bardeen-Herring climb source, as well as isolated dislocation loops shrinkage and expansion, in simple geometrical configurations and constant average vacancy concentration. We compare the dependency of the results on temperature and vacancy concentration with analytical models, which can be developed in these simple cases. In section 5 we extend the model to describe dislocation climb in bulk material and we use this model to demonstrate dislocation loops’ coarsening in annealed bulk. Finally, in section 6 we discuss in which conditions the assumptions, upon which the climb model is based, will capture the important physics in realistic calculations of a complex microstructure.
2 Climb introduction in the DDD 2.1 Climb Direction
Since dislocation climb involves jog nucleation or translation, the jog structure determines the geometrical structure of a climbing dislocation, and we first address the question of the preferable jog structure in fcc metals. However, one should pay attention that since the dislocation segments in the DDD lie on a homothetic 3D fcc lattice, a minimal segment length exists, which is of the size of the space discretization. In practice, we choose xl to be larger than the lattice parameter of the material, and the created jogs in
the DDD are actually superjogs. Hence, we discuss in this section the structure of superjogs in fcc, rather than of a single monolayer jog.
As been suggested by Hirsch [13], according to the line tension model and to dislocation dissociation rules in fcc metals, two different stable local configurations of superjogs can be guessed in fcc crystals: along a [110] dense direction or along a [112] direction, which lies in a (111) dense plane. Using atomistic
1 2 3 4 5 6 7 8 9 10 11 12 13 14 15 16 17 18 19 20 21 22 23 24 25 26 27 28 29 30 31 32 33 34 35 36 37 38 39 40 41 42 43 44 45 46 47 48 49 50 51 52 53 54 55 56 57 58 59 60
For Peer Review Only
Figure 1. (a) Atomic structure of a jogged edge dislocation in Cu. The height of the jog is 5 (111) planes. Only atoms which do not have fcc stacking are shaded: dark atoms belong to the partial dislocation cores and light shaded ones to the stacking fault ribbon (in
color online). (b) The climbing dislocation on the mesoscopic level, in correspond to the atomic results. The climbing edge segment (dashed line) creates two jogs which are pure edge segments.
calculations and different empirical potentials representative of fcc metals (Al, Au, Cu and Ni) [14], we have studied the energy of a double-jog in various fcc materials, while each superjog is either in the dense plane or in the dense direction. The stable configuration in each case is obtained by using the conjugate gradient technique. It is found that the most energetically favorable configuration, out of the four possible double-jog configurations, is the one in which both double-jogs, the obtuse and the acute, are in the dense (111) plane, i.e. along the [112] direction. This is demonstrated in figure 1a, where we present the atomic configuration which constructs the most favorable double jog configuration in Cu for a jog height of 5 monolayers.
The jog segments, that are found to be the most energetically stable, are edge dislocation segments with the same Burgers vector as the dislocation before climbing, but lying on a different (111) glide plane. In accordance, one can conclude from the atomistic simulation that in order to describe edge dislocation climb in the DDD simulation, two new edge segments should be created or resized, if one of them already exists (see figure 1b). The new segments have the same Burgers vector as the climbing segment, and glide in the same direction, but differ from it in their line vectors.
2.2 Climb rate of a dislocation line
We shall now calculate the climb rate of a short dislocation line, according to the diffusion theory of point defects. We restrict our discussion to vacancy diffusion and do not consider climb due to interstitials. In order to calculate the climb rate, one should first obtain the vacancy concentration field c(r, t) in the presence of a dislocation microstructure. In the general case, c(r, t) obeys the second Fick’s equation [15]
∂c(r, t)
∂t = ∇ · J, (1)
where the vacancy flux field J is
J = Dv(r)c(r, t)
kT ∇µv(r, t). (2)
with µv is the vacancy chemical potential, which depends on the local vacancy concentration and on
the elastic interaction energy with the dislocations in the computational cell, Dv is the vacancy diffusion
coefficient, k is Boltzmann’s constant and T is the temperature. Additionally, the solution should satisfy certain boundary conditions in the vicinity of the dislocations and at the boundaries of the system, as will be further discussed. However, solving equation (1) with its boundary conditions is complex and time consuming in a realistic three-dimensional dislocation structure. Therefore, the following assumptions are
14 15 16 17 18 19 20 21 22 23 24 25 26 27 28 29 30 31 32 33 34 35 36 37 38 39 40 41 42 43 44 45 46 47 48 49 50 51 52 53 54 55 56 57 58 59 60
For Peer Review Only
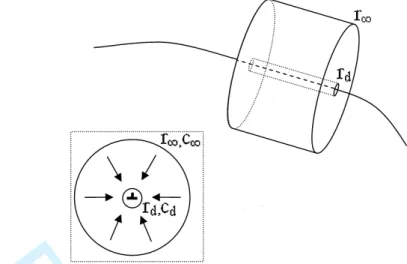
Figure 2. A control volume about a short dislocation line, in which Fick’s equation is solved. A cross-section of the cylindrical control volume, perpendicular to the dislocation line, is shown in the inset. The arrows indicate the vacancy flux direction considered.
considered in order to obtain a simple analytical expression for the climb rate:
• At each time step the vacancy flux reaches a steady-state, i.e. the time derivative in equation (1) vanishes. • The elastic interaction energy between dislocations and vacancies is neglected. Accordingly, the chemical
potential is µv(r) = kT ln µ c(r) c0 ¶ , (3)
where c0 is the equilibrium vacancy concentration in a defect-free crystal.
• The diffusion coefficient is constant in space and time, and does not depend on the stress Dv(r) = Dv.
• Each point along the dislocation line may act as a source or sink of vacancies. This is a good assumption
when the dislocation exhibits a high jog density. However, for the sake of simplicity we consider this assumption at this stage to be valid even in the case of a low jog density, where it is known not to be so accurate. In addition, pipe diffusion is ignored by assuming that vacancies which diffuse into the dislocation core are being absorbed immediately by the dislocation. We differ discussion on these assumptions to section 6.
Under these conditions equations (1) and (2) reduces into Laplace’s equation
4c(r) = 0. (4)
Let us define a hollow cylindrical control volume about a unit length of dislocation line, whose climb rate we want to calculate (figure 2). The inner radius of this control volume is of the order of the dislocation core radius rd and the outer radius r∞ is chosen to be large enough to consider the vacancy concentration on
the outer surface as the average concentration in the bulk c∞. We assume that in this control volume only the dislocation line within it influences the vacancies diffusion field. Since we neglect the elastic interaction between dislocations and vacancies, the vacancy flux has no angular dependency and is perpendicular to the dislocation line. Thus, equation (4) inside this control volume can be written as
1 r ∂ ∂r µ r∂c(r) ∂r ¶ = 0, (5)
where r is the distance from the dislocation line.
1 2 3 4 5 6 7 8 9 10 11 12 13 14 15 16 17 18 19 20 21 22 23 24 25 26 27 28 29 30 31 32 33 34 35 36 37 38 39 40 41 42 43 44 45 46 47 48 49 50 51 52 53 54 55 56 57 58 59 60
For Peer Review Only
where Fcl is the mechanical climb force, Ω is the atomic volume and b is the Burgers vector. Fcl is the component of the Peach-K¨ohler force in the climb direction, obtained in the DDD from the elastic interaction with the external stress σext and with all the other segments
P σint Fcl=nh³Xσint+ σext ´ · b i × l o · n. (8)
l and n are unit vectors in the dislocation line direction and the climb direction, respectively. n is deter-mined in a manner that b, l and n, in this order, form a right handed system
n = b × l
b , (9)
and can be rationalized as the vector in the climb direction due to vacancy absorption.
The solution of equation (5), which satisfies the boundary condition in equations (6) and (7), is
c(r) − c∞= ln(rc∞− cd ∞/rd) ln µ r r∞ ¶ . (10)
Thus, equation (2) for the vacancy flux can be written in the control volume as
J(r) = −Dv∂c(r)∂r = −r ln(rDv
∞/rd)(c∞− cd). (11)
Under the assumption that each segment is a perfect sink and no pipe diffusion, the climb rate is obtained from the number of vacancies that diffuse inwards or outwards from the dislocation core per unit length and time. Accordingly, we find from equation (11) that the climb rate is
vcl= −ηvDs b µ eFclΩbkT −c∞ c0 ¶ n, (12)
where Ds= f Dvcv is the solvent self-diffusion coefficient,
ηv = f ln(r2π
∞/rd) (13)
is a geometrical factor which is determined from the geometry of the flux field and the lattice structure and
f is a factor known as the Bardeen-Herring correlation factor for solvent diffusion [17]. In some literature, f is taken as unity, i.e. atoms make uncorrelated random walks between lattice sites. However, Bardeen
and Herring pointed out that correlation effect does exist and Montet [18] obtained a value of f =0.78145 for vacancy motion in fcc lattice at low vacancy concentrations.
14 15 16 17 18 19 20 21 22 23 24 25 26 27 28 29 30 31 32 33 34 35 36 37 38 39 40 41 42 43 44 45 46 47 48 49 50 51 52 53 54 55 56 57 58 59 60
For Peer Review Only
The vacancy formation and migration energies, Ef and Em, determine the temperature dependency of the equilibrium vacancy concentration
c0 = e−Ef/kT (14)
and of the vacancy diffusion coefficient
Dv = D0ve−Em/kT. (15)
If we relate these parameters to the self-diffusion coefficient we find that
Ds = Ds0e−Eact/kT, (16)
where Eact, which is known as the activation energy for vacancy self-diffusion, is the sum of the vacancy
formation and migration energies, and D0
s = f D0v.
Equation (12) can be interpreted as a superposition between two vacancy fluxes, one from the dislocation to the bulk (emission), which depends on the mechanical climb force, and one from the bulk to the dislocation (absorption). We emphasize that in vacancy supersaturation (c∞> c0) the dislocation climbs
even without the application of a mechanical climb force. This result is fundamentally different from the conservative glide motion, in which the dislocation velocity is proportional to the resolved shear stress.
2.3 Implementation in the edge-screw dislocation line discretization
The climb rate, calculated in equation (12), is perpendicular to the dislocation line. However, in our DDD, dislocation lines are represented by pure edge and screw segments, which propagate in certain directions and not necessarily perpendicular to the dislocation line that they represent. This is illustrated in figure 3a for a straight dislocation line, which is not in the direction of the basic edge segments. One can see that in order to propagate the dislocation line with climb rate vcl, one should consider different climb rates for the different segments that represent the dislocation line. Let κ denote the ratio between the DDD segments and the dislocation line climb rates. Then, it can be shown that κ is a function of cos θ, where θ is the angle between the line vectors of the DDD segment and the dislocation line it represents (see figure 3a).
In order to obtain θ, one should construct from the DDD segments the direction of the dislocation that the segments represent. For each segment, the real dislocation’s sense vector direction is defined as the tangent to a circle, which crosses the centers of the segment and two neighboring segments, at the point of constriction with the segment. This is demonstrated in figure 3b for a segment, whose center is marked with A. The circle in dashed line passes through point A and points P1 and P2, which are the center of
two neighboring segments. The tangent to the circle at the point A is considered as the line direction at this point. We emphasize that the neighboring segments are not necessarily the first nearest neighbors, but the ones that are at a certain distance from it. We find out that if this distance is proportional to the segment’s length, the line direction is estimated rather accurately.
2.4 Input Parameters
As a representative fcc metal we choose to work with a set of parameters for Al, given in table (1), since dislocation climb in Al is well discussed experimentally in literature (eg. [19–22]). In addition to the parameters describing the elastic interactions in the DDD, four parameters are needed to describe vacancy diffusion: the vacancy formation and migration energies, Ef and Em, the self-diffusion coefficient
pre-exponent D0
s and the atomic volume Ω. The vacancy diffusion parameters were deduced from [23] and
are given in table (1).
The value of r∞in equation (12) is taken as the average distance between dislocations. In the case of an isolated dislocation, we determine r∞ to be the length of the computational cell. However, the climb rate
is rather insensitive to the exact value of r∞, as it appears in the logarithm. For instance, the value of ηv
1 2 3 4 5 6 7 8 9 10 11 12 13 14 15 16 17 18 19 20 21 22 23 24 25 26 27 28 29 30 31 32 33 34 35 36 37 38 39 40 41 42 43 44 45 46 47 48 49 50 51 52 53 54 55 56 57 58 59 60
For Peer Review Only
Figure 3. The climb rate calculation in the DDD. (a) The segments (full line) that represent the dislocation line (dashed line) are climbing at a different rate than the dislocation line. The displacement of the segments and the dislocation line that they represent, for a timestep ∆t, is sketched with full and dashed arrows, respectively. (b) Calculation of the angle θ between the the real dislocation line
and a DDD segment. The algorithm is detailed in the text. Table 1. Material properties of Al taken in the DDD.
a Shear modulus G 27 GPa
a Poisson’s ratio ν 0.347
a Lattice parameter a
0 2.86 ˚A
a Atomic volume Ω 16.3 ˚A3
bSelf-diffusion coefficient pre-exponent D0
s 1.18×10⁻⁵m2sec−1
bVacancy formation energy Ef 0.67 eV
bVacncy migration energy Em 0.61 eV
Activation energy for self-diffusion Eact= Em+ Ef 1.28 eV
aHirth and Lothe [16]. bBased upon data in [23].
is 0.90 if considering r∞∼ 104b as in [16], whereas if one assumes r
∞to be 20 times smaller as in [24], the
corresponding ηv is 1.28.
The space discretization chosen in the DDD is xl= 10b. This value was found to be sufficient to calculate thermal fatigue of 316L stainless steel [25]. However, we emphasize that the climb distance at each timestep is accumulated, even if it is below the space discretization, and the segment climbs only if the accumulated distance exceeds xl. Accordingly, superjogs are formed due to climb in all the following calculations. The
timestep in the simulation is predetermined on a constant value between 1 msec and 1 sec, depending of the temperature and the vacancy supersaturation in the calculation.
In the following, we present several test-case scenarios, aimed to verify the capability of the climb model to yield the correct physical dependencies of the collective motion of dislocation segments. In order to do so, we simulate pure-climb related phenomena and we compare qualitatively and quantitatively the DDD results with analytical expectations and experimental results. As we are simulating pure climb phenomena, we restrict the DDD edge segments to climb and we omit glide.
3 Dislocation Climb Sources
Bardeen and Herring [17] suggested a climb dislocation source. In this mechanism, an edge dislocation, which is pinned on both sides, bows out of its glide plane by climbing. Above a certain threshold of point-defects, which are absorbed or emitted by the dislocation, the source is activated and loops are formed in the climb plane about the pinning points. The critical amount of point-defects that is needed to activate the source depends on the distance between the pinning points and can be reached by overcoming a critical climb force or a critical supersaturation of point-defects.
Observing the mechanism suggested by Bardeen and Herring experimentally is difficult since one should produce a pinned edge dislocation, which cannot glide and can only climb. In accordance, only a few works were reported to observe this mechanism. Bardeen-Herring sources were observed in Mg by Edelin and
14 15 16 17 18 19 20 21 22 23 24 25 26 27 28 29 30 31 32 33 34 35 36 37 38 39 40 41 42 43 44 45 46 47 48 49 50 51 52 53 54 55 56 57 58 59 60
For Peer Review Only
Poirier [26] and Edelin and Levy [27]. The climb sources were identified to be activated from dislocations that climb about a precipitate or which are pinned between two precipitates due to vacancy supersatu-ration. Pinned mixed dislocations can also climb due to the presence of edge components, in a similar process to the Bardeen-Herring mechanism, forming helical shape dislocations [16]. However, we shall not discuss this case in this work, as its description needs to combine dislocation glide and climb.
Several other works observed dislocation climb sources, which were denoted as Bardeen-Herring sources. In these works concentric loops were observed, but the growth mechanism was not proved to be as was suggested by Bardeen and Herring. For instance, concentric dislocation loops were observed in Al-Mg [28, 29], Al [30], Al-Cu [31, 32], Cu-Ni [33] etc. In most cases a precipitate or an impurity was reported in the middle of the concentric loops. Otherwise, it was assumed that it was leached out in the specimen thinning process. In addition, while small individual loops were found in the bulk, the neighborhood of the concentric loops was denuded from them (eg. [28, 29, 31]). In accordance, we believe that the loops were formed differently than by the mechanism described by Bardeen and Herring.
3.1 DDD simulations of a Bardeen-Herring source
In the DDD we simulate the Bardeen-Herring source by introducing into the computational cell a straight edge dislocation of length λ, pinned on its sides. A tensile stress σ is applied to the system, in a direction orthogonal to the climb plane, which stimulates a mechanical climb force on the dislocation. The temper-ature in the calculations is 400K and the vacancy concentration far away from the dislocation is assumed to remain at equilibrium (c∞= c0).
In our calculations we find that a stress threshold σth exists, below which the source is not activated.
Nevertheless, the dislocation absorbs a final amount of vacancies and climbs until it reaches an equilibrium configuration. In figure 4a we demonstrate the bow out of the dislocation line for a stress below σth. Let us
denote the climb distance evolution of the dislocation’s center by dbow(t). Then, we define the deflection of
the dislocation f (t) as f (t) = 2dbow(t)/λ. If the source is not activated, the limiting deflection f∞denotes the equilibrium deflection. f∞ is calculated in the DDD under several external stresses and it is found to
increase with the applied stress, as presented in figure 4b.
If the stress threshold is exceeded, the source is activated and dislocation loops are formed about the pinning point, as is shown in figure 5a. One can see that the loops are formed in a relatively rounded shape, but not in a symmetric way about the [121], due to the fcc symmetry. Sources lengths between 7000b and 22000b are considered, and the stress threshold to activate the source is found to increase with the distance between pinning points (figure 5b). For all source lengths, an initial discretization of 12 dislocation segments for the whole length is found to be sufficiently large in order to overcome the artifact introduced by the discretization. For comparison, Devincre and Condat suggested a value of 17 segments for the case of a Frank-Read source [34].
The Bardeen-Herring source can be activated also under vacancy supersaturation. The same initial con-figuration of a pinned dislocation source is introduced into the computational cell, but under a constant vacancy supersaturation corresponding to c∞ = 100c0 with no externally applied stress. Due to the
su-persaturation, the dislocation begins climbing even without the existence of a mechanical climb force and loops are formed about the dislocation source (figure 6).
It is interesting to note that, as opposed to the stress-activated Bardeen-Herring source, the loops that are formed under a vacancy supersaturation have a diamond shape. The reason lies in the difference in the climb rate profiles between both cases. In the stress-activated case the external mechanical stress of 5 MPa is of the same order as the internal elastic interaction between the dislocation segments, and this balance tends to smooth the loop geometry while climbing. On the other hand, under the conditions of vacancy supersaturation the osmotic force due to the supersaturation is 2–3 orders of magnitude larger than the internal mechanical force, and the climb rate is barely dependent on the dislocation line geometry. However, it is interesting to note that the profile of the internal elastic forces within the loop induces a small heterogeneity along the climb rate profile, that tends to slightly curve the dislocation line, as we will discuss in more detail in the next section for the case of prismatic loops.
1 2 3 4 5 6 7 8 9 10 11 12 13 14 15 16 17 18 19 20 21 22 23 24 25 26 27 28 29 30 31 32 33 34 35 36 37 38 39 40 41 42 43 44 45 46 47 48 49 50 51 52 53 54 55 56 57 58 59 60
For Peer Review Only
Figure 4. Dislocation bow-out for stresses below the threshold σthnecessary to activate a Bardeen-Herring source. (a) DDD result of
the equilibrium bow out into the climb plane under a stress below σth. (b) The limiting deflection as a function of the applied stress.
The results are compared with an analytical expression in equation (19), which is based upon the work by Knight and Burton [35].
Figure 5. Stress activated Bardeen-Herring source. (a) The dislocation climbs under an applied stress of 5 MPa, creating a loop about the pining points. The evolution of the source is plotted in constant time intervals. (b) The stress needed to activate the source as an inverse function of the source length, normalized by b. The results are compared the work by Knight and Burton [35] (equation (18)).
Figure 6. An activated Bardeen-Herring source under supersaturation of vacancies c∞= 100c0, after emitting several loops. 14 15 16 17 18 19 20 21 22 23 24 25 26 27 28 29 30 31 32 33 34 35 36 37 38 39 40 41 42 43 44 45 46 47 48 49 50 51 52 53 54 55 56 57 58 59 60
For Peer Review Only
3.2 Comparison with a line tension model
Several theoretical works focus on analyzing the activation of a Bardeen-Herring source. Reynolds et al. [36] obtained an equation of motion for a pinned dislocation, climbing under the application of an external stress. In this model there is no vacancy supersaturation and the climb velocity is assumed to be linear with the climb force. Additionally, the internal elastic interaction forces are approximated by a line tension force, which depends on the local curvature. The equilibrium deflection was obtained in the approximation of low external stresses. Knight and Burton [35] extended the solution for large deflections by assuming that the pinned dislocation maintains a circular structure while climbing. Under this assumption, they constructed an equation for the evolution of the dislocation deflection under an applied external stress σ,
df dt = 2σb2D s λkT 1 − 2(Gb/σλ)f + f2 1 + f2 , (17)
where G is the shear modulus. The stress threshold, needed to activate the source, can be verified from this equation, and as expected it is found to be
σth= Gb
λ . (18)
Moreover, according to equation (17), for σ < σth the limiting deflection is
f∞= Gb σλ − sµ Gb σλ ¶2 − 1 = σth σ − r³σ th σ ´2 − 1. (19)
It is recalled from the original paper [35] that under the assumption of small deflections, f2 was omitted
from equation (17), and they obtained that f∞= σ/(2σth). One can show that their result is a particular
case of equation (19) for small deflections. Additionally, we obtain from equation (19) that at the vicinity of activating the source f∞ = 1, i.e. dbow = λ/2, while the linear solution for small deflections results in
f∞= 0.5.
In figures 4 and 5 the results of the DDD are compared with the equations (18) and (19). From this comparison one can see that the DDD calculation yields comparable results with the analytical model. The stress-activated sources are also found to have a rather circular shape while bowing out, as was hypothesized by Knight and Burton to obtain an analytical solution of the problem. However, we conclude from our DDD results that the small deflections approximation, considered in [36], underestimates the deflection on the verge of activation, whereas equation (19) yields to correct result.
4 Prismatic Loops Shrinkage and Expansion
Prismatic dislocation loops are constructed of edge dislocations with a Burgers vector perpendicular to the loop surface. Consequently, these loops can glide along a ’tube’ in the direction of the Burgers vector, but they can change their size only by emitting or absorbing point-defects, i.e. by climb. Climb is stimulated by the self-stress of the loops, but it also depends on the external stress and the average concentration of vacancies in the bulk. Since this phenomenon is of pure climb, and is well discussed in literature, we use it as a second test-case to validate our model.
Shrinkage and expansion of prismatic loops were observed experimentally. Silcox and Whelan [19] re-ported that the surface of prismatic loop in Al decreases linearly with time, and that the loop’s annihilation time increases exponentially with temperature, with an activation energy which corresponds to the activa-tion energy for the self-diffusion of vacancies. Greenfield and Demos [37] presented similar conclusions for loops in neutron irradiated Cu. Kritzinger et al. [38] studied the shrinkage and expansion of dislocation loops in Al-Mg. They observed that the radii of some dislocation loops increased linearly with time, while others expanded with an increasing rate with size. The non-linear increase was rationalized by the role
1 2 3 4 5 6 7 8 9 10 11 12 13 14 15 16 17 18 19 20 21 22 23 24 25 26 27 28 29 30 31 32 33 34 35 36 37 38 39 40 41 42 43 44 45 46 47 48 49 50 51 52 53 54 55 56 57 58 59 60
For Peer Review Only
Figure 7. A diamond shape prismatic loop shrinkage at 500 K. (a) The loop shape is plotted at constant time intervals, starting from the outer contour. Initially, the climb rate is not homogenous along the contour, and the segments at the acute angle climb the fastest. (b) The climb force profile along the dislocation loop as a function of the angular position of the segments. The origin for the angle
calculation is one of the obtuse corners in the loop’s initial configuration, as emphasized about the figure on the left.
which Mg atoms play in producing vacancies, i.e. increasing the average concentration of vacancies in the bulk.
In most fcc metals prismatic loops have a polygonal shape. It is interesting to note that it was experi-mentally observed that loops in Al become circular while shrinking [19, 20]. Silcox and Whelan suggested that loops rounding takes place because of easiest athermal jog nucleation at the loop’s corners while shrinking. On the other hand, Tartour and Washburn [22] suggested that pipe diffusion may be the origin of loops rounding during shrinkage. Washburn [20] also noted that a non-homogeneous mechanical climb force along the loop contour contributes to the loop rounding. However, analytical models approximate the climb force by the line tension of a circular loop, preventing them to be used for non circular loops, thus, to predict the rounding of a polygonal loop. Contrarily, the DDD permits us to have non-circular loops since the climb force in the DDD calculation is not limited to certain geometries. However, neither pipe diffusion nor jog nucleation are described in our DDD climb model. It is thus interesting to see whether it manages to predict loop rounding while shrinking.
4.1 Climb of vacancy prismatic loops
A diamond-shape vacancy prismatic loop is introduced into the DDD computational cell by four edge dislocation segments in the [121] and the [121] direction, all having the same Burgers vectors 12[101] (see initial configuration in figure 7a). The segment directions determine the dislocation loop type, i.e. the direction of the segments of a vacancy-type loop is determined so that the normal vector n in equation (8) points inwards toward the center of the loop. No external stress is applied to the system and the temperature in the calculation is 500 K. The average vacancy concentration is chosen to be at equilibrium, i.e c∞ = c0. Under these conditions the loop shrinks and annihilates (figure 7a). This process is related
to the emission of vacancies from the loop to the bulk due to the climb components of the internal elastic forces within the loop.
The loop in the calculations rounded while shrinking, as was observed experimentally. The rounding is found to be related to a non-homogenous mechanical climb force along the loop profile, which originates from the non-circular loop shape. This is emphasized in figure 7b, where the profile of the climb forces along the loop curvature, as a function of the angular position around the loop center, is plotted at two different times. While shrinking, the climb force at the sharp corners of the diamond shape loop is maximum locally, whereas the climb force acting on the segments in the acute angles is higher than the one acting on the ones in the obtuse angles. This force profile leads to a non-homogenous climb rate along the loop contour, which equalizes only after it forms a circular shape. When circular shape is reached, it is maintained until annihilation because of the homogeneous climb force profile (see figure 7b).
Let us now study the effect of vacancy supersaturation by taking the vacancy concentration to be 100 times higher than the equilibrium value. In this case the vacancy concentration in the bulk is higher than
14 15 16 17 18 19 20 21 22 23 24 25 26 27 28 29 30 31 32 33 34 35 36 37 38 39 40 41 42 43 44 45 46 47 48 49 50 51 52 53 54 55 56 57 58 59 60
For Peer Review Only
Figure 8. A diamond shape prismatic loop expansion under supersaturation of vacancies c∞= 100c0. The loop shape is plotted at constant time intervals, starting from the inner contour.
in the vicinity of the dislocation loop, and vacancies diffuse towards the loop, which expands with time (see figure 8). As opposed to loop shrinkage, the loop retains its diamond shape while expanding, i.e. the climb rate amplitude along the loop contour is homogenous. This climb rate profile arises from the negligible dependency of the climb rate on the climb forces acting on the dislocation loop, as in the expression of the climbing velocity (equation (12)) the supersaturation contribution is preponderant.
Analyzing analytically circular loop shrinkage and expansion is difficult to perform, due to the non-homogenous climb force. Therefore, since our aim in this section is to benchmark the DDD with analytical modeling, we shall initially introduce circular loops in the rest of the calculations described in this work. Loops radii of about 900 nm are chosen. The same behavior, as we report in this work, was observed for loops of smaller radii.
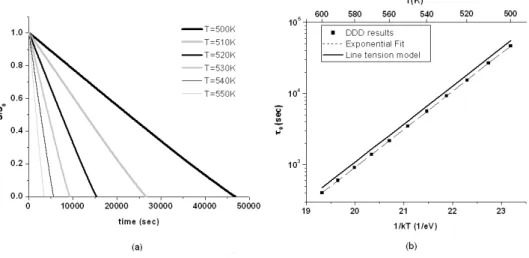
For all studied temperatures, when the average vacancy concentration in the calculations is at equilibrium (c∞= c0) and no external stress is applied, the vacancy loops shrink and annihilate. In all cases, the loops keep their circular shape until annihilation. As can be observed in figure 9a, the loops’ surface decreases linearly with time, at a rate increasing with temperature, as was identified experimentally in [19]. We emphasize that there is no observable deviation from this tendencies on the verge of annihilation, although the mechanical climb force and θ calculations are based upon only a few segments at this stage. The annihilation time decrease with temperature and obeys the Arrhenius law with an activation energy of 1.25 eV (figure 9b). When the vacancy concentration in the bulk is supersaturated, the loops’ radii increases linearly with time, with an expansion rate that obeys the Arrhenius law with an activation energy of 1.28 eV, as can be seen in figures 10.
4.2 Climb of interstitial prismatic loops
Interstitial loops are introduced in the calculation by reversing the dislocation line direction, with regard to vacancy loops. Accordingly, n points outwards from the loop. When a circular loop is introduced, it shrinks under conditions of non-supersaturated vacancy concentration. The curve in figure 11a for c∞= c0
corresponds to a linear surface shrinkage rate, which is approximately the same rate as was found in the case of vacancy loops under the same conditions. However, contrary to vacancy loops, shrinkage in this case occurs due to absorption of vacancies from the bulk, since the climb force stimulates undersaturation of vacancies in the vicinity of the loop (cd< c0). This property is obtained immediately from the climb model,
since the mechanical climb force and the vector n in this case are pointing in two opposite directions. If we increase the average concentration of vacancies in the bulk beyond the equilibrium value, the chemical potential gradient increases and the dislocation loop absorbs vacancies at a higher rate, i.e. it shrinks faster (figure 11a). We identified a transition from a constant surface shrinkage-rate at equilibrium vacancy concentration to a constant radius shrinkage-rate at high vacancy supersaturations. Additionally, the loops annihilation time was found to be an inverse function of the vacancy concentration in the bulk
1 2 3 4 5 6 7 8 9 10 11 12 13 14 15 16 17 18 19 20 21 22 23 24 25 26 27 28 29 30 31 32 33 34 35 36 37 38 39 40 41 42 43 44 45 46 47 48 49 50 51 52 53 54 55 56 57 58 59 60
For Peer Review Only
Figure 9. Vacancy loop shrinkage. (a) Variation of the loop surface, normalized by the initial surface, at various temperatures. (b) Arrhenius plot of the loop annihilation time. The exponential fit corresponds to an activation energy of 1.25 eV. The DDD results are
compared with the analytical result in equation (24) for ηloopof a torus geometry.
Figure 10. Vacancy loop expansion under vacancy supersaturation of c∞= 100c0. (a) Variation of the loop radius at various
temperatures. (b) Arrhenius plot of the loop expansion rate. The exponential fit corresponds to an activation energy of 1.28 eV. The DDD results are compared with the analytical result in equation (25) for ηloopof a torus geometry.
(see figure 11b), as will be further discussed.
4.3 Line tension model for circular loops
Let us compare the DDD results with analytical models. The question of loops shrinkage and expansion is addressed analytically by solving Fick’s equation in the environment of an isolated dislocation loop, satisfying a certain boundary condition that represents the whole dislocation loop. Several authors con-structed an equation governing the radius evolution of an isolated circular dislocation loop, using different approximations for the flux field symmetry and different boundary conditions about the dislocation loop (e.g. [39–41]). In all cases, high jog concentration and no pipe diffusion was assumed, similarly to our assumptions in the DDD. Despite the different flux geometries, all obtained the same functional form, similar to equation (12), ˙ R = ±ηloopDs b µ c∞ c0 − eFclΩbkT ¶ . (20)
The ± differs between vacancy and interstitial loops, respectively, due to the different climb direction for the same flux field between the two cases. ηloop is a geometrical factor which depends on the flux field
14 15 16 17 18 19 20 21 22 23 24 25 26 27 28 29 30 31 32 33 34 35 36 37 38 39 40 41 42 43 44 45 46 47 48 49 50 51 52 53 54 55 56 57 58 59 60
For Peer Review Only
Figure 11. Interstitial loop shrinkage at T=500 K. (a) Variation of the loop radius for various vacancy supersaturations. (b) The inverse of the annihilation time as a function of the vacancy supersaturation. The DDD results are compared with the analytical result
in equation (27) for ηloopof a torus geometry.
geometry assumed in the solution. For instance, Burton and Speight [39] obtained ηloop = 2 by assuming
the loop to be a perfect punctual source/sink and the vacancy flux field to have a spherical symmetry about it. Seidman and Balluffi [40] assumed that the flux field about the loop satisfies a boundary condition of a torus, and one can conclude from their result that for large loops radii, with respect to the radii of the circular cross-section of the torus r0, ηloop =√6π/ ln(8R/r0). We pay notice that in this solution ηloop is not constant but varies weakly with the loop radius. For the sake of simplicity, we shall assume ηloop to be constant.
In order to solve analytically equation (20) we shall assume that the mechanical climb force satisfies the line tension approximation for a circular loop Fcl = ±Gb2/R. The different signs between vacancy (+) and
interstitial (-) loops determine the climb force direction in the coordinate system of the dislocation loop, i.e the direction of n as being used in equation (8). In the limit of small climb forces |Fcl| ¿ bkT /Ω we
obtain that ˙ R = ±ηloopDbs µ c∞ c0 − 1 ∓ RT R ¶ = ηloopDbs · −RT R ± µ c∞ c0 − 1 ¶¸ , (21)
where RT is a typical temperature-dependent length, defined as RT = GbΩ/kT . Typical values for RT in
Al varies between 217 ˚A at T =420K and 152 ˚A at T =500K. These values are much smaller than the initial radii of loops considered in the DDD, which is in analogy to the demand of small climb forces. We note that linearization of the exponent in equation (20) inserts inaccuracies otherwise.
Let us first discuss the behavior of loops under equilibrium concentration of vacancies c∞= c0. Regardless
of the dislocation loop type, one can conclude from equation (21) that loops always shrink with a rate proportional to the inverse of its radius. Thus, by multiplying equation (21) by 2πR, one finds that the loop’s surface S decreases at a constant rate
˙ S = −2πηloop Ds b RT. (22) 1 2 3 4 5 6 7 8 9 10 11 12 13 14 15 16 17 18 19 20 21 22 23 24 25 26 27 28 29 30 31 32 33 34 35 36 37 38 39 40 41 42 43 44 45 46 47 48 49 50 51 52 53 54 55 56 57 58 59 60
For Peer Review Only
Since Ds depends exponentially on temperature, the contribution of RT to the temperature dependency
of τ0, in the temperature range which we examined in our DDD calculations, is negligible. Consequently, we can fairly claim that τ0 obeys the Arrhenius law with the same activation energy as for self-diffusion Eact, in correspondence with our observations in the DDD simulations. In figure 9b we plot the analytical
model results, taking ηloop of a torus geometry, and one can see that the DDD results are in quantitative
agreement with it. The difference between the two plots, of the DDD and of the line tension model, arises from the geometry of the flux field we hypothesized in our model, i.e. the value of ηv. Nevertheless, the
annihilation times obtained in both methods are of the same order of magnitudes.
The tendencies identified in our DDD simulations were also observed experimentally. Silcox and Whelan [41] found that vacancy loops in Al shrink with an activation energy in the range of 1.2 to 1.3 eV, of the order of the activation energy for self-diffusion. They reported that loops of about 330 ˚A shrink after
138 sec at T=470K. These loops are smaller than the ones we simulated, and a quantitative comparison of the DDD results with the experimental values cannot be done directly. However, an order of magnitude comparison can be performed. The initial loops surface in our simulation is about 3 orders of magnitude bigger than in experiments. Thus, according to equation (24) one would expect the annihilation time of these loops to be 3 orders of magnitude bigger than the one reported experimentally for the small loops. This order of magnitude is what one obtains if extrapolating the DDD results to T=470K. Consequently, we conclude that the climb rate in the DDD climb model is in agreement with experimental observations as well.
When vacancy supersaturation is assumed, one should differentiate between the case of a vacancy loop and an interstitial loop. For a vacancy loop, if the concentration of vacancies is high enough to satisfy
c∞/c0À 1 + RT/R, the contribution of the mechanical climb force can be neglected, and we find that
˙
R = ηloopDbscc∞
0 . (25)
Hence, under constant vacancy supersaturation the radius is expected to grow in a constant rate that obeys the Arrhenius law, as observed in our DDD simulations and reported in figures 10. The activation energy for expansion is expected to correspond to the self-diffusion activation energy, as we obtained in the DDD simulations. The expansion rate also agrees with the DDD results, as can be concluded from the comparison in figure 10b.
Under the same conditions (c∞/c0 À 1 + RT/R) for an interstitial loop we obtain
˙ R = −ηloopDs b c∞ c0 . (26)
One can thus distinguish between two typical regimes, a low and a high vacancy concentration regimes. According to equations (22), at low vacancy concentrations the surface shrinks in a constant rate, whereas according to equation (26) at high concentrations the radius decreases at a constant rate. The transition between the two regimes is observed in the DDD simulations (figure 11). In addition, if one neglects the deviation from linearity in the vicinity of annihilation, where the term RT/R is no longer negligible, one
can obtain from equation (26) the dependency of the annihilation time in supersaturation conditions τss
14 15 16 17 18 19 20 21 22 23 24 25 26 27 28 29 30 31 32 33 34 35 36 37 38 39 40 41 42 43 44 45 46 47 48 49 50 51 52 53 54 55 56 57 58 59 60
For Peer Review Only
on the vacancy concentrations
τss−1 = ηloop
Ds bR0
c∞
c0 . (27)
The linear relation between the annihilation rate and the vacancy concentration was obtained in our DDD, and is emphasized by the dashed line in figure 11b. The slope in figure 11b corresponds to 2.4·10−3 sec−1, where the analytical model yields a value of 4.4·10−3 sec−1.
To summarize the results for dislocation loop, the DDD manages to reproduce experimental observations and leads to results in agreement with analytical models based upon line tension approximation. These analytical models take advantage of the simple geometry of the problem to use exact solutions for the diffusion problem. This good agreement therefore shows that our approximated treatment of diffusion and of the dislocation discretization in our DDD simulations do not lead to artifacts. However, in reality the conditions of isolated dislocations may be too simplified and in the next section we extend the model, to include more realistic conditions of dislocation climb in the bulk.
5 Expansion of vacancy prismatic loops in the bulk
In the previous sections we assumed that the average concentration of vacancies is predetermined at a constant value, which does not evolve along the calculation. To meet this condition, one should have different reservoirs of vacancies to keep the average vacancy concentration in the bulk at a constant value. Vacancies sinks and sources can be surfaces, grain-boundaries and other dislocations. Such an assumption may be valid, for instance, in thin films, where the free-surfaces are close enough to the climbing dislocations to relieve supersaturation in the concentration fields. Another example is bulk material under irradiation, where a steady-state supersaturation of vacancies can be produced [42]. Nevertheless, in this case the effect of interstitial atoms on dislocation climb is no longer negligible, in contrast to the assumptions of our climb model.
On the other hand, in the case of annealed bulk material, where the climbing dislocations are far from surfaces and grain-boundaries, the main sources of vacancies are the dislocation themselves. Consequently, the concentration of vacancies varies according to the number of vacancies that are absorbed or emitted by climbing dislocations. In our calculations, where surfaces and grain-boundaries are not considered, we shall assume the extreme case, in which dislocations are the only vacancy sources in our system, i.e. the total number of the free vacancies and the vacancies that are condensed in loops is a conserved quantity. In our model, this condition is met by varying the average concentration of free vacancies in the bulk with time c∞(t), according to simple balance rules.
Let us assume that at each timestep, the vacancies that are absorbed or emitted diffuse in the bulk and reach steady state. Since the number of vacancies that are emitted or absorbed by dislocations is proportional to the area swept by the dislocation segments during their climb, we obtain that
˙c∞(t) + ΩVb cell
˙
Scl(t) = 0, (28)
where Vcell is the computational cell volume and ˙Scl∆t is the surface swept by the climbing segments at timestep ∆t . ˙Scl is considered positive if the segment climbs in the direction of the vector n, and negative
otherwise.
5.1 Single dislocation loop in the bulk
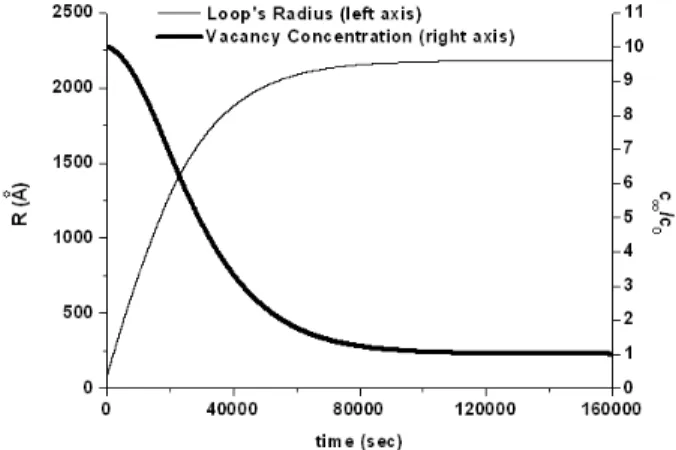
Let us examine the size evolution of a vacancy loop in the bulk, with an initial vacancy supersaturation corresponding to c∞(0) = 10c0, at a temperature of 420K. Initially, the vacancy concentration at the vicinity of the loop is smaller than c∞(0) and the loop begin to expand, as is demonstrated in figure 12.
However, the dislocation absorbs vacancies while expanding and the concentration of vacancies in the bulk
1 2 3 4 5 6 7 8 9 10 11 12 13 14 15 16 17 18 19 20 21 22 23 24 25 26 27 28 29 30 31 32 33 34 35 36 37 38 39 40 41 42 43 44 45 46 47 48 49 50 51 52 53 54 55 56 57 58 59 60
For Peer Review Only
Figure 12. Vacancy loop growth at T=420K with an initial vacancy supersaturation of c∞(0) = 10c0. (a) The history of the loop’s
radius. (b) The history of the vacancy concentration in the bulk.
decreases. Consequently, the vacancy concentration gradient between the bulk and the dislocation loop decreases while growing. Finally, the vacancy concentration reaches an equilibrium value and the loop’s expansion halts.
5.2 Population of an ensemble of loops in the bulk
Silcox and Whelan [19] reported their observation of the evolution of the dislocation loops distribution in annealed bulk Al. They observed that the number of loops decreased after annealing quenched specimens, while the size of the ones that did not annihilate increased. The coarsening of the loops was rationalized by the interaction between the flux fields of the different loops, concluding that larger loops grow at the expense of smaller ones. The conditions in this case are similar to the ones considered in the DDD, and this experimental observation is used as a test-case to validate whether the model yields correct behavior. We introduce eight rounded vacancy dislocation loops into the computational cell. All the loops share the same Burgers vector but have two possible initial sizes, four loops of each size. Their centers are located at the corners of an imaginary cube of size Ld, which is centered in the middle of the computational cell (see figure 13). Ldis taken as half the size of the computational cell. We assume that the distance between
the loops is large enough so that the number of vacancies in the middle of two adjacent loops is the average concentration of vacancies, i.e. r∞ = Ld/2. The temperature is constant 480K and initially there is no
vacancy supersaturation c∞(0) = c0.
At the beginning of the calculation, all loops shrink due to the mechanical climb force, which induces a vacancy concentration in the vicinity of the dislocation loops which is higher than c∞(0), for both large and
small loops (marked as stage I in figure 14). However, dislocation shrinkage involves emission of vacancies into the bulk, and the concentration of vacancies in the bulk increases until it reaches the concentration of vacancies in the vicinity of the large loops. In result, shrinkage of large loops is no longer favorable in these conditions. Nevertheless, the small loops keep on shrinking, since the vacancy concentration at their vicinity is still higher than in the bulk due to the higher mechanical climb force acting on them. The vacancies emitted by the small loops beyond this time are absorbed by the larger loops, that begin expanding on the expense of the shrinking small loops, keeping the average concentration in the bulk approximately constant (stage II in figure 14). Only after total annihilation of the small loops (stage III in figure 14) the large loops equilibrate with the bulk by absorbing more vacancies, decreasing the average concentration in the bulk, until saturating on a final size. This demonstrates the ability of our model to reproduce loop coarsening.
6 The Role of Jogs and Pipe-Diffusion
In this paper it is assumed that vacancies can be annihilated on each site along the dislocation, i.e. each segment acts as a perfect sink/source of vacancies. However, absorption or emission of a vacancies from a
14 15 16 17 18 19 20 21 22 23 24 25 26 27 28 29 30 31 32 33 34 35 36 37 38 39 40 41 42 43 44 45 46 47 48 49 50 51 52 53 54 55 56 57 58 59 60
For Peer Review Only
Figure 13. The geometrical configuration on the vacancy loops in the calculation. Ldis the distance between the centers of two
adjacent loops
Figure 14. Evolution of the population of a vacancy loops array. (a) The radii of the two different sizes of loops. (b) The history of the average vacancy concentration in the bulk. The three stages, marked as I-III, are explained in the text.
1 2 3 4 5 6 7 8 9 10 11 12 13 14 15 16 17 18 19 20 21 22 23 24 25 26 27 28 29 30 31 32 33 34 35 36 37 38 39 40 41 42 43 44 45 46 47 48 49 50 51 52 53 54 55 56 57 58 59 60
For Peer Review Only
the same form as equation (12), with a factor ηv that is no longer constant but depends on the jogs
concentration. Consequently, the activation energy for climb via jogs migration at high jogs concentrations should be similar to our results. At low jog densities the effect of pipe-diffusion is taken into account, and the climb rate they obtained is of the form
vcl= −ηvDs b µ eFclΩbkT −c∞ c0 ¶ e∆EpkT n, (29)
where ∆Ep is the difference in the activation energies for diffusion between the bulk and along the
dis-location core. Two extreme cases are discussed: when the disdis-location length L is much larger or much smaller than the average distance between jogs X. In the former case ηv is found to be linear with 1/X, whereas in the latter case it is found to proportional to L/X2. We emphasize that for both cases, even
though pipe-diffusion is taken into account, bulk diffusion is still the controlling process of climb, whereas the pipe-diffusion just spreads the area around the jogs from which the vacancies can diffuse inwards or outwards from the dislocation core.
According to the analysis above, if the influence of pipe diffusion is omitted, the climb rate of dislocation segments should have the same activation energy as the self-diffusion of vacancies, but with a varying geometrical factor ηv, depending on to the local jog density. Thus, in order to include the influence of jogs in the low jog density regime, the jog concentration should be calculated locally along the dislocation line in the DDD simulation. However, we emphasize that jogs formation in the DDD is an athermal process, and in order to fully capture their effect on the climb rate one should include jogs creation through their formation energy. Consequently, under the assumption that each segment is a perfect sink/source for vacancies, the DDD is expected to capture the correct order of activation energy for climb in cases where the dominant climb process is by jog migration rather than jog formation, namely, at high temperatures and at low climb rates. At low temperatures or high supersaturations this assumption may lead to underestimate the activation energy for climb. Furthermore, the climb model may overestimate the jog concentration on climbing straight segments, as in figure 8, where the non-homogenous climb force along the dislocation lines curves them, while in effect we expect them to remain relatively straight to reduce the energy related to the jogs formation. Nevertheless, the conditions for shrinkage and expansion of loops in figures 9,10 and 11 and the dynamic process of loops coarsening in figure 14 are determined from the balance between the mechanical and the osmotic climb forces, and we believe that considering the jog density in the climb model would not qualitatively reflect on these results.
The contribution of pipe diffusion in equation (29) is obtained under the assumption that the typical distance for pipe diffusion is smaller than the average distance between jogs. In result, pipe diffusion role in this equation is to spread the vacancies about the jogs before diffusing into the bulk. However, in some cases, such as at low temperatures, the typical distance for pipe-diffusion is larger than the distance between jogs and vacancies diffuse mainly along the dislocation cores. Thus, it was suggested theoretically [44] and experimentally [45, 46] that pipe-diffusion may be the rate-controlling process in creep behavior at low temperatures. Goods and Nix [45] found that the activation energy for creep rupture in Silver is 2.06 eV above 300 K, in correspondence to the activation energy for bulk diffusion, and 1.06 eV below that temperature. They related the activation energy at low temperatures to the activation energy for diffusion
14 15 16 17 18 19 20 21 22 23 24 25 26 27 28 29 30 31 32 33 34 35 36 37 38 39 40 41 42 43 44 45 46 47 48 49 50 51 52 53 54 55 56 57 58 59 60
For Peer Review Only
along the dislocation core (0.84 eV [47]). Kassner [46] found a lower activation energy, of about 0.5 eV, at even lower temperatures. While he could not rule out the contribution of glide motion and cross-slip to this result, he suggested that supersaturation exists because of the large strain, and that this value correspond to the vacancy migration energy along the dislocation core. It also been suggested that climb controlled by pipe-diffusion could lead to the coagulation of dislocation loops [48], and to the annihilation of dislocation dipoles [49]. Therefore, to reproduce phenomena which occur at low velocities, it will be necessary to consider also dislocation climb by pipe-diffusion. A possible modeling can be done following the approach proposed by Turunen [50], which involves calculation of the the climb force derivatives along dislocation line.
7 Conclusions and Prospectives
In this paper we propose a climb model for DDD simulations, which is based upon the diffusion theory of vacancies. In this model, the climb-rate of the DDD segments is obtained by solving Fick’s equation locally about each segment, assuming it to act as a perfect sink, by considering only climb due to bulk diffusion.
The treatment of climb in the DDD is compared quantitatively for simple cases, as the activation of a Bardeen-Herring source under stress and under vacancy supersaturation, as well as the shrinkage and expansion of circular prismatic loops, where an analytical solution for the diffusion equation in the bulk is well established. Prismatic loops, regardless of their type, are shown to shrink with a constant surface shrinkage rate, under equilibrium conditions of vacancy concentration. Under vacancy supersaturation, vacancy loops radii are found to expand with a constant rate, while interstitial loop are shrinking, with a transition from a constant-surface shrinking rate to a constant-radius shrinking rate at high supersatu-rations. The activation energies and rates of these different behaviors are obtained analytically and yield comparable results with the DDD.
While the model presented in this work does not include the interaction of vacancies with jogs and pipe diffusion, it is shown to capture important phenomena as loop coarsening in annealed bulk, and as such should be considered as a first step in obtaining a reliable rigorous treatment of dislocation climb in DDD simulations. Nevertheless, the climb model is mostly suitable for cases of high temperatures (above half the melting point) and to relatively low climb velocities, where the rate-controlling process for creep is bulk diffusion and the concentration of jogs is relatively high. In these conditions the DDD simulations yield good dependencies on physical parameters, such as temperature, stress and vacancy concentration.
Extension of the dislocation climb model described in the present article, to treat the interaction dislocation-vacancy inside the dislocation core as was discussed in section 6, will be considered in the future in order to study creep in a complex dislocation microstructure at a wide range of temperature and stress conditions. This additional step would enhance our results for the climb of relatively straight dislocations and high climb rates. In addition, while in this work glide is omitted in order to isolate only pure-climb related phenomena, one should incorporate this model with the glide and cross-slip models in the DDD to simulate creep.
8 Acknowledgments
The authors gratefully thank Dr. G. Martin, Prof. J.P. Poirier, Prof. J. Friedel, Prof. J. Grilh´e, Dr. D. Caillard and Dr. A. Barbu for fruitful discussions and suggestions.
References
[1] B. Devincre and L. P. Kubin, Mater. Sci. Eng. A 8 234 (1997).
[2] H. M. Zbib, T. D. de la Rubia, M. Rhee and J. P. Hirth, J. Nucl. Mater. 276 154 (2000). [3] M. C. Fivel, T. J. Gosling and G. R. Canova, Modelling Simul. Mater. Sci. Eng. 4 581 (1996). [4] C. D´epr´es, C. F. Robertson and M. C. Fivel, Phil. Mag. 84 2257 (2004).
[5] E. V. der Giessen, V. S. Deshpande, H. H. M. Cleveringa and A. Needleman, J. Mech. Phys. Solids 49 2133 (2001). 1 2 3 4 5 6 7 8 9 10 11 12 13 14 15 16 17 18 19 20 21 22 23 24 25 26 27 28 29 30 31 32 33 34 35 36 37 38 39 40 41 42 43 44 45 46 47 48 49 50 51 52 53 54 55 56 57 58 59 60
For Peer Review Only
[20] J. Washburn, in Proc. Int. Conf. on Radiation-Induced Voids in Metals, edited by J. Corbett and L. Ianniello (Springfield, Virginia, 1971), pp. 647–662.
[21] P. S. Dobson, P. J. Goodhew and R. E. Smallman, Phil. Mag. 16 9 (1967). [22] J.-P. Tartour and J. Washburn, Phil. Mag. 18 1257 (1968).
[23] O. Madelung (Editor), Landolt-B¨ornstein: Numerical Data and Functional Relationship in Science and Technology, volume 25 of III (Springer-Verleg, Berlin, 1990).
[24] D. Caillard and J. L. Martin, in Thermally Activated Mechanisms in Crystal Plasticity, edited by R. W. Cahn (Pergamon, Amster-dam, 2003).
[25] C. F. Robertson, M. C. Fivel and A. Fissolo, Mater. Sci. Eng. A 315 47 (2001). [26] G. Edelin and J. P. Poirier, Phil. Mag. 28 1203 (1973).
[27] G. Edelin and V. Levy, Phil. Mag. 27 487 (1973).
[28] K. H. Westmacott, R. S. Barnes and R. E. Smallman, Phil. Mag. 7 1585 (1962). [29] J. D. Embury and R. B. Nicholson, Acta Metall. 11 347 (1963).
[30] J. W. Edington and D. R. West, J. Appl. Phys. 37 3904 (1966). [31] J. D. Boyd and J. W. Edington, Phil. Mag. 23 633 (1971). [32] A. Sato, Y. Sugisaki and T. Mori, Phil. Mag. A 51 133 (1985). [33] Y. G. Zhang and I. P. Jones, Radiat. Eff. Defects Solids 108 45 (1989). [34] B. Devincre and M. Condat, Acta Metall. Mater. 40 2629 (1992). [35] D. T. Knight and B. Burton, Phil. Mag. A 59 1027 (1989).
[36] G. L. Reynolds, W. B. Beer´e and B. Burton, Met. Sci. 11 213 (1977). [37] I. G. Greenfield and J. R. Demos, Phys. Rev. 134 A1051 (1964).
[38] S. Kritzinger, P. S. Dobson and R. E. Smallman, Phil. Mag. 16 217 (1967). [39] B. Burton and M. V. Speight, Phil. Mag. A 53 385 (1986).
[40] D. N. Seidman and R. W. Balluffi, Phil. Mag. 13 649 (1966). [41] M. J. Whelan, Phil. Mag. 14 195 (1966).
[42] A. Barbu and G. Martin, in Solid State Phenom., edited by A. Dunlop (Trans Tech, Switzerland, 1993), volume 31 & 32, pp. 179–228. [43] R. W. Balluffi and A. V. Granato, in Dislocations in Solids, edited by F. R. N. Nabarro (North-Holland, 1979), volume 4, pp. 1–134. [44] F. R. N. Nabarro, Phil. Mag. 16 231 (1967).
[45] S. H. Goods and W. D. Nix, Acta Metall. 26 753 (1978). [46] M. E. Kassner, Metall. Trans. A 20 2001 (1989). [47] D. Turnbull and R. Hoffman, Acta Metall. 2 419 (1954). [48] C. A. Johnson, Phil. Mag. 5 1255 (1960).
[49] X. Tang, K. P. D. Langel¨of and A. H. Heuer, J. Am. Ceram. Soc. 86 560 (2003). [50] M. J. Turunen, Acta Metall. 24 463 (1976).
14 15 16 17 18 19 20 21 22 23 24 25 26 27 28 29 30 31 32 33 34 35 36 37 38 39 40 41 42 43 44 45 46 47 48 49 50 51 52 53 54 55 56 57 58 59 60