HAL Id: hal-01460757
https://hal-amu.archives-ouvertes.fr/hal-01460757
Submitted on 7 Feb 2017
HAL is a multi-disciplinary open access
archive for the deposit and dissemination of
sci-entific research documents, whether they are
pub-lished or not. The documents may come from
teaching and research institutions in France or
abroad, or from public or private research centers.
L’archive ouverte pluridisciplinaire HAL, est
destinée au dépôt et à la diffusion de documents
scientifiques de niveau recherche, publiés ou non,
émanant des établissements d’enseignement et de
recherche français ou étrangers, des laboratoires
publics ou privés.
Probing the functional impact of sub- retinal prosthesis
Sébastien Roux, Frédéric Matonti, Florent Dupont, Louis Hoffart, Sylvain
Takerkart, Serge Picaud, Pascale Pham, Frédéric Chavane
To cite this version:
Sébastien Roux, Frédéric Matonti, Florent Dupont, Louis Hoffart, Sylvain Takerkart, et al.. Probing
the functional impact of sub- retinal prosthesis. eLife, eLife Sciences Publication, 2016, pp.e12687.
�10.7554/eLife.12687�. �hal-01460757�
*For correspondence: sebastien. [email protected] (SR); frederic. [email protected] (FC)
Competing interest:See page 23
Funding:See page 23
Received: 02 November 2015 Accepted: 07 July 2016 Published: 23 August 2016
Reviewing editor: Doris Y Tsao, California Institute of
Technology, United States
Copyright Roux et al. This article is distributed under the terms of theCreative Commons Attribution License,which permits unrestricted use and redistribution provided that the original author and source are credited.
Probing the functional impact of
sub-retinal prosthesis
Se´bastien Roux
1*, Fre´de´ric Matonti
1,2, Florent Dupont
3,4, Louis Hoffart
1,2,
Sylvain Takerkart
1, Serge Picaud
5, Pascale Pham
3,4, Fre´de´ric Chavane
1*
1
Institut de Neurosciences de la Timone, CNRS, Aix-Marseille Universite´, Marseille,
France;
2Ophthalmology Department, Aix Marseille Universite´, Hoˆpital Nord,Hoˆpital
de la Timone, Marseille, France;
3CEA-LETI, Grenoble, France;
4Universite´ Grenoble
Alpes, Grenoble, France;
5Inserm, UMRS-986, Institut de la vision, Paris, France
Abstract
Retinal prostheses are promising tools for recovering visual functions in blind patients but, unfortunately, with still poor gains in visual acuity. Improving their resolution is thus a key challenge that warrants understanding its origin through appropriate animal models. Here, we provide a systematic comparison between visual and prosthetic activations of the rat primary visual cortex (V1). We established a precise V1 mapping as a functional benchmark to demonstrate that sub-retinal implants activate V1 at the appropriate position, scalable to a wide range of visual luminance, but with an aspect-ratio and an extent much larger than expected. Such distorted activation profile can be accounted for by the existence of two sources of diffusion, passive diffusion and activation of ganglion cells’ axons en passant. Reverse-engineered electrical pulses based on impedance spectroscopy is the only solution we tested that decreases the extent and aspect-ratio, providing a promising solution for clinical applications.DOI: 10.7554/eLife.12687.001
Introduction
Blindness affects 45 million people around the world with an increase of 1 to 2 million people each
year (Resnikoff et al., 2004). The two main retinal pathologies are age-related macular
degenera-tion (AMD, Ambati and Fowler, 2012; Finger et al., 2011) and Retinitis Pigmentosa (RP,
Bocquet et al., 2013). Although the genetic alterations and the mechanisms subtending
photore-ceptor death are well described, and therapeutic strategies are under clinical trials (Ferrari et al.,
2013; Talcott et al., 2011), retinal degeneration inexorably leads to blindness (Tsujikawa et al.,
2008). In this perspective, retinal prostheses provide a promising solution that remains to date a
unique alternative for the patients. Restoring some visual perception using implants has been
already achieved (Humayun et al., 2012; Shepherd et al., 2013; Zrenner et al., 2010) but still
offers insufficient gains in visual acuity (Humayun et al., 2012; Zrenner et al., 2010);
(Nanduri et al., 2012;Rizzo, 2003). Despite having fundamentally different designs and operating modes, the two main models of prostheses proposed to the patients with RP (Argus II epiretinal prosthesis and the subretinal alpha IMS microphotodiode array) restore some visual function
although with a spatial resolution (Ahuja and Behrend, 2013;Humayun et al., 2012); (Stingl et al.,
2013) that does not allow for the recognition of faces or autonomous locomotion. Improving the
performances of such implants is thus a key strategic issue for further developments.
This problem is actually a general issue shared by other sensory prosthesis, such as the cochlear
implants (Kral et al., 1998). This latter field, well in advance compared to retinal implants, has
already demonstrated the importance of developing animal models for better understanding of the
underlying physiological processes (Fallon and Shepherd, 2009; Miller et al., 2000). To improve
models that allow probing precisely and quantitatively the functional impact of prosthetic activation. Pioneering animal studies have proposed to use cortical recordings to explore the efficiency of
vari-ous patterns of retinal electrical stimulation (Chowdhury et al., 2008), including current steering
methods (Jepson et al., 2014a;Matteucci et al., 2013) or the effect of the return electrode
config-uration (Cicione et al., 2012;Matteucci et al., 2013;Wong et al., 2009) and studied the temporal
aspect of prosthetic vision (Elfar et al., 2009; Fransen et al., 2014; Jepson et al., 2014a,
2013,2014b;Nadig, 1999;Schanze et al., 2003;Sekirnjak et al., 2008;Wilms et al., 2003). How-ever, most were not designed to characterize and calibrate the functional activation of the visual
sys-tem (Chowdhury et al., 2008;Eger et al., 2005;Mandel et al., 2013;Nadig, 1999;Schanze et al.,
2003;Walter et al., 2005;Wong et al., 2009) nor probed the functional impact of implants through
systematic comparison with visual activation (Chowdhury et al., 2008; Cicione et al., 2012;
Eger et al., 2005; Fransen et al., 2014; Mandel et al., 2013; Matteucci et al., 2013;
Schanze et al., 2003;Wong et al., 2009). Hence, none of these studies allowed to fully address the question of understanding and controlling the functional impact of retinal prosthesis.
To address this issue, we developed an acute animal model to quantitatively assess the functional impact of retinal prostheses by comparing the downstream activation of the visual system in response to visual versus artificial stimuli, using intrinsic optical imaging of the primary visual cortex (V1). To infer the hypothetic visual counterparts induced by electrical stimulation, we first established a quantitative mapping of the cartographic organization of the rat visual system. So far only Gias
and colleagues (Gias et al., 2004) have provided a retinotopic description of the rat visual cortex
using optical imaging. Here, we generalized this mapping to visual parameters that are the most important for prosthetic vision (position, size and intensity). Using this cartographic benchmark, we demonstrate that prosthetic stimulation generates a functional activation that occurs at the expected retinotopic location and amplitude. However, the aspect ratio and the extent of the activation are significantly larger than expected. This can be explained through a simple model with two sources of diffusion: an electrical passive diffusion and the activation of axons en passant from ganglion cells.
eLife digest
One of the most common causes of blindness is a disorder called retinitispigmentosa. In a healthy eye, the surface at the back of the eye – called the retina – contains cells called photoreceptors that detect light and convert it into electrical signals for the brain to process. In people with retinitis pigmentosa, these photoreceptor cells die off gradually, which leads to loss of vision.
The only treatment available for retinitis pigmentosa is to have an artificial retina implanted into the eye. The artificial retina consists of an array of tiny electrodes, which take over from the
damaged photoreceptors and generate electrical signals. The person with the implant perceives these electrical signals as bright flashes called “phosphenes”. However, the phosphenes are too large and imprecise to provide the person with vision that is good enough for tasks such as walking unaided or reading.
To find out why artificial retinas produce such poor resolution, Roux et al. compared how a rat’s brain responds to either natural visual stimuli or activation of implanted an array of micro-electrodes. Both the micro-electrodes and the natural stimuli activated the same areas of the brain. However, the micro-electrodes produced larger and more elongated patterns of activation. This is because the electrical currents generated by the micro-electrodes diffused throughout the retinal tissue and activated other neurons besides those intended. To overcome this problem, Roux et al. tested different ways of stimulating the micro-electrodes in order to identify those that induce the desired patterns of brain activity. This approach – known as reverse engineering – did indeed improve the performance of the micro-electrode array.
The next step is to extend these findings, which were obtained in healthy rats, to non-human primates or animal models of retinitis pigmentosa to better understand the condition in humans. In addition, combining the current approach with other existing techniques should further improve the vision that can be achieved with artificial retinas.
To control the extent of cortical activation, we tested various patterns of electrical stimulation and showed that only reverse engineering of the electrical pulses to inject the desired electrical
stimula-tion (Dupont et al., 2013;Pham et al., 2013) allowed focalizing the activation. This result provides
a promising perspective that could be easily implemented for improving the visual acuity of already implanted patients.
Results
In order to investigate the functional impact of acutely implanted retinal prostheses, we have
recorded the population activation of V1 of anesthetized rats using optical imaging (Eckhorn et al.,
2006;Gias et al., 2004;Grinvald et al., 1999;Walter et al., 2005) (Figure 1A–B) and implanted
micro-electrode array prosthesis (MEA, see Materials and methods) sub-retinally (Figure 1C). With
such preparation, we quantified for each rat the visually as well as the artificially-evoked cortical pop-ulation activations. Our results thus are derived from a systematic pairwise comparison of the
artifi-cial activation versus its counterpart visual activation (Figure 1A) in response to relevant key
parameters (position, size, shape and intensity) across a large number of animals (N = 35). Hence,
A
im pla nt optical imaging optical imagingvisual
stimulation
electrical
stimulation
retina
V1
B
C
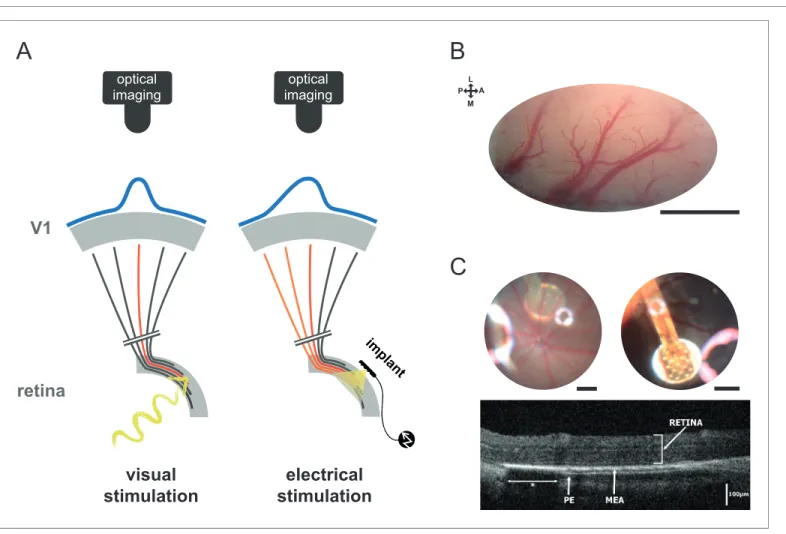
L M A PFigure 1. Experiment design. (A) Schematic view of the experimental setup with the camera and the visual pathway from the retina to V1 activated with normal visual stimuli (left) or with sub-retinal electrical stimulation using a MEA (right). Retinal ganglion cells’ (RGCs) axons leaving the retina and projecting to V1 via the LGN are schematized (black when non activated; in red for direct activation; in orange for activation of en passant fibers that could occur in the electrical stimulation case). Blue curves on the top of V1 schematize the expected spatial profile of cortical activation (symmetric for visual stimulation and asymmetric for electrical stimulation if axons en passant are activated). (B) Clear optical access through thinned bone over V1; scale bar: 2 mm. L: lateral; M: medial; A: anterior; P: posterior. (C) Image of the eye fundus with the 9 electrodes (top left) and the 17 electrodes (top right) MEA; scale bars: 500 microns. Note that the use of an additional magnifying lens induced optical artifacts (halos of light). Retinal OCT B-scan (bottom) of an implanted animal showing the MEA and intact retina (PE: pigmetary epithelium; *: shadowing of the external reference surrounding the 17 electrodes MEA).
responses to visual stimuli were used to provide a functional benchmark to which prosthetic activa-tions were systematically compared.
Position
First, we investigated whether retinal prosthesis stimulation generates activation at the expected ret-inotopic position. To answer this question, we mapped the cortical retret-inotopic organization of the
rat visual cortex (Gias et al., 2004) by flashing white squares in a 5x4 grid of 20
˚
side (Figure 2A).For each animal, we computed polar maps for azimuth and elevation (Figure 2B,Ffor 2 different
ani-mals). Animals were also implanted sub-retinally with a MEA and its retinal position was identified
using fundus imaging (Figure 2C,G), reported in the visual (A,E) and cortical domains (B,D,F,H),
respectively. In the first animal (Figure 2top row), we stimulated the whole MEA (wMEA), the size of
which (1 mm) was in the range of the size of the stimuli used for visual retinotopic mapping (20
˚
)A
B
C
E
F
H
-6 4 -6 2*
*
20° Z -sco re Z -sco re U D N TG
El El max min Az Az max minD
L M A P L M A U D N T -2 -0.5 ×10⁻³ D I/ I -4 0 ×10-3 D I/ I El El max min Az Az max min PJ
0 1 2 20 40 60 80 0 0.44 0.88 1.33 0 20 40 60Visual S.E. wMEA
R e lati v e C o rti c a l D is tan c e (m m)
Relative Visual Distance (deg)
I
C o rti ca l e rr o r (m m ) V is u a l e rr o r (e d v a )*
***
*
*
Figure 2. Position. The visual (A&E), retinal (C&G) and cortical (B,D&F,H) expected position and size of the MEA are compared to their corresponding visual stimuli. (A) Schematic view of the visual field showing the 20 positions (grid) of the visual stimuli used for retinotopic mapping. Optic disk: asterix; MEA: colored circles; nearest visual stimulus: white square (stands for all Figures). (B) V1 retinotopic polar map for azimuth (left) and elevation (right). Color hue and brightness code respectively for the retinotopic position and the strength of the response. Scale bar: 2 mm. (C) Image of the eye fundus with the implant. (D) Extent and center-of-mass (contour and circle respectively) of V1 activations generated by visual (white, right map) and stimulation at ± 150 mA wMEA (red, left map). The activation amplitude depicted in the colorbar is expressed both in Z-score and in DI/I (see
Materials and methods). The solid line indicates the activation contour of the corresponding map and the superimposed dashed line corresponds to the compared condition; scale bar: 2 mm. (E-H) Same as in (A-D) in a different animal for 2 SE stimulations (cyan and purple; dashed circle: MEA position) at ± 200 mA; seeFigure 6Afor an example at low intensity in the same animal. (I) Retino-cortical magnification factor for azimuth computed over 20 animals (n = 177 displacements). Boxplots represent the median and interquartile range; whiskers represent ± 2.7s or 99.3 coverage if data are normally distributed (any points outside are considered as outliers). (J) Retinotopic based positional cortical error for visual and electrical activations (right: mm; left: equivalent degrees of visual angle). Black dots correspond to visual counterparts of electrical activations. One-sided two-sample Wilcoxon rank sum test for paired data: pSE vs. wMEA=0.056, nwMEA= 21, nSE= 82, NwMEA= 6, NSE= 7. Wilcoxon rank sum test for paired data:
*p=0.025, n = 13, N = 4 and ***p=5.35 10–5, n = 80, N = 6 (*p<0.05, **p<0.01, ***p<0.001, n = number of sample, N = number of rats).
DOI: 10.7554/eLife.12687.004
The following figure supplement is available for figure 2: Figure supplement 1. Raw maps.
(Hughes, 1979;Palagina et al., 2009).Figure 2Dright shows the cortical activation generated by such electrical stimulation at ± 150 mA (red contour). For a better visualization, we provided all the
maps without contour in SupplementaryFigure 2—figure supplement 1with scale bars expressed
both in Z-score (left of the colorbar) and in DI/I (right of the colorbar). Note that Z-score and DI/I
measures were highly and significantly correlated (median correlation coefficient r2= 0.81 between
all pixels of Z-score vs. DI/I maps with the corresponding [20-50-80] percentiles being [0.73–0.81–
0.88]%, all pval= 1.40e 45, N = 9 rats, n = 225 maps). A 20
˚
visual stimulus presented at this position(Figure 2Awhite square) generated activation at a similar position (Figure 2Dleft, white circle) but with an extent (white contour) that was much smaller than its electrical counterpart (red dashed line).
We then tested single electrode stimulation (SE, see Materials and methods).Figure 2E–Hshows an
example in another animal for two individual electrodes each stimulated at ± 200 mA. The evoked
activations for the two SE (Figure 2Hmiddle and right maps, cyan and purple) were about the size
of the 20
˚
visual activation (left map, white) and their positions within the activation generated bythe corresponding visual stimulus covering their retinal positions (Figure 2E). To generalize these
observations, we computed the retino-cortical magnification factors by measuring the cortical dis-tance between the centers of activation (white circles) elicited by visual stimuli displayed at different positions. Across 20 animals, the cortical distance between activations was plotted against the
dis-tance separating the visual stimuli (Figure 2I). We observed a linear increase of cortical distance with
visual distance, at a rate of 22 mm/
˚
(in accordance with the literature) (Gias et al., 2004). For allacti-vations (visual and electrical), we used this value to estimate the error (in mm and equivalent degree
of visual angle,
˚
eq) between the position of the activity’s center-of-mass and its expected positionwithin the retinotopic map. Visually evoked activations provided an approximation of the inherent
variability of that measure (Figure 2J, gray dots). On average, the cortical error was 0.32 ± 0.22 mm
for visual stimuli, 72% of the data points falling within the retinotopic representation of the 20
˚
stim-ulus (<0.44 mm). The same measure was applied to electrically evoked activations for SE and wMEA stimulations. For SE, the estimation of the position of the evoked activity was quite accurate (error of 0.46 ± 0.27 mm), 55% of evoked responses falling within the retinotopic expected position. Note that these error values are actually over-estimated since in practice, the implant was not obligatory located at the exact same retinal position that corresponds to the visual stimulus. Finally, wMEA acti-vations yielded responses with more variable and less accurate position than SE with an average error of 0.68 ± 0.47 mm, 38% of the evoked positions being within the expected representation.
Size
In the previous examples, we observed that the electrically-evoked activations are larger than
expected (Figure 2D,H). We thus quantified this effect by systematically comparing the extents of
the visually and artificially evoked activations (Figure 3). As shown in the example ofFigure 3A, the
extent of cortical activation linearly increased with visual stimulus size with an average slope of 81
mm/
˚
when estimated at population level (Figure 3B, N = 7). In comparison, the active surfacediam-eters of the SE and wMEA were of 0.05 and 0.65 mm (see Materials and methods) equivalent to 1
and 11
˚
of visual angle (Hughes, 1979), respectively. Although the visual stimuli covered a largerregion of the retina (20
˚
,Figures 2Dand3Ctop right), we observed a systematic and highlysignifi-cant increase of the cortical activation extent induced by wMEA stimulation in 94% of the cases (17/
18 conditions, 10 animals; see Materials and methods andFigure 3Dlegend for details on statistical
procedures), with an average increase of 2.9 ± 2.01 times the activation extent of the visual
stimula-tion (Figure 3D, thin gray lines). Please note that for this analysis, all electrical stimulations were
sys-tematically paired with the closest visual stimulus used for retinotopic mapping (Figure 3C, bottom
maps). In comparison, SE stimulation led to an average activation size of 0.9 ± 0.5 times their 20
˚
visual counterparts (Figure 3D). Using the visual-size tuning function (Figure 3B), we extracted the
equivalent visual stimulus sizes that would have evoked such cortical activations. These values
reached on average 24.4 ± 10.6 and 32.2 ± 11.5
˚
instead of 1 and 11˚
for the SE and wMEAconfigu-rations, respectively. Electrical stimulation hence led to extremely large diffusion of the activation, comparatively larger for SE than wMEA. Such differences could be explained by several factors including (i) the extent of wMEA activation being sometimes underestimated because of the limit of the imaged region of interest and (ii) the close proximity of the annular counter-electrode (reference)
in wMEA constraining lateral diffusion of the current (Cicione et al., 2012; Pham et al., 2013;
generates too large activation to obtain the necessary independence between electrodes; an inter-electrode spacing of at least 0.8 to 1.2 mm on the retina, at low- and high-intensity respectively, would be required to yield non-overlapping cortical activations.
Shape
Next we compared the shape of cortical activations to visual and prosthetic stimulations, because it may help understanding the origin of the spread. When compared to visual stimulus (white), we
gen-erally observed elongated cortical activation for SE (Figure 4Ablue) but not for wMEA (red)
stimula-tion. In order to quantify this elongation, we computed the aspect ratio (AR) of activation contours
at the level of the population (Figure 4B, see Materials and methods). Using pairwise
visual-pros-thetic comparison, we found a highly significant (seeFigure 4Blegend) increase in the aspect ratio
of the evoked activations for SE condition compared to their visual counterparts (1.66 ± 0.43 vs. 1.35 ± 0.19) but none for wMEA. These elongations could be caused by the recruitment of ganglion cells’
SE high
Visual wMEA high
2 deg
6 deg
10 deg
14 deg
18 deg
visual size (deg)
c
o
rti
c
a
l
s
ize
(m
m
)
0
1
2
3
4
5
0
10
20
30
40
50
e
q
u
iv
a
le
n
t
s
ize
(
d
e
g
)
A
B
C
D
0
10
20
30
0
1
2
3
4
***
z-s
c
o
re
c
o
rti
c
a
l
s
ize
(
m
m
)
**
-4 2 -3 -0.5 ×10⁻³D
I/
I
-8 -4 ×10 -4 -6 3z-s
c
o
re
D
I/
I
-20 0 ×10-4 -7 2z
-s
c
o
re
D
I/
I
Figure 3. Size. (A) V1 activation generated by visual stimuli of increasing size (value indicated above the maps). Center-of-mass: white circle; extent: white contour; equivalent ellipse orientation: white cross; scale bar: 2 mm. (B) Extent of cortical activation as a function of visual stimulus size pooled over 7 rats (linear fit: dashed black line). (C) Extent of cortical activations generated in 2 animals by SE (blue) and wMEA (red) stimulation (top maps) at a high current intensity (± 200 and 150 mA respectively) and their corresponding 20
˚
visual stimulus (white, bottom maps). Centers of mass of the activation: colored circles; scale bar: 2 mm. (D) Size of cortical activation generated by visual (gray, N = 20 rats); SE (blue, N = 8 rats) and wMEA (red, N = 10 rats) stimulation. Wilcoxon rank sum test for paired data: **p=0.0019 (n = 54, N = 8), ***p=1.83 10–4(n = 15, N = 10). An alternative ordinate ofequivalent visual counterpart is given on the right. Gray thin lines link paired electrical stimulation to visual activation. Solid horizontal black line indicates the size of a 20
˚
visual stimulus estimated from the fit in B. Note that we could not reveal any effect of the electrode-to-counter-electrode distance on activation size in the various SE configurations (not shown).A
E
C
B
SE high visual wMEA high1
1.5
2
2.5
3
3.5
a
s
p
e
c
t
ra
ti
o
***
0
45
90
1
1.5
a
s
p
e
c
t
ra
ti
o
cone angle (deg)
axons en passant contribution 0.1 0.2 0.3 0.4 0.5 0.6 0.7 0.8 0.9 1
0
45
90
cone angle (deg)
1
2
3
A
R
e
le
c
/
A
R
v
is
u
a
l
-5 1 -6 2 -4.5 -1.5 ×10⁻⁴ z-s c o re D I/ I -9.5 -5.5 ×10⁻⁴ z-s c o re D I/ IF
D
L M A P 0 15 30 45 Angle Difference (deg) 0 0.08 Pr o b a b il ity L M A P -6 -3 0 z-s c o reSE AR>1.6 SE AR<1.6 wMEA
Figure 4. Shape. (A) Shape of cortical activations generated in 2 animals by SE (blue) and wMEA (red) stimulation at high current intensity (top) and their corresponding 20
˚
visual stimulus (white, bottom). (B) Aspect ratio (AR) of cortical activations (Wilcoxon rank sum test for paired data, ***p=1.06 Figure 4 continued on next pageaxons en passant leading to oriented anisotropic cortical activations (Figure 1A right). However, why would SE activation yield stronger AR than wMEA? One explanation is that the ganglion cell neurons with axons that will be activated en passant, all converging radially towards the optic disk, are all located upstream to the electrode within a ’shadow cone’ with a top angle that will (i) decrease with the distance between the implant and the optic disk location and (ii) increase with the
size of the stimulated retinal surface (Figure 4—figure supplement 1). In a simple functional model
(see Materials and methods), we combined the predictions of what should be the shape and size of retinal activations due to local and en passant activation. Isotropic ’direct’ activations were modeled
as a Gaussian activation around the site of stimulation (Figure 4—figure supplement 1left column)
for different electrode sizes (Figure 4—figure supplement 1, rows). Anisotropic en passant
recruit-ment of ganglion cell axons was modeled as a shadow cone activation, i.e. all peripheral ganglion
somata whose axons have been activated by the electrical stimulation (Figure 4—figure supplement
1, middle column, Figure 4—figure supplement 1A for details in the model, see
Materials and methods). Via a weighted sum, we combined these two activations (right column and
Figure 4C insets) with different ratios (Figure 4—figure supplement 1B: 0.5 & C: 1). From these predicted activations, we extracted similar parameters (size, position, elongation) as we did from our cortical recordings. Since our interest is to predict the effect of axon-en-passant activation on radial elongation, we used the following convention for the AR: the numerator is the length of activation along the radial axis and the denominator is the length of activation along a tangential axis (perpen-dicular to the radial axis). This model predicted that the resulting retinal activation should indeed be
more elongated along radial axis for smaller cone angle (Figure 4CandFigure 4—figure
supple-ment 1, AR > 1), this effect being stronger when we increase the relative contribution of en passant activation. The model further predicts that the retinal activation should become more elongated along a tangential axis for very large cone angle (AR < 1). Please note that these predictions are left
unchanged if we apply a retino-cortical transformation to the simulated activations (seeFigure 4—
figure supplement 2C). To test for these predictions, we plotted the aspect-ratio of the activation across animals and experimental conditions as a function of the retinal ’shadow cone’ angle formed
by the stimulated surface (Figure 4D). Please note that, to account for any potential deformation of
the evoked activity due to retino-cortical magnification factor (see Figure 4—figure supplement
2A) or physiological noise, we normalized all electrically-induced AR to their corresponding visual
AR. In this plot we observed a similar decrease of the aspect ratio with the cone angle, confirming
our predictions (Figure 4C). Our results thus suggest that the difference we observed between
wMEA and SE is explained if we make the hypothesis that part of the functional activation of the visual system comes from of axons en passant recruitment. Note that our model suggests that the Figure 4 continued
10–4, n = 44, N = 7). (C) Predictions of the elongation of electrical activations as a function of the contribution of axons en passant and the distance to
the optic disk. Insets correspond to a model of retinal activation due to direct isotropic activation plus passive electrical diffusion and anisotropic activation due to axons en passant recruitment for 3 different electrode sizes. The brightness codes the strength of the response. Center of the white dashed target: position of the optic disk; black circle: position and size of the MEA active surface; gray lines: ’shadow cone’ angle sustained by the MEA active surface respective to the optic disk location; colored contour: size and shape of the global retinal activation for an axons en passant contribution of 1 (alpha, see Materials and methods). (D) Elongation of electrical activations relative to their corresponding visual activations (AR electrical/AR visual) as a function of the ’shadow cone’ angle. (E) Cortical radial organization of prosthetic activations. Solid segments: orientation of cortical activations; dashed segments: optimal radial orientation towards the black disk; segment crossing; geometrical center; red dot: center-of-mass of cortical activations; Dark disk: cortical position that optimized radial organization; gray disk: median position of the optic disk. The blue lines connect the center-of-mass to the geometrical center of activations. Scale bar: 0.5 mm. Inset: distribution of median angular deviation expected by chance compare to our observation: blue segment. (F) Top: centered and reoriented deviations of the center-of-mass (blue disks) to the geometrical center (center of the representation), horizontal dashed axis corresponds to the orientation of the radial organization. Bottom: averaged, centered and reoriented SE (with AR > and < than 1.6, left and middle respectively) and wMEA maps (right). White circle: center-of-mass; additional dashed contour corresponds to a Z-score of 4.5.
DOI: 10.7554/eLife.12687.007
The following figure supplements are available for figure 4: Figure supplement 1. Model of retinal anisotropic activation.
DOI: 10.7554/eLife.12687.008
Figure supplement 2. Model of retino-cortical transformation.
isotropy observed for wMEA activations simply results from the geometrical arrangement between the electrode size and the shadow cone. We thus conclude that wMEA activations are still suffering from contamination by the activation of fibers en passant. Hence SE simulation remains the best con-figuration to achieve the highest performance in spatial resolution. According to our simple model, the relative contribution of axons en passant to the global prosthetic activation should be of the same order of magnitude as direct activation (alpha = 1, see Materials and methods: model of retinal activation).
Thus, the predictions that arise from this observation are: for small cone angle (i) the elongation of the cortical activation should be radially organized towards the representation of the optic disk and (ii) the activation should be anisotropic, attracted by the radial elongation towards more eccen-tric positions (i.e. away from the optic disk representation); lastly (iii) for large cone angle, cortical activation should be more elongated along a tangential axis. To test for these predictions, we pooled together all activation profiles that were sufficiently elongated, i.e. with an AR above 1.6,
and plotted them in cortical space (Figure 4E). In this figure, each solid segment corresponds to the
orientation of a cortical activation. The dark disk is the cortical position that optimized the radial arrangement of the observed orientations (see Materials and methods). Observed orientations of cortical activation deviated from an optimal radial organization (dashed lines) to this cortical position
by only 13.3
˚
(median value across N = 20 activations). Importantly, this cortical position is close to,and in the same direction as, the median position of the optic disk (gray disk). This latter one was estimated from 16 experiments whenever its mapping was possible. However, we could not use it systematically because of imprecision in its estimation (see Materials and methods). We then checked whether this result could occur by chance. For that purpose, we generated 1000 random distributions of orientations at the observed positions and, for each, looked for the cortical position that optimized radial arrangement (as described above). For this position, we computed the median angular deviation between the random orientations and the optimal radial arrangement to this posi-tion. This led to a Gaussian distribution of median angular deviation expected by chance in our
par-ticular configuration, with a mean of 23.6 ± 4.9
˚
(Figure 4Einset). Our observation of 13.3˚
(red line)is significantly smaller than what would be expected by chance (p=0.02, see Materials and methods). To test for the second prediction of anisotropic activation that our model raised, we compared the
center-of-mass of the activation (Figure 4Ered dot) to the geometric center (dashed and solid line
crossing). Indeed if the activity is attracted away from the blind-spot, the center-of-mass must be delocalized from the geometrical center, opposite to the position of the blind-spot. We plotted the
position of the center-of-mass (red points inFigure 4E), and indeed observed that it was pushed
away from the optic disk representation.Figure 4Fpresent a centered, reoriented and zoomed view
on all deviations of the center-of-mass (red disk) to the geometrical center (center of the representa-tion) within the same reference frame (horizontal dashed axis being the radial organizarepresenta-tion).
Center-of-masses all deviated away from the optic disk with an averaged angular deviation of 168
˚
(oppo-site deviation being 180
˚
). To better illustrate this deviation, we averaged all the maps underconsid-eration in this analysis, after realignment along the radial axis (the axis linking the activation to the
BS, here the BS is to the right) and centering (Figure 4Fbottom left). We can see from this averaged
map that there is indeed a radially elongated and anisotropic activation opposite to the representa-tion of the blind spot (dotted contour represent activarepresenta-tion higher than 4.5 z-score). For comparison, we made similar averaging on all the other maps in response to SE (with an aspect-ratio < 1.6) and wMEA. For SE activation with low AR, the result shows an activation that is more isotropic. For MEA activation, the averaged map shows, as predicted, a slight elongation along the tangential axis. Hence, in our experimental observations, the radial arrangement and deviation of the center-of-mass of the activation behave as expected from an activation of en-passant axons in the retina.
Intensity
Encoding different levels of luminance is an important aspect of prosthetic vision. We thus investi-gated the effect of stimulus intensity. Increasing luminance non-linearly increased the cortical
activa-tion size and amplitude (Figure 5A). Across the population (N = 8), we fitted the response
amplitude (Figure 5C) with a Naka-Rushton function (Naka and Rushton, 1966) for the whole
popu-lation (black dotted line), as well as for each animal individually (thin gray lines). The luminance of
semi-saturation was 9.6 ± 2.9 cd/m2. We then compared these results with the intensity of electrical
animals (wMEA: 10, SE: 25), we observed a gradual increase of response amplitude for both wMEA
and SE electrical stimulation, well captured by Naka-Rushton fits (Figure 5D–E, thick dotted lines).
The intensity of semi-saturation (Figure 5F) was significantly lower for SE than for wMEA (20.29 ±
3.25 mA vs. 52.66 ± 17.35 mA, see legend for details on statistical procedure).Figure 5Gcompares
the exponent of the individual fits performed on the amplitude parameter for visual, SE and wMEA stimulation. Steep transitions were observed for wMEA (n = 5.58 ± 3.54) and for visual luminance (n = 6.05 ± 3.01) whereas more gradual transitions were observed for SE (n = 1.34 ± 0.6) which
sig-nificantly differed from wMEA and visual stimuli (see Figure 5G legend). As a consequence, the
Single wMEA Visual
A
B
C
D
F
4 8 16 37.5 75 150 300 μAmpG
H
0.5 2 10 50 0 5 10 15 luminance (cd/m2) a mp lit u d e (z-sco re ) 0.5 4 35 300 0 5 10 15current intensity (μA)
0.5 4 35 300 0 5 10 15 0.5 4 35 300 0.5 2 10 50 e q u iva le n t lu mi a n ce ( cd /m 2)
vis wMEA single 0 20 40 60 80 co n st a n t o f se mi -sa tu ra ti o n ( c d /m 2 )
vis wMEA single 0 2 4 6 8 10 e xp o n e n t 2 13.75 25.5 37.25 49 cd/m2 μ Amp a mp lit u d e (z-sco re ) a mp lit u d e (z-sco re )
current intensity (μA)
**
**
***
-4 2 -14 -2 ×10⁻⁴ Z -s c o re D I/ I -2 -3 -1 ×10 -6 2 -1.5 -0.5 ×10⁻³ -6 2 Z -s c o re D I/ I Z -s c o re D I/ I 0 20 40 60 80Figure 5. Intensity. (A) V1 activation generated by visual stimuli of increasing luminance (value indicated above maps). Center-of-mass: white circle; extent: white contour; equivalent ellipse orientation and size of activation contour: white cross; scale bar: 2 mm. (B) V1 activation generated by SE (top) and wMEA (bottom) in 2 different animals at high current intensity. Center-of-mass of visual and electrical activations are indicated with white and colored circles respectively and extent of electrical activation in colored contours; scale bar: 2 mm. (C) Amplitude of cortical activation as a function of visual stimulus luminance computed over 8 rats (population fit: dashed black line; individual fits: gray thin lines). (D) Amplitude of cortical activations generated by wMEA stimulation at high current intensity. Population fit: dark red dashed line; individual fits: orange thin lines (N = 10). (E) Amplitude of cortical activations generated by SE stimulation at high current intensity. Population fit: dark blue dashed line (N = 25). Note that individual fits (cyan thin lines) were only performed on N=6 animals (tested with 7 different levels of intensity) and not on the others (N=19, tested with only 2 different levels: 50 and 200 mA). (F) Constant of semi-saturation (c50) for visual (gray in cd/m2) and electrical activations (wMEA: red and SE: blue, in mA). Two-sample Wilcoxon rank sum test: **p=0.0017, nSE= NSE= 6, nwMEA= NwMEA= 10. (G) Exponent of the naka-rushton fits for visual (gray) and electrical
activations (wMEA: red and SE: blue). Two-sample Wilcoxon rank sum test: ***pSE vs. visual=6.66 10–4(nSE= NSE =6, nvisual= Nvisual =8); **pwMEA vs. SE=0.0075 (n
SE= NSE =6, nwMEA= NwMEA = 10); pwMEA vs. visual=0.896 (nwMEA= NwMEA =10, nvisual= Nvisual =8). (H) Amplitude-based correspondence for
all electrical activations to their visual counterpart (wMEA: red and SE: blue) as a function of current intensity level (in equivalent cd/m2). DOI: 10.7554/eLife.12687.010
operating range (see Materials and methods) of the intensity response function in visual stimulation
was on average 9.2 ± 4.8 cd/m2, 82.5 ± 88.4 mA for wMEA and much broader for SE (182.6 ± 151.4
mA). This is further reflected inFigure 5Hplotting the hypothetic equivalent luminance of electrical
activations. We estimated the equivalent visual luminance that corresponds to the response
ampli-tude evoked by electrical stimulation using the Naka-Rushton fit (Figure 5C). The functional
operat-ing range induced by current intensity manipulation allowed generatoperat-ing an artificial activation with
an equivalent luminance that could theoretically be in the range of 2–50 cd/m2.
Focalization
The previous results show that artificial activations of the visual system with sub-retinal implants gen-erate stimuli of appropriate position and scalable intensity, but whose size is on average 2.4 and 5.8 times larger than expected for wMEA and SE, respectively. This clearly impairs the functional effi-ciency of the implants. We therefore took advantage of our experimental design to seek solutions for controlling the spatial extent of the functional activation. Several candidate parameters have
been investigated for SE stimulation (Figures 6 and7, respectively blue vs. green colors): polarity
(cathodic vs. anodic pulse first,Figure 6A–B), symmetry vs. asymmetry of the biphasic square pulse
(McIntyre and Grill, 2000) (Figure 6C–D) and regular pulses vs. electrical impedance
spectroscopy-0
1
2
3
4
c
o
rti
c
a
l
s
ize
(m
m
)
−+50 +−50 −+200 +−200 μAC
0
1
2
3
4
c
o
rti
c
a
l
s
ize
(m
m
)
−+200 −+200 Asy +−200+−200 μA AsyD
A
+− 50
−+ 50
−+ 200
+− 200 μA
B
+- 200 μA
−+ 200 μA
**
*
-4
3
-8
0
-3.5
-1.5
×10
-3-4
3
Z
-s
c
o
re
D
I/
I
Z
-s
c
o
re
D
I/
I
-3-3
-0.5
×10
Z
-s
c
o
re
D
I/
I
-3.5
-1
×10
-3Figure 6. Focalization. (A) SE activations generated by square pulses of different polarity (anodic first: blue; cathodic first: green) at 2 intensity levels (50 and 200 mA). Scale bar: 2 mm. (B) Effect of polarity and intensity on cortical extent for SE (anodic first: blue; cathodic first: green, N = 10). One-sided Wilcoxon rank sum test for paired data, p=0.3802 (n = 18, N = 10) and 0.0615 (n = 11, N = 10) for 50 and 200 mA respectively. (C) Individual example of asymmetrical (green) and symmetrical (blue) square pulses, same animal as in (A). (D) Effect of square pulse asymmetry (green) for two polarities on cortical extent for SE (N = 10). One-sided Wilcoxon rank sum test for paired data: **pCathoSym vs. CathoAsy=0.0052 (n = 13, N = 10); *pAnoAsy vs.
CathoAsy=0.0469 (n = 6, N = 10).
0 10 20 −500 0 500 vo lt a g e (mV) time (ms) Reference 0 10 20 −250 250 vo lt a g e (mV) time (ms) 0 10 20 −500 0 500 vo lt a g e (mV) time (ms) Adapted 0 10 20 −50 0 50 vo lt a g e (mV) time (ms) Tissue Injected
A
B
C
0
1
2
3
4
5
c
o
rti
c
a
l
s
ize
(m
m
)
ref low adapted low ref high adapted high**
*
-4
3
-3
-0.5
×10
-3Z
-s
c
o
re
D
I/
I
-+ 5 Vpp
-+ 12Vpp
0Figure 7. Impedance spectroscopy adaptation. (A) Example of electrode-tissue interface filtering on pulse shape (at 500 mVpp) with (green) and without (blue) IS based adaptation. Top: injected pulse; bottom: pulse shape reaching the tissue. (B) Individual example of IS adaptation (green, top maps) and reference (blue, bottom maps) for 2 voltage levels; scale bar: 2 mm. Note that for this protocol only, we switched from current to voltage injection. (C) Effect of IS adapted pulses on cortical extent for SE at 2 intensity levels (5 and 12 Vpp in voltage Figure 7 continued on next page
based (IS) adaptation (Dupont et al., 2013) (Figure 7). In the example shown and over the
popula-tion (Figure 6A–B), our results showed that the polarity of symmetric biphasic pulses did not
signifi-cantly influence the extent of the cortical activation for the two intensity levels tested. However, the
polarity was found to have a significant effect in asymmetric pulses delivered at 200 mA (Figure 6C–
D). The combination of asymmetric with anodic-first stimulation (Figure 6C top right) generated
smaller activation of 1.66 ± 0.71 mm corresponding to 17.12 ± 8.11
˚
eq(N = 7), smaller than the threeother combinations. However, this reduction was not systematic (70% of the cases compared to the symmetrical pulse) and small (20.43% ± 54.32, the corresponding [20-50-80] percentiles being [34.78–32.93–63.89]%). Please note that this negative result is the outcome of thorough manipula-tion of key parameters of the electrical stimulamanipula-tion and highlight the high variability of the changes induced. Our best result at this stage is obtained by combining the polarity and the asymmetry parameters.
One general issue encountered when injecting current or voltage in a tissue, and often ignored, is that the desired pattern to be injected can be strongly distorted by the non-ohmic properties of the
electrode-tissue interface (Geddes, 1997; Pham et al., 2013). In a previous study (Pham et al.,
2013), we indeed showed that the impedance phase and magnitude of the electrode-retina
inter-face was found to be highly capacitive, yielding strong distortion of the applied stimulus (Figure 7A,
left bottom) and lateral diffusion of the injected pattern. Our rationale was therefore to use the char-acterization of the physical properties of the electrode-tissue interface to calibrate through reverse engineering methods what needs to be injected to obtain the desired pattern in the tissue. To do
so, we characterized the impedance spectrogram of selected SE of each implantation (Pham et al.,
2013). Using an equivalent electronic circuit accounting for the observed non-ohmic behavior, we
simulated (Figure 7—figure supplement 1B, see Materials and methods for details on the
proce-dure) the adapted pattern of voltage injection (Figure 7A, top right) that will generate the desired
pattern shape in the implanted tissue (Dupont et al., 2013) (Figure 7A, right bottom). Note that,
for this protocol only, we switched from current to voltage injection and that the low voltage level used here was of the same order of magnitude as the high current level used in the previous
proto-cols. For 100% and 88% of the low and high voltage level cases respectively (5 Vppand 12 Vpp,Vpp:
Volts peak-to-peak), the adapted pattern injected through SE decreased the extent of the activation (Figure 7Btop maps & 7C). This significant decrease (seeFigure 7Clegend) varied on average from 36 ± 32% to 20.7 ± 29.2% at low and high voltage, respectively (the corresponding [20-50-80] per-centiles were [11.78–27.50–59.05] and [1.89–6.56–39.67]%). Importantly, at high voltage it was not accompanied by a significant change in response amplitude (Wilcoxon rank sum test: p=0.546, n = 8, N = 4), suggesting that this reduction of the extent was not simply explained by a change in activation strength level, allowing for an independent control of the extent (size) and the amplitude (intensity) of the evoked activity.
Discussion
We have here described a detailed characterization of the functional impact of sub-retinal prosthesis at the V1 mesoscopic scale level of rats and proposed an original solution to control its extent. In detail, we have generated a precise mapping of the rodent cortical cartographical organization in response to position, size and intensity of visual stimuli. These cortical population maps were then used to establish a functional interpretation of the activations induced by electrical stimulation. The recording of robust and reliable electrically and visually evoked responses indicates that both types of information are efficiently transmitted to the primary visual cortex and prove the functional integ-rity of the retinal tissue after implantation, which was also anatomically confirmed by retinal imaging Figure 7 continued
injection mode). IS adapted pulses: green; reference: blue, N = 4. One-sided Wilcoxon rank sum test for paired data: *p=0.0117 (n = 8, N = 4), **p=0.0078 (n = 7, N = 4).
DOI: 10.7554/eLife.12687.012
The following figure supplement is available for figure 7: Figure supplement 1. Principle of IS adaptation.
(OCT). Here we demonstrate that prosthetic stimulation generates a functional activation that occurs at the expected retinotopic location and amplitude but whose extent and aspect ratio are signifi-cantly larger than expected. To control the extent of cortical activation we tested various patterns of electrical stimulation and showed that supervised design of the electrical pulses – taking into account the physical filtering properties of the electrode-retina interface – allowed focalizing the activation.
The working hypothesis of this study is that population activation of the first cortical integration
stage is correlated to underlying evoked percepts, as suggested by many studies (Chen et al.,
2006;Ni, 2010;Palmer et al., 2007;Tehovnik and Slocum, 2006). Furthermore, the link between population activation in optical imaging and spiking discharge has long been established (Chen et al., 2012;Das and Gilbert, 1995;Shmuel and Grinvald, 1996;Toth et al., 1996). Lastly, a recent study showed that the spatial profile of cortical population activation in the awake monkey
biases the shape of the evoked percept (Michel et al., 2013). Therefore, we believe that the current
approach is valid for an initial description of the functional activation of retinal prosthesis. The next step will be to launch experiments in behaving non-human primates, to clarify, in a model closer to humans, the relationship between the properties of the population prosthetic activation and the behavioral evaluation of the animal’s percepts.
Accurate activation in position and intensity
Prosthetic activation yielded to cortical activations that were consistent with the V1 retinotopic orga-nization. The degree of positional precision, higher in SE compared to wMEA, was of the same order
of magnitude as the 20
˚
visual stimuli. However, this measure was quite variable, as expected giventhe poor precision of the murine visual system (Euler and Wa¨ssle, 1995). Here we significantly
extended previous investigations that have first used mesoscopic optical recordings to image the
cortical features of the prosthetic activation but on a limited number of animals (Walter et al., 2005)
and with no quantitative statistical analysis (Eckhorn et al., 2006; Walter et al., 2005). Our
approach allowed providing a clear and quantitative description of the prosthetic activation.
We have also shown that increasing the level of current intensity increases the amplitude of the evoked cortical response with a sigmoidal profile similar to the one observed with visual luminance.
Such non-linear profiles are typically well characterized by their threshold and slope (Naka and
Rush-ton, 1966). The threshold differences observed in wMEA and SE stimulation configurations can trivi-ally result from difference in active electrode surface. However, our experiments unveiled that SE offers a larger operating range (182 vs. 82 mA for wMEA) to cover a theoretical modulation range of
about 50 cd/m2. This result demonstrates that small electrode sizes will be more appropriate to
make fine manipulation of stimulus intensity. Importantly, our results also revealed that the increasing stimulus intensity increases both the response size and the response amplitude. This observation is crucial to consider since it will seriously challenge independent manipulation of those important parameters in prosthetic vision.
Distorted activation in size and shape
Our results demonstrate that the size elicited with standard parameters is approximately 2.4 to 5.8 times larger than expected for wMEA and SE, respectively. This increase can be partly explained by
passive electrical diffusion in the implant-retina interface, as we previously suggest (Pham et al.,
2013), but also by the activation of en passant ganglion axons. The spatial resolution of the
pros-thetic retinal activation measured in our experiments, about a millimeter of retinal space, is actually
comparable to what has been reported in other animals (as estimated from Eger et al., 2005;
Schanze et al., 2003) as well as in human studies (as estimated fromAhuja and Behrend, 2013;
Humayun et al., 2012;Stingl et al., 2013) and extends beyond the retinal point spread function (Stett et al., 2000,2007).
Are these results accentuated by the anesthetized state of the animal? Indeed, recent experi-ments showed that anesthetized mice have less surround inhibition than when awake (Vaiceliunaite et al., 2013). However, Vizuete et al (Vizuete et al., 2012) have shown that anesthe-sia affects not simply the inhibition but more probably the balance between excitation and inhibition
(see also Chemla and Chavane (2016)). Hence, predicting how activation size of the population
make a systematic comparison between conditions done under similar level of anesthesia (visual vs. electrical) and the polarity of the effect (the size increasing or decreasing) is not expected to reverse by changing the animal state.
For SE stimulation, large activations were also accompanied by an increase in the aspect ratio of the spatial profile of the cortical activation suggesting an asymmetric recruitment of the retinal
tis-sue, for instance through activation of ganglion axons en passant (Nowak and Bullier, 1998a,
1998b). However, this increase in aspect ratio was not observed with wMEA. Using a simple model, we show that such difference in aspect ratio between stimulation conditions is actually to be expected because of differences in the spatial distribution of activation of axons en passant. Our model also allowed predicting that, to account for the observed spatial profiles, axons en passant should contribute to the same proportion than direct activation of the retina. In accordance with this prediction, we found that high aspect ratio activations distribute radially around the cortical repre-sentation of the blind spot and are asymmetrical, with center-of-masses displaced away from the
blind spot representation. In contrast, Fransen et al. (Fransen et al., 2014) discard the possibility of
direct RGCs activation through near infrared laser stimulation of photovoltaic subretinal array because of the absence of responses in the superior colliculus using inner retina synaptic blockers. However, several factors, including the low efficiency of photovoltaic transduction and the level of injected currents used in our study, might explain the differential recruitment of RGCs cell bodies and axons observed here using V1 population recordings.
Since most implantations occurred at more or less the same retinal eccentricity, our model pre-dicts that activation size and aspect-ratio should be inversely related: the smaller the activation size
(equivalent to a smaller cone angle for a fixed eccentricity), the larger the expected aspect ratio.
Fig-ure 8indeed shows that the averaged sizes observed for standard electrical stimulations are system-atically inversely correlated to their aspect ratio. Remarkably, all regular manipulations of the stimulation pattern moved the activation spatial profile along that inverse relationship. In contrast, visual activation does not display such correlation, the aspect-ratio being small and independent of
activation size (Figure 8, gray dots). This relationship could therefore be taken as a diagnosis of the
way electrical stimulation activates the retinal circuitry with lateral isotropic diffusion and anisotropic axons en passant activation. To mimic a functional visual activation, it is therefore needed to decrease both the extent and the aspect ratio of the prosthetic activation.
How to improve prosthetic activation?
Charge balanced biphasic pulses, delivered in voltage or current mode injection, are of common use
in human (Ahuja and Behrend, 2013;Fujikado et al., 2007;Humayun et al., 2012;Klauke et al.,
2011;Nanduri et al., 2012;Rizzo, 2003;Shepherd et al., 2013;Stingl et al., 2013;Wilke et al., 2011; Zrenner, 2013; Zrenner et al., 2010) or animal (Chowdhury et al., 2008; Cicione et al., 2012; Eckhorn et al., 2006; Eger et al., 2005; Elfar et al., 2009; Matteucci et al., 2013;
Nadig, 1999;Schanze et al., 2003;Walter et al., 2005;Wong et al., 2009) studies of prosthetic vision. In the literature, we observed a large consensus concerning the use of cathodic pulse first for
epiretinal stimulation (Ahuja and Behrend, 2013; Eckhorn et al., 2006; Eger et al., 2005;
Elfar et al., 2009;Fried et al., 2006;Nanduri et al., 2012; Schanze et al., 2003;Walter et al.,
2005) although not for subretinal, suprachoroidal and extraocular approaches (Chowdhury et al.,
2008;Cicione et al., 2012;Eckhorn et al., 2006; Fujikado et al., 2007;Matteucci et al., 2013;
Stingl et al., 2013;Wilke et al., 2011;Wong et al., 2009). It has been shown in vitro (Jensen et al.,
2005) that the use of single cathodic pulse lowers the threshold of retinal ganglion cells (RGCs),
low-ers the latency of inner retina mediated RGCs response and targets more specifically RGCs cell bod-ies when compared to anodal pulses. As far as we know, only one study systematically examined the
effect the polarity of charge balanced biphasic square pulses (Chowdhury et al., 2008). Using an
extraocular device, Chowdhury et al. did not find any significant effect of the pulse polarity on the threshold of V1 electrically evoked potentials. Similarly, we did not find any effect of the polarity on the size of cortical activations. Altogether, anodic asymmetric pulses were the best among classical stimulations to restrict cortical activations, although not systematically. This result contradicts the
prediction of the pioneer modeling work of McIntyre & Grill (McIntyre and Grill, 2000), which
pre-dicts more focal activation for cathodic asymmetrical pulses using a cable model. To conclude, basic manipulation of the electrical pulses did not yield a systematic reduction of the spatial extent of the
10 deg 20 deg SE wMEA With Without ASYM SYM ASYM SYM
1
2
3
size (mm)
1.5
2
a
s
p
e
c
t
ra
ti
o
VISUAL SE IS ANODIC CATHODIC HIGHFigure 8. Differential effect of SE patterns. Averaged cortical size and aspect ratio (± sem: black error bars) elicited by visual stimuli, by the wMEA and by the different SE stimulation patterns delivered at high intensity levels. Gray circles: 10 and 20 deg visual stimuli (n = 7 and 75, respectively); cyan and red squares: high intensity symmetrical stimulation patterns for SE (n = 57) and wMEA (n = 10) respectively (both polarities); green and cyan circles: respectively IS adapted and non-adapted pulses delivered at 5 Vpp (n = 7, same order of magnitude as the other pulses delivered at high current intensity); green and cyan up triangles: respectively asymmetrical (n = 7) and symmetrical (n = 21) anodic first pulses delivered at ± 200 mA; green and cyan down triangles: respectively asymmetrical (n = 8) and symmetrical (n = 24) cathodic first pulses delivered at ± 200 mA. Lines link comparable conditions. The different SE patterns evoke activations that exhibit strong correlation between size and aspect ratio (gray shaded area), except for IS adapted stimuli which converge towards visual responses.
stimulation configurations lead to the same inverse relationship suggesting that all activated the reti-nal network through diffusion and axons en passant.
Note that other strategies, such as current steering methods, could be investigated in future in
vivo studies (Jepson et al., 2014a). These authors showed in in-vitro isolated retinal preparation,
that it was possible to improve the spatial resolution of the implant up to the activation of a single
RGC type with a single action potential resolution (Jepson et al., 2013;Sekirnjak et al., 2008).
To further scrutinize optimal stimulation parameters, we have also used a more ’supervised’ approach by adapting the shape of the desired retinal stimulation through impedance spectroscopy to account for the filtering properties of the electrode-tissue interface (resistive and capacitive
com-ponents) (Dupont et al., 2013;Pham et al., 2013). Our results show that electrical stimulation
adap-tation systematically and accurately decreased the activation spread while preserving their location and amplitude, when compared to their paired controls. Crucially, it was the only configuration we
tested whose decrease in extent was not accompanied by an increase in aspect ratio (Figure 8, filled
circles), similarly to functional visual stimulation. This strongly suggests that such stimulation reduces both the electrical diffusion extent (although not completely) and the axons en passant activation. What is the origin of the reduction of electrical diffusion? This could arise from the change of the
shape of the injected current, that activate less high frequencies (Figure 7—figure supplement 1C)
that increase the spread of the electrical diffusion and the current density magnitude (Pham et al
2013). By which mechanisms axons-en-passant would be less activated? Two mechanisms are
possi-ble. First, this could be a consequence of the reduction of the electrical diffusion. Since we are posi-tioned subretinally, reducing the diffusion will favor activation of elements closer to the electrode (photoreceptors, bipolar cells. . .) compared to further away (ganglion cells). A second mechanism would originate from the fact that the duration of each adapted pulse (anodic or cathodic) in the tis-sue is much longer (1.2 ms on average) than the transients contained in the non-adapted pulses (0.2 ms on average). This can favor activation of cell bodies since axons have shorter chronaxie, gen-erally some hundreds of microseconds, than cell bodies, gengen-erally several milliseconds (McIntyre and Grill, 2002;Nowak and Bullier, 1998b, 1998a; Ranck, 1975;Stern et al., 2015;
Tehovnik and Slocum, 2009,Histed et al., 2009). This effect could be further amplified by the fact that the adapted pulse inside the tissue was also biphasic, cathodic phase first and asymmetrical in
amplitude. According to the work of Mc Intyre & Grill (McIntyre and Grill, 2002), these are the
con-ditions for which we can expect the threshold for activation to increase for axons and to decrease for the soma. It is thus expected that the adapted condition will lower the contribution of fiber-en-passant, since the amplitude of the current injected in the tissue was lower in adapted than in non-adapted mode. This is therefore a very promising solution getting closer to a more natural visual activation of the retinal network. Importantly, it is noteworthy to point out that this stimulation strat-egy can be easily embedded in already available commercial devices using small electronic circuits. Supervised adaptation of electrical pulse based on the electrical properties of the electrode-tissue interface is therefore a promising solution for retinal, but also probably, for cochlear prosthetic stim-ulations and more generally for all neuro-stimulation applications.
As a perspective, one may consider to combine the advantages of the different methods that have been shown, here and in other publications, to have an effect: adaptation, asymmetry of the
pulse (McIntyre and Grill, 2001) and the spatial arrangement of stimulating and counterelectrodes
(Jepson et al., 2014a). The possible independence of the mechanisms by which these methods decrease the activation size may allow an additive gain in spatial resolution.
Conclusion
Here we provide a clear quantitative functional description of retinal prosthetic activations by using a systematic comparison of artificial and natural activation of the rodent visual system. Using a similar approach, further investigations will have to probe the dynamical aspect of these prosthetic activation to better understand how to generate spatio-temporal activations in the visual pathway (Elfar et al., 2009;Fried et al., 2006) that are similar to the ones observed in response to natural stimuli. A further challenge will be to drive the stimulator to generate activity closer to the retina’s
natural neural code (Nirenberg and Pandarinath, 2012), which may involve taking into account
higher order correlations (Marre et al., 2012;Marre and Botella, 2014). All these strategic steps
will greatly benefit from animal models such as the one used here. To conclude, our work demon-strates that pre-clinical studies are a necessary prerequisite to validate and improve the efficiency of
retinal implants, equivalent to animal models that are the foundation of any drug development for human pharmacology. We thus expect that our study will pave the way for fast and significant improvements of the clinical benefits offered to implanted patients.
Materials and methods
Animal preparation
A total of 35 Brown Norway male rats (1.5–3 months old, 230–320 g) were anesthetized using an intraperitoneal injection of urethane. The experimental protocol was approved beforehand by the local Ethical Committee for Animal Research and all procedures complied with the French and
Euro-pean regulations on Animal Research (approval n
˚
A12/01/13) as well as the guidelines from theSoci-ety for Neuroscience. Instead of a complete craniotomy, the bone was thinned with a drill until a clear optical access to V1 surface was obtained. Finally, transparent silicone was applied to the remaining bone and the preparation was covered with a glass slide.
Retinal implants
We used subretinal Micro Electrode Arrays (MEAs) manufactured at the CEA-LETI (Pham et al.,
2013) (Grenoble, France). These planar MEAs of 1 and 1.2 mm diameter comprise respectively 9
and 17 (50 mm radius, 3 mm thick) platinum (Pt) contacts and a large annular Pt counter-electrode
(CE) within a polyimide flexible substrate (Figure 1Ctop row). The electrical connection between
the MEA and the stimulator (BioMEA, CEA-LETI) (Charvet et al., 2010) is made using an Omnetics
18-position nanominiature connector.
Sub-retinal implantation procedure
The MEAs were implanted between the pigmentary epithelium and the outer segment
photorecep-tor layer (Figure 1Cbottom row). Eyedrops of oxybuprocaı¨n chlorohydrate were used to provide a
local anesthesia and the pupil was dilated using atropine drops. The bulbar conjunctiva was removed on the top of the eyeball and a millimetric incision of the sclera was performed to access the subreti-nal space. A cannula was then carefully inserted and a controlled injection of balanced saline solution (BSS; from B. Braun Medical Inc.) was used to induce a retinal detachment by hydrodissection. The implants were then carefully inserted and advanced below the retina towards the desired position. Eye fundus and/or OCT imaging were then performed to check implantation quality as well as the absence of potential lesions. After each implantation a recovery period from 30 min to 1 hr was respected before starting data acquisition and the presence of visual evoked cortical activation was used to probe the functional integrity of the implanted retinal tissue.
Eye fundus and OCT
In some animals, the retina was imaged using the scanner 3D OCT-2000 (Topcon, Tokyo, Japan), allowing a complete assessment of the area around the MEA. Each acquisition combined both OCT and fundus imaging. The OCT has an axial resolution of 5 mm. The superluminescent diode light source used is centered at 840 nm with a bandwidth of 50 nm adapted for retinal imaging. The focus was adjusted manually on the retina above the MEA. The analysis was performed using 3D OCT-2000 software (Topcon, Tokyo, Japan) and consisted in the localization of the MEA on the cor-responding B-Scan cross-sections. For fundus images, the OCT was combined with a camera (Nikon R_D90, Nikon Imaging Japan Inc.) that uses a white light flash with green filter, allowing color or red-free acquisitions. An additional +20 D magnifying lens was used to enlarge the field of view of the apparatus originally designed for measurements on humans. Note that the use of this lens
induced optical artifacts in fundus (Figure 1C top row, halos of light). Finally, the positions of the
implant and of the optic disk were back projected onto the visual stimulation screen using an oph-thalmoscope coupled with a laser.
Data acquisition
We imaged 5*5 mm cortical windows using 2 different intrinsic imaging systems, the MiCAM ULTIMA imaging (SciMedia, 100*100 pixels, 33.3 Hz) and data-acquisition system as well as a Dalsa camera (Optical Imaging Inc, 340*340 pixels, 30 Hz) controlled by the VDAQ data-acquisition system