HAL Id: hal-01743053
https://hal.archives-ouvertes.fr/hal-01743053
Submitted on 11 Jun 2020HAL is a multi-disciplinary open access
archive for the deposit and dissemination of sci-entific research documents, whether they are pub-lished or not. The documents may come from teaching and research institutions in France or abroad, or from public or private research centers.
L’archive ouverte pluridisciplinaire HAL, est destinée au dépôt et à la diffusion de documents scientifiques de niveau recherche, publiés ou non, émanant des établissements d’enseignement et de recherche français ou étrangers, des laboratoires publics ou privés.
Fluorescence-based knife-edge beam diameter
measurement to characterize X-ray beam profiles in
reflection geometry
Léna Bassel, Xavier Tauzin, Alain Queffelec, Catherine Ferrier, Delphine
Lacanette, Rémy Chapoulie, Bruno Bousquet
To cite this version:
Léna Bassel, Xavier Tauzin, Alain Queffelec, Catherine Ferrier, Delphine Lacanette, et al.. Fluorescence-based knife-edge beam diameter measurement to characterize X-ray beam profiles in reflection geometry. Spectrochimica Acta Part B: Atomic Spectroscopy, Elsevier, 2016, 118, pp.98– 101. �10.1016/j.sab.2016.02.016�. �hal-01743053�
Fluorescence-based knife-edge beam diameter measurement to characterize
X-ray beam profiles in reflection geometry
Léna Bassel
a, Xavier Tauzin
a, Alain Queffelec
b, Catherine Ferrier
b, Delphine Lacanette
c,
Rémy Chapoulie
a, Bruno Bousquet
da IRAMAT-CRP2A, UMR CNRS 5060, Université Bordeaux Montaigne, Maison de l'Archéologie, Domaine Universitaire, Esplanade des
Antilles, 33607 Cedex Pessac, France
b PACEA, UMR CNRS 5199, Université de Bordeaux, Bâtiment B8, Allée Geoffroy Saint Hilaire, CS 50023, 33615 Cedex Pessac, France c I2M-TREFLE, UMR CNRS 5295, Université de Bordeaux, ENSCBP, Avenue Pey-Berland, 33607 Cedex Pessac, France
d CELIA, UMR CNRS 5107, Université de Bordeaux, 351 Cours de la Libération, F-33405 Cedex Talence, France
1.
Introduction
Energy-dispersive X-ray fluorescence (ED-XRF) has become a measurement technique widely applied to many fields such as medicine, environment, geology and cultural heritage [1–5]. Nowadays, both laboratory and in-field XRF apparatus are operated daily, and handheld instruments are extensively used. This is especially the case in the field of archaeometry [6,7] in which many samples have to be preserved either at the museum or on-site [8,9]. In most cases, handheld XRF spectrometers are operated by non-specialists and the characteristics of the X-ray beams are often unknown. This missing information has no consequence when the analyzed samples are homogeneous but can result in dramatic errors if the samples are heterogeneous. It should be emphasized that the characteristics of heterogeneity could be related to the diameter of the X-ray beam. Thus, when the sample is homogeneous within the beam surface area, the related XRF spectrum correctly characterizes the corresponding part of the sample. On the contrary, if the sample presents heterogeneities at the scale of the exciting X-ray beam, one single XRF spectrum may not be representative of the entire sample. Statistical tests [10] are commonly applied to evaluate the heterogeneity of a sample. However, the beam surface area has to be known in order to perform a correct sampling prior to these tests. Characterizing X-ray beam profiles has induced a lot of work for a long time as reported by Madsen (1989) with specific highlight on imaging methods dedicated to focal spot size measurements [11]. At that time, microdensitometers were also used but represented an expensive option [12]. Nowadays, one can find commercial X-ray beam profilers based on imaging [13] but they are relatively expensive for such a diagnostic and inappropriate for non-specialist end-users of the XRF technique. As an alternative, the well-known knife-edge method routinely applied to laser beam characterization has also been applied to X-ray beam diameter measurements. This technique is generally based on transmission geometry and the transmitted photon flux of the beam is measured as a function of the edge position occulting step by step the X-ray beam [14–17]. Moreover, since X-ray beams can potentially induce X-ray fluorescence, the fluorescence signal emitted by the knife-edge has also been exploited either in transmission [18–21] or in reflection geometry [22–24] in order to characterize micrometric and sub-micrometric X-ray beams. However, while X-ray beams are very well characterized by experts in this field, most of the widespread handheld systems suffer from insufficient characterization.
The aim of this paper is to demonstrate that fast and low-cost characterization of the X-ray beams provided by handheld XRF instruments can be achieved, based on the knife-edge technique coupled with X-ray fluorescence, in reflection geometry.
2. Materials and methods
In order to get the transverse profile of the X-ray beam delivered by an XRF system, we made use of the well-known knife-edge technique. Basically, it consists in occulting the beam by translating step by step a razor edge in a plane transverse to the direction of the beam propagation. Thus, it becomes possible to obtain information about the beam along the scanning axis. The signal detected in transmission and representing the power of the incident radiation as a function of the position of the razor edge can be interpreted as the convolution of the beam profile with a semi-infinite step function, related to the razor edge. The first derivative of this signal gives the beam profile and this technique is today well established. However, the underlying requirements to obtain reliable beam diameter measurements are usually insufficiently commented. These requirements are: i) large area detector in order to collect the full incoming power, ii) detector sensitive to the beam wavelength, iii) limited power range of the source in order to always detect non-saturated signals and to avoid damage to the knifeedge, iv) scanning steps of the razor edge optimized with the beam diameter to achieve adequate sampling.
When the radiation to be characterized comes from an X-ray source, a detector also sensitive to X-rays must be placed after the scanning edge. However, keeping in mind that we propose to characterize Xray beams that are delivered by handheld XRF instruments, our idea was to take advantage of all the components of the XRF system, namely the elements dedicated to beam transportation and focusing, the existence of a specific plane for the XRF analysis and the fluorescence detection setup. Thus, the idea was to scan a flat target in the plane of the regular XRF analysis, and then to record the XRF spectra for each position of the edge between the two juxtaposed materials composing the target. Taking into account the requirements mentioned above, we assume that the fluorescence signal is always proportional to the excitation, without saturation effect, and that the detector is neither saturated nor impacted by geometrical effects during the scan.
The adapted knife-edge measurement described here is built on the reflection geometry, contrary to the transmission geometry for the classical technique. Furthermore, when characterizing a laser beam in transmission, the knife-edge looks like a sharp edge between a metallic occulting razor on one side and air on the other side. In the case of reflection measurement on XRF setups, we propose to use a knife-edge made of the juxtaposition of two materials, each of them being excited by the incident X-ray beam and each of them emitting its own XRF spectrum. This target is particularly well suited to X-ray beam characterization within portable XRF systems since most of the XRF systems do not operate in the case of an absence of sample for safety reasons. Whereas no measurement could be recorded on the airside of a classical knifeedge, using a double-material target with a sharp edge ensures perfect stability of the XRF system during the scan. Two low-cost materials forming the two sides of the scanning edge, namely plastic and cardboard, were selected to support this demonstration, in order to highlight the feasibility of such measurement with very economical equipment. The choice of using two materials of the same thickness on each side of the edge was motivated by the operating mode of the XRF device under study. Indeed, the instrument was designed to adjust automatically the value
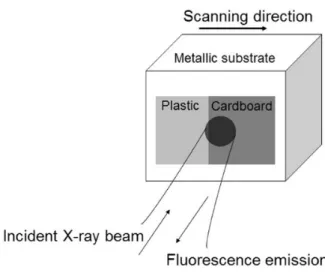
of current delivered to the excitation source to record the best signal from any target. The pieces of cardboard and plastic selected for the present demonstration were typically 1 cm square, considered as homogeneous, and it was verified that each of them excited separately induced an auto-adjustment on the XRF instrument to the maximum current value of 50 μA. Thus, no auto-adjustment of the parameters occurred during the scans. The two materials were also selected thanks to their compositions and consequently their fluorescence properties. Plastic was chosen to take advantage of the fluorescence of chlorine while this element was expected to be absent in cardboard. By scanning the edge across the X-ray beam, the two materials were excited sequentially and the choice of plastic and cardboard offered a very good contrast regarding the variation of the chlorine signal. It should be pointed out that they were not high grade materials specifically purchased for this study, but rather common materials one can use in daily life. The objective was to prepare a sharp edge with plastic on one side and cardboard on the other side of the edge. We decided to simply cut these two materials with scissors. Indeed, the X-ray beam to be characterized was expected to have a beam diameter larger than 3 mm and for this reason, slight imperfections on the edge cut with scissors were expected to have a negligible impact on the quality of the results. This basic edge preparation was sufficient in the present study because the beam diameter was quite large. Nevertheless, for smaller X-ray beam diameters, the profile measurements should be based on a high-quality edge. After being cut, plastic and cardboard were glued side by side on a piece of metal (Fig. 1) using double-sided adhesive tape. This very simple preparation was sufficient for the present purpose but could be easily optimized to enhance the quality of the edge. For example, glue spray could be used instead of double-sided tape. The metallic sample holder was composed of a manual translation stage allowing to move the sample in a plane transverse to the direction of the beam propagation. We used a 25 mm total range translation stage with 10 μm resolution, so that the sample was manually translated in the focal plane of the X-ray beam by a micrometric screw. The XRF spectra were recorded every 200 μm over a total range of 8 mm. We thus measured 41 spectra along the scanning direction.
The thickness of the materials – typically 0.5 mm – is such that some characteristic lines from the metallic holder or the adhesive tape were detected all along the scan, but since they do not interfere with those from the cardboard or the plastic, it was not considered to be a problem. When scanning the knife-edge, the XRF spectra related to each position were recorded. Since only the piece of plastic contained chlorine, we focused on the Kα line of chlorine in the XRF spectra. This line was expected to be maximum while the incident X-ray beam was directed to the piece of plastic, then was expected to diminish when the incident Xray beam hit the edge, namely partially the plastic and partially the cardboard. So, the peak of chlorine was expected to disappear when the X-ray beam hit only the cardboard. Following the intensity value of the Kα line of chlorine as a function of the edge position thus provides a simple way to characterize the X-ray beam diameter. Further processing is the same as the one classically used in the frame of the knife-edge technique, i.e. the first derivative is applied to the signal to retrieve the beam diameter. Finally, in this paper, we revisit the well-known technique of the knife-edge for direct beam diameter measurement, exploiting the fluorescence signal instead of the transmission signal of the incident beam.
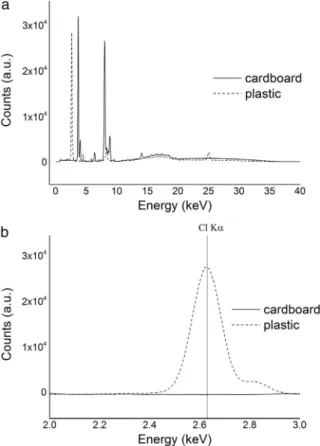
The methodology described previously has been applied to a compact, handheld and low-cost ED-XRF spectrometer (SPECTRO xSORT XHH02 from AMETEK) with horizontal beam propagation. It is equipped with a 40 kV Magnum X-ray tube from Moxtek with a tungsten target. A metallic plate covered with cardboard and plastic forming a sharp edge has been placed in the plane where the samples are usually located to be analyzed. Fig. 2.a shows the typical XRF spectra recorded by this apparatus in the range 0–40 keV, when the X-ray beam hits the plastic and the cardboard, and
integrated over 60s. Fig. 2b displays a zoom of Fig. 2a in the range of 2–3 keV and illustrates that the highest peak detected at 2.62 keV in the spectrum of the piece of plastic corresponds to the Kα line of chlorine (Cl). It also confirms the absence of chlorine inside the cardboard sample.
Fig. 1. Schematic view of the fluorescence-based knife-edge setup.
The peak intensity of this spectral line was recorded for each position of the edge during the scan and the resulting signal is displayed in Fig. 3a. It should be pointed out that in the frame of X-ray beam profile measurements, the choice of the spectral line to be monitored while scanning the edge is very important. Indeed, possible spectral interference could occur between the L-lines related to the excitation source and the K-lines related to the fluorescence of the edge. Thus, depending on the X-ray source, the materials constituting the edge should be carefully selected to avoid any risk of interference with the lines Lα and Lβ of the excitation source. In the present work, the tungsten tube of the XRF instrument has its Kα line at 59.32 keV and its Kβ line at 67.25 keV. However, other common sources in portable XRF systems are based on rhodium and silver tubes [25]. In the case of a rhodium tube, for example, the Kα line of chlorine at 2.62 keV that was analyzed to retrieve the X-ray beam profile in the present study, could interfere with the Lα line of rhodium at 2.69 keV. A non-optimized experimental setup such as rhodium for the excitation and chlorine for the fluorescence signal could involve important bias in the beam profile measurement. Consequently, users of XRF systems based on rhodium should select a fluorescence marker different from chlorine. As an example, in the present work, we also exploited the Kα line of strontium at 14.16 keV. Its fluorescence signal was decreasing while the chlorine fluorescence signal was increasing since strontium was present in the cardboard but not in the plastic. This clearly illustrates the possibility of selecting a line exempt of any risk of interference with the excitation source. The optimization of sampling was out of the scope of this demonstration and consequently not discussed. However, raw data displayed in Fig. 3a by “+” indicate that the number of points was satisfying for extracting a general conclusion from this experiment. We applied the Savitzky– Golay smoothing [26] over 25 points in order to obtain a smoothed signal easier to process as described by Qin [27]. We finally computed the first derivative, then Gaussian fit, in order to retrieve the beam profile along the horizontal axis. All the mathematical calculations were done by using the Origin Pro 9.0 software.
Fig. 2. a. XRF spectra for plastic (dashed) and cardboard (solid); b. Zoom of the spectra, highlighting the role of the Kα line of chlorine at 2.62 keV.
Fig. 3. a. Peak intensity (arbitrary units) of the Kα line of chlorine at 2.62 keV – displayed as “+”– as a function of the edge position in micrometers and smoothed curve over 25 points; b. Beam profile along the scan axis calculated as the Gaussian fit of the first derivative of the
3. Results and discussion
The result of the data analysis is shown in Fig. 3b. The reconstructed signal presented is very similar to those one can obtain from the conventional knife-edge technique.
Fig. 3b represents the beam profile along the scanning direction. Although the first derivative is fitted with a Gaussian function, this is obviously incomplete information about the X-ray beam since it doesn't reveal the two-dimensional profile of this beam nor of the real Gaussian. In order to get a full knowledge of the 2D distribution and allow the reconstruction of the 2D beam profile, one should scan the edge in the same plane along other directions. In this work, as mentioned by Qin [27], the edge was scanned along the horizontal and vertical axis, assuming that the 2D-intensity distribution was a function of two separable variables in these two directions. Finally, the diameter is defined as the Full-Width at Half Maximum (FWHM) of the signal presented in Fig. 3b [18,21,28]. We thus obtained a diameter along the horizontal scanning axis close to 3.5 mm and about 2.9 mm for the diameter along the vertical scanning axis. It is important to keep in mind that these results were obtained at the energy of 2.62 keV and after a specific data processing, therefore they could slightly differ at another energy or when using other data processing methods. These results reveal an ellipticity of about 0.17. Moreover, taking into account the geometry of the XRF system characterized in this work, the tube producing the incident X-ray beam was tilted by a 25-degree angle regarding to the normal of the plane containing the knife-edge. Consequently, even a circular beam would be characterized by an ellipticity of 0.1. The measured value of ellipticity was not far from this calculated value, revealing a quasi-circular incident X-ray beam profile. Besides, we verified that the beam diameter measurement described here was reliable by scanning the edge a second time in the opposite direction. Neglecting the time related to translating the edge, the time necessary to record all the data along one direction was equal to 40 min, each point corresponding to 1 min integration time. In addition, the spot size in the plane of analysis given by the manufacturer of the XRF system is 3.0 mm × 3.6 mm. This corresponds to an ellipticity of 0.17, which is identical to the value of 0.17 that was obtained in our experiment. Although the value of ellipticity is consistent, the values of diameter provided by the manufacturer are slightly larger than the ones obtained from our measurement. This underlines the interest of the XRF user in characterizing the X-ray beam by the simple experimental protocol described in this paper.
4. Conclusion
We have shown that the knife-edge technique commonly applied for the determination of laser beam profiles and already transposed to X-ray beams can even be easier to apply by taking advantage of the emitted fluorescence signal of the razor edge. In our case, the aim was to measure the X-ray beam exiting a handheld XRF system. Owing to the device and its collection geometry in reflection, we recorded the X-ray induced fluorescence by scanning through the beam a low-cost knife-edge target made of two distinct materials. Based on this technique, the X-ray beam diameter was found to be close to 3 mm with a slight ellipticity explained by the geometry of the instrument. The results obtained on a handheld XRF system were found to be consistent and reliable and could potentially be applied to characterize any XRF system.
Acknowledgments
This work has been supported by the Region Aquitaine in the frame of the PHYT project.
References
[1] K.H.A. Janssens, F.C.V. Adams, A. Rindby, Microscopic X-Ray Fluorescence Analysis, Wiley, Chichester, 2000,
ISBN 0-471-97426-9 (419 pp.).
[2] K. Ricketts, A. Castoldi, C. Guazzoni, C. Ozkan, C. Christodoulou, A.P. Gibson, G.J. Royle, A quantitative x-ray
detection system for gold nanoparticle tumour biomarkers, Phys. Med. Biol. 57 (17) (2012) 5543–5555.
[3] L.H. Nie, S. Sanchez, K. Newton, L. Grodzins, R.O. Cleveland, M.G. Weisskopf, In vivo quantification of lead in
bone with a portable X-ray fluorescence systemmethodology and feasibility, Phys. Med. Biol. 56 (2011) 39–51.
[4] H. Rowe, N. Hughes, K. Robinson, The quantification and application of handheld energy-dispersive X-ray
fluorescence (ED-XRF) in mudrock chemostratigraphy and geochemistry, Chem. Geol. 324-325 (2012) 122–131.
[5] M. Scuotto, C. Bassi, M. Lezzerini, E. Grifoni, S. Legnaioli, G. Lorenzetti, S. Pagnotta, V. Palleschi, X-ray
fluorescence analysis on a group of coins from the ancient roman city of Tridentum (Trento, Italy), X-Ray Spectrom. 43 (6) (2014) 370–374.
[6] I. Scharlotta, T.T. Quach, Provenance analysis of porphyritic volcanic materials in San Diego using portable X-ray
fluorescence, J. Archaeol. Sci. Rep. 3 (2015) 285–294.
[7] E. Frahm, Characterizing obsidian sources with portable XRF: accuracy, reproducibility, and field relationships in a
case study from Armenia, J. Archaeol. Sci. 49 (2014) 105–125.
[8] L. Van de Voorde, M. Vandevijvere, B. Vekemans, J. Van Pevenage, J. Caen, P. Vandenabeele, P. Van Espen, L.
Vincze, Study of a unique 16th century Antwerp majolica floor in the Rameyenhof castle's chapel by means of X-ray fluorescence and portable Raman analytical instrumentation, Spectrochim. Acta B At. Spectrosc. 102 (2014) 28– 35.
[9] L. Dayet, F. d'Errico, R. Garcia-Moreno, Searching for consistencies in Châtelperronian pigment use, J. Archaeol.
Sci. 44 (2014) 180–193.
[10] T. Trejos, J.R. Almirall, Sampling strategies for the analysis of glass fragments by LAICP-MS Part I.
Micro-homogeneity study of glass and its application to the interpretation of forensic evidence, Talanta 67 (2) (2005) 388– 395.
[11] J.U. Madsen, Focal spot size measurements for microfocus X-ray sets, NDT Int. 22 (1989) 292–296.
[12] A.B. Doyum, E. Nabel, A practical and convenient method for the measurement of focal spots of industrial X-ray
tubes, NDT&E Int. 24 (1991) 145–149.
[13] Logos Systems International, http://www.logosvisionsystem.com/index.html2015 (Last access date 01/02/2016). [14] N. Gao, K. Janssens, in: K. Tsuji, J. Injuk, R. Van Grieken (Eds.), X-Ray Spectrometry: Recent Technological
[15] S. Yuan, V.V. Yashchuk, K.A. Goldberg, R. Celestre, W.R. McKinney, G.Y. Morrison, T. Warwick, H.A. Padmore,
Development of in situ, at-wavelength metrology for soft X-ray nano-focusing, Nucl. Inst. Methods Phys. Res. A 649 (1) (2011) 160–162.
[16] R. Unterumsberger, M. Müller, B. Beckhoff, P. Hönicke, B. Pollakowski, S. Bjeoumikhova, Focusing of soft X-ray
radiation and characterization of the beam profile enabling X-ray emission spectrometry at nanolayered specimens, Spectrochim. Acta B At. Spectrosc. 78 (2012) 37–41.
[17] M.K. Tiwari, P. Gupta, A.K. Sinha, S.R. Kane, A.K. Singh, S.R. Garg, C.K. Garg, G.S. Lodha, S.K. Deb, A
microfocus X-ray fluorescence beamline at Indus-2 synchrotron radiation facility, J. Synchrotron Radiat. 20 (Pt 2) (2013) 386–389.
[18] C.G. Schroer, O. Kurapova, J. Patommel, P. Boye, J. Feldkamp, B. Lengeler, M. Burghammer, C. Riekel, L. Vincze,
A. van der Hart, M. Küchler, Hard X-ray nanoprobe based on refractive X-ray lenses, Appl. Phys. Lett. 87 (12) (2005) 124103.
[19] S.D. Shastri, J.M. Maser, B. Lai, J. Tys, Microfocusing of 50 keV undulator radiation with two stacked zone plate,
Opt. Commun. 197 (1–3) (2001) 9–14.
[20] N. Gao, I.Y. Ponomarev, Polycapillary X-ray optics: manufacturing status characterization and the future of the
technology, X-Ray Spectrom. 32 (2002) 186–194.
[21] K. Ploykrachang, H. Fukuda, K. Kondo, Y. Oguri, J. Hasegawa, Production of quasimonochromatic X-ray
microbeams using MeV-protons and a polycapillary X-ray half lens, Int. J. PIXE 23 (01n02) (2013) 1–11.
[22] R. Sitko, B. Zawisza, E. Malicka, Energy-dispersive X-ray fluorescence spectrometer for analysis of conventional
and micro-samples: preliminary assessment, Spectrochim. Acta B At. Spectrosc. 64 (5) (2009) 436–441.
[23] A. Yilmazbayhan, O. Delaire, A.T. Motta, R.C. Birtcher, J.M. Maser, B. Lai, Determination of the alloying content
in the matrix of Zr alloys using synchrotron radiation microprobe X-ray fluorescence, J. Nucl. Mater. 321 (2–3) (2003) 221–232.
[24] G. Buzanich, P. Wobrauschek, C. Streli, A. Markowicz, D. Wegrzynek, E. Chinea-Cano, S. Bamford, A portable
micro-X-ray fluorescence spectrometer with polycapillary optics and vacuum chamber for archaeometric and other applications, Spectrochim. Acta B At. Spectrosc. 62 (11) (2007) 1252–1256.
[25] M.S. Shackley, An introduction to ray fluorescence (XRF) analysis in archaeology, in: M.S. Shackley (Ed.),
X-Ray Fluorescence Spectrometry (XRF) in Geoarchaeology, Springer 2011, pp. 7–44.
[26] A. Savitzky, M.J.E. Golay, Smoothing and differentiation of data by simplified leastsquares procedures, Anal. Chem.
36 (8) (1964) 1627–1639.
[27] Y. Qin, T. Nakajima, H. Zen, X. Wang, T. Kii, H. Ohgaki, Characterization of nonGaussian mid-infrared
free-electron laser beams by the knife-edge method, Infrared Phys. Technol. 66 (2014) 146–151.
[28] M. Haschke, Laboratory Micro-X-ray Fluorescence Spectroscopy, Springer, 2014, ISBN 978-3-319-04863-5 (356