HAL Id: halshs-00586290
https://halshs.archives-ouvertes.fr/halshs-00586290
Preprint submitted on 15 Apr 2011
HAL is a multi-disciplinary open access
archive for the deposit and dissemination of sci-entific research documents, whether they are pub-lished or not. The documents may come from teaching and research institutions in France or abroad, or from public or private research centers.
L’archive ouverte pluridisciplinaire HAL, est destinée au dépôt et à la diffusion de documents scientifiques de niveau recherche, publiés ou non, émanant des établissements d’enseignement et de recherche français ou étrangers, des laboratoires publics ou privés.
Optimal taxation, social contract and the four worlds of
welfare capitalism
Amadéo Spadaro
To cite this version:
Amadéo Spadaro. Optimal taxation, social contract and the four worlds of welfare capitalism. 2008. �halshs-00586290�
WORKING PAPER N° 2008 - 38
Optimal taxation, social contract and the four
worlds of welfare capitalism
Amedeo Spadaro
JEL Codes: H11, H21, D63, C63
Keywords: Optimal income taxation, tax-benefit policy, microsimulation, comparative social policy analysis, welfare state models
P
ARIS-
JOURDANS
CIENCESE
CONOMIQUESL
ABORATOIRE D’E
CONOMIEA
PPLIQUÉE-
INRA48,BD JOURDAN –E.N.S.–75014PARIS TÉL. :33(0)143136300 – FAX :33(0)143136310
www.pse.ens.fr
CENTRE NATIONAL DE LA RECHERCHE SCIENTIFIQUE –ÉCOLE DES HAUTES ÉTUDES EN SCIENCES SOCIALES
Optimal taxation, social contract and the four
worlds of welfare capitalism
Amedeo Spadaro
∗•∗Paris School of Economics, Paris
•Universitat de les Illes Balears, Palma de Mallorca
Abstract1
Drawing from the formal setting of the optimal tax theory (Mirrlees 1971), the paper identifies the level of Rawlsianism of some European social planners starting from the observation of real data and redistribution systems and uses it to build a metric that allows measuring the degree of (dis)similarity of the redistribution systems analyzed. It must be considered as a contribution to the comparative research on the structure and typology of the Welfare State. In particular we consider the optimal taxation model that combines both intensive and extensive margins of labor supply, as suggested by Saez (2002) in order to assess the degree of decommodification of seven European welfare systems. We recover the shape of the social welfare function implicit in tax-benefit systems by inverting the model on actual effective tax rates, as if existing systems were optimal according to some Mirrleesian social planner. Actual distributions of incomes before and after redistribution are obtained using a pan-European tax-benefit microsimulation model. Results are discussed in the light of standard classifications of welfare regimes in Europe. There appears to be a clear coincidence of high decommodification willingness and high Rawlsianism in the Scandinavian,
social-democratically influenced welfare states (Denmark). There is an equally clear coincidence of
low decommodification willingness and utilitarianism in the Anglo–Saxon liberal model (UK) and in the Southern European welfare states (Italy and Spain). Finally, the Continental
European countries (Finland, Germany and France) group closely together in the middle of
the scale, as corporatist and etatist.
Key Words: Optimal income taxation, tax-benefit policy, microsimulation, comparative social
policy analysis, welfare state models.
JEL Classification: H11, H21, D63, C63
1
I express my gratitude to Olivier Bargain for providing me with the EUROMOD simulations. I am also grateful to Luc Arrondel, François Bourguignon, Andrea Brandolini, Luciano Canova, Janet Gornick, André Masson and seminar participants in Madrid (IEF), Catania, Copenhagen, Lecce, Roma and Paris. I want to acknowledge financial support of Spanish Government (SEJ2005-08783-C04-03/ECON) and of French Government (ANR BLAN06-2_139446). I am also grateful to all past and current members of the EUROMOD consortium as well as to those involved in the development of the model. Any remaining errors, results produced, interpretations or views presented are the author's responsibility. Simulations performed in this study rely on national micro-data sets and on the European Community Household Panel (ECHP) for Denmark and Spain; the Income Distribution Survey is made available by Statistics Finland; the public use version of the German Socio Economic Panel Study is made available by the DIW, Berlin; the French Household Budget Survey is made available by INSEE, Paris; the Survey of Household Income and Wealth is made available by the Bank of Italy; the Family Expenditure Survey (FES) is made available by the UK Office for National Statistics (ONS) through the Data Archive. Material from the FES is Crown Copyright and is used by permission. Neither the ONS nor the Data Archive bear any responsibility for the analysis or interpretation of the data reported here. An equivalent disclaimer applies for all other data sources and their respective providers cited in this acknowledgement. Correspondence to: Amedeo Spadaro, Paris School of Economics, 48 bd Jourdan, 75014 Paris. Email: spadaro@pse.ens.fr
1 Introduction
This paper contributes to the debate regarding the typology of welfare states by offering a formal theorizing drawing from the optimal taxation literature (Mirrlees 1971) and allowing for comparative research on the structure of the Welfare State taking explicitly into account the efficiency concerns of the redistribution policies.
A few years after his publication, the book of Esping Andersen (EA) (1990) “Three Worlds of
Welfare Capitalism” becomes a modern classic and a reference for any researcher interested
in the study of the welfare state (Offe, 1991; Cnaan, 1992; Hicks, 1991; Kohl, 1993). The main reason of this success was that, for a long time in both the theoretical and empirical literature, too little attention had been given to cross-national differences in welfare state structures; the book was a clear contribution towards filling this gap2. In his ‘seminal’ book EA constructs today’s most frequently used typology of welfare states, and tests empirically whether distinct welfare states that resemble his ideal-types can be observed.
In this literature (see Pestieau 2006), welfare regimes are seen as a complex set of legal and organizational features that are systematically interwoven. They are clustered around highly diverse regime-types, each organized according to its own logic of organization, stratification, and societal integration.
Four closely paralleled models – ideal-types – of regime-types are commonly referred to. Each of them is classified along several criteria including the degree of defamiliarization (i.e. the degree to which the market and/or the state play a role in providing services to individuals that were traditionally provided by the family), the level of social stratification promoted by social policies and (most important for our purposes) the degree of decommodification, i.e. the degree to which a (social) service is rendered (by the state) as a matter of right, or, alternatively, the degree to which a person can maintain a livelihood without reliance on the (labor) market3.
First, there is the liberal type of welfare capitalism, which embodies individualism and the primacy of the market. The operation of the market is encouraged by the state, either actively – subsidizing private welfare schemes – or passively by keeping (often means tested) social benefits to a modest level for the demonstrably needy. This welfare regime is characterized by a low level of decommodification. The operation of the liberal principle of stratification leads to division in the population: on the one hand, a minority of low-income state dependants and, on the other hand, a majority of people able to afford private social insurance plans. In this type of welfare state, women are encouraged to participate in the labor force, particularly in the service sector.
Second, there is the social-democratic world of welfare capitalism. Here, the level of decommodification is high, and the social-democratic principle of stratification is directed towards achieving a system of generous universal and highly distributive benefits not dependent on any individual contributions. In contrast to the liberal type of welfare states, ‘this model crowds out the market and, consequently, constructs an essentially universal solidarity in favor of the welfare state’ (Esping-Andersen, 1990: 28). Social policy within this type of welfare state is aimed at a maximization of capacities for individual independence. Women in particular – regardless of whether they have children or not – are encouraged to participate in the labor market, especially in the public sector.
Third, there is a world of conservative corporatist welfare states, which is typified by a moderate level of decommodification. This regime type is shaped by the twin historical
2
Theoretically, the work of Polanyi (1944), Marshall (1950; 1963; 1965; 1981) and Titmuss (1958; 1974) laid the foundations for Esping-Andersen’s typology (Boje, 1996). Empirically, some comparative research has been conducted, among others, by Wilensky (1975), Flora and Heidenheimer (1981), Mommsen (1981) and Flora (1983; 1986).
3
This definition of decommodification has been elaborated by EA on a previous similar concept of Karl Polanyi (1944).
legacy of Catholic social policy, on the one side, and corporatism and etatism on the other side. This blend had some important consequences in terms of stratification. Labor market participation of married women is strongly discouraged, because corporatist regimes – influenced by the Church – are committed to the preservation of traditional family structures. Another important characteristic of the conservative regime type is the principle of subsidiarity: the state will only interfere when the family’s capacity to service its members is exhausted (Esping-Andersen, 1990: 27).
Fourth, there is the Southern European model of social policy (Katrougalos, 1996, Leibfried, 1992; Ferrera, 1996; Bonoli, 1997; Trifiletti, 1999). This class of social protection systems is highly fragmented and, although there is no articulated set of minimum social protection, some benefits levels are very generous (such as old age pensions). Moreover, in these countries health care is institutionalized as a right of citizenship. However, in general, there is relatively little state intervention in the welfare sphere (a low level of decommodification). Another important feature is the high level of particularism with regards to cash benefits and financing, expressed in high levels of clientelism (Ferrera 1996).
This “standard” classification4 received various types of responses and constructive critiques. Amicable critics argue that his typology has merits but is neither exhaustive nor exclusive and therefore needs revising. Others refer to theoretical and methodological shortcomings (Lessenich and Ostner, 1998). The more hostile critics feel that typologies as such have no explanatory power and, therefore, that his scheme does not contribute to proper theorizing about what is happening across and within welfare states (Baldwin, 1996).
In their excellent survey about the debate regarding the typology of welfare states, Arts and Gelissen (2002) reconstruct several typologies of welfare states in order to establish, first, whether real welfare states are quite similar to others or whether they are rather unique specimens, and, second, whether there are three ideal-typical worlds of welfare capitalism or more. They conclude that “real welfare states are hardly ever pure types and are usually
hybrid cases; and that the issue of ideal-typical welfare states cannot be satisfactorily answered given the lack of formal theorizing and the still inconclusive outcomes of comparative research. In spite of this conclusion there is plenty of reasons to continue to work on and with the original or modified typologies”.
The Arts and Gelissen’ conclusions served as inspiration and motivation of the work we report in this paper.
In what follows, we offer a formal theorizing which draws from the last empirical developments of the theory of optimal taxation and, through this new framework, contribute to this important debate.
Optimal taxation has been developed in economics in order to analyze the equity/efficiency trade off that a social planner faces when designing one of the pillars of the welfare state: the direct redistribution system (i.e. the function that transform individual gross income in disposable income). This pillar is, in our view, particularly related to the degree of decommodification achieved by a welfare regime.
We claim that a redistribution system allowing for a high level of subsidies directed to non working people implies a high level of decommodification. This claim has an immediate consequence: it implies that there is a strong analogy between a social planner aiming to
“decommodificate” individuals and the degree of Rawlsianism of the social planner in an optimal tax model. In his task of determining the best redistribution policy, this Rawlsian
social planner will guarantee a high level of subsidies directed to the poorest (normally non working agent) by charging the financial cost to the richest. Of course, this social planner will account for the negative efficiency effects of taxation and also for the initial distribution of the
4
For a complete list see the survey about the debate regarding Esping-Andersen’s typology of welfare states of Arts and Gelissen (2002).
economic and socio-demographic characteristics in the population. Assessing the degree of Rawlsianism of a redistribution system implies assessing his degree of willingness to decommodify citizens and vice versa.
What we propose here is to use the formal setting of the optimal tax theory to identify the level of Rawlsianism of some European social planners starting from the observation of the real data and redistribution systems. The results are used to build a metrics that allows us to measure the (dis)similarity of the systems analyzed. The proposed setting can be also seen as a test of the standard classification.
To our knowledge, this is the first attempt in that direction. The literature on optimal taxation has remained mostly theoretical for a long time following the seminal contributions of Mirrlees (1971). The main reason was the absence of reliable information on the `true' distribution of individual abilities. In recent years, the use of micro data has allowed implementing optimal tax models, under some assumptions about social preferences, in order to question the optimality of actual tax-benefit systems. Notably, the U-shaped distribution of effective marginal tax rates, often encountered in industrialized countries, has been investigated by several authors (Diamond, 1998, Saez, 2001, for the US, Piketty, 1997, Bourguignon and Spadaro, 2000, Choné and Laroque, 2005, for France, among others). Of particular interest were the conditions under which confiscatory levels of implicit taxation could be justified at the bottom of the distribution, or, inversely, how new programs of income maintenance could be grounded on the basis of optimal tax formulas.
A key element in such empirical applications of optimal tax models is the shape of social preferences. The curvature of the social welfare function in a continuous model à la Mirrless translates the social aversion to inequality. When the population is discretized, as in Saez (2002), it simply corresponds to the pattern of relative weights on different income groups. Given a country's set of characteristics (labor supply elasticity, distribution of household income, etc.), it is possible, in principle, to derive optimal tax schedules for different assumptions about social aversion to inequality and to identify the level for which optimal and actual tax rates coincide. This way, Laroque (2005) shows that an optimal schedule derived from rawlsian preferences is close to the actual schedule in France and concludes about the relatively rawlsian nature of social preferences in this country5. Interestingly, it is possible to follow a somewhat dual approach and to focus on social preferences as the subject of investigation6. Instead of producing optimal tax schedules under certain assumptions on social preferences, the optimal tax model can be inverted on actual effective tax rates to recover the implicit social welfare function that makes the observed system optimal7. This approach was
5
Similar conclusions are obtained by Spadaro (2005). Simulating the French and British tax-benefit systems on French data, he shows that the former system generates a higher level of social welfare for non-utilitarian values of the inequality aversion parameter, which conveys the idea that the concern for redistribution may be larger in France, or, alternatively, that labor supply elasticities are lower in this country.
6
The term "social preference" covers different concepts, often linked but studied independently by different branches of the economic literature. In political economy, some surveys attempt to directly measure people's attitude towards inequality, as in e.g. the International Social Survey Program, used for instance in Corneo and Grüner (2002) and Osberg and Smeeding (2005). In behavioral economics, experiments are often used to assess preferences of a group. With the well-known `leaky bucket' experiment, respondents are able to transfer money from a rich individual to a poor one but incur a loss of money in the process, so that the equity-efficiency trade-off is taken into account in measuring tastes for redistribution (see for instance Amiel et al., 1999); in recent experiments, participants vote for alternative tax structures (e.g. Ackert et al., 2007). In the public economic literature, implicit value judgments may be drawn from inequality measures, assuming a natural rate of subjective inequality as suggested by Lambert et al. (2003); see also Duclos (2000).
7
The effective marginal tax rate corresponds to the implicit tax on a marginal increment of income, which accounts for the payment of income taxes and social contribution but also for the withdrawal of means-tested benefits as earnings increase.
suggested by Bourguignon and Spadaro (2000, 2005, and 2008) using Mirrlees (1971) optimal tax model and applied on UK, Spanish and French data8.
In the present paper we retrieve the implicit social welfare functions by inverting Saez' model on national micro data of seven European countries9 (Table 0 informs about the countries analyzed as well as their position in the standard classification). For each country, the population is partitioned in several income groups and the inverse optimal tax model is implemented using actual effective average and marginal tax rates in order to retrieve social weights placed on the different groups.
This approach provides an original way of comparing social preferences across countries. Indeed, comparing social assistance expenditures or tax levels across countries does not provide a correct rendering of the tastes for redistribution, since the overall redistributive effect is not assessed jointly with the efficiency constraint (potential labor supply responses). The present approach precisely accounts for incentive constraints and allows reading standard information about redistributive systems directly in terms of social weights.
Looking at the results, there appears to be a clear coincidence of high willingness to decommodify and high Rawlsianism in the Scandinavian, social-democratically influenced welfare states (Denmark). There is an equally clear coincidence of low willingness and utilitarianism in the Anglo–Saxon liberal model (UK) and in the Southern European welfare states (Italy and Spain). Finally, the Continental European countries (Finland, Germany and France) group closely together in the middle of the scale, as corporatist and etatist.
Of course, from the beginning of the exposition we want to make clear to the reader that the ambition of our analysis is very limited: first, we do not pretend to assess the social preferences embedded in the design of the whole social protection system and even less in the welfare state. Income taxes and benefits are only a very small part of it. In this sense, our contributions should be considered as a first attempt to offer a consistent way to compare social preferences across countries with different welfare regimes and possibly different efficiency constraints.
Second, in what follows we will focus on the dichotomy state vs market. In our analysis, the family dimension is completely missing. This is an important shortcoming given that the role of the family, and in particular, the substitutability between state and families in providing protection against decommodification risks, is one of the pillars of the modern debate on the structure of the welfare state.
The previous shortcomings are important and should be kept in mind when reading the paper; nevertheless, our contribution must be seen as a step towards the construction of formal theorizing allowing for better understanding the nature of welfare system and, eventually, to better define (if possible) ideal-typical models starting from the analysis of real welfare state. The layout of the paper is as follows. Section 2 presents the national tax-benefit systems and a first look at their effects on redistribution and incentives. Section 3 describes the model and the inversion procedure. Section 4 presents the data and discusses the implementation of the model, drawing on previous results on labor supply elasticities. Empirical results are reported in Section 5: we derive the social weights that make European tax-benefit systems optimal, and we compare results to qualitative analyses of European welfare regime. Section 6 concludes.
8
A well-known limitation of Mirrlees' model is the difficulty to consider non marginal changes in labor supply characterizing potential workers switching from non activity to activity or vice versa (the so called participation effects) and it may be preferable to adopt the optimal tax model suggested by Saez (2002), which allows incorporating labor supply responses at both the intensive and the extensive margin. See Bourguignon and Spadaro (2008) for technical details.
9
A similar exercise, focusing on single mothers, is conducted by Blundell et al. (2006) for a comparison between Germany and the UK.
2 National Tax-Benefit Systems: Structure, Equity and Efficiency
2.1 Brief Overview of National Systems
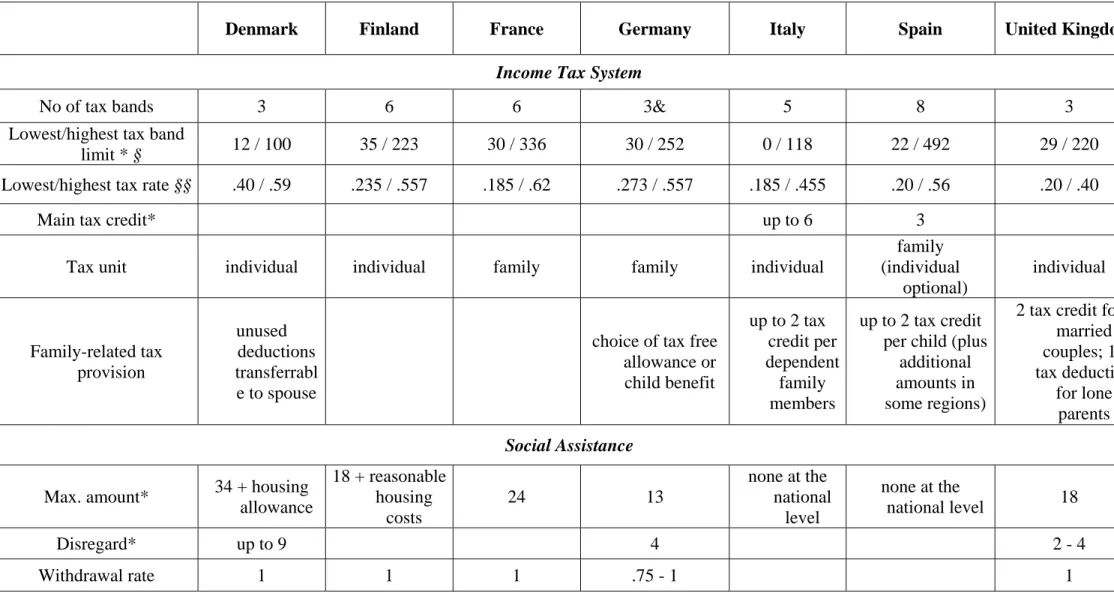
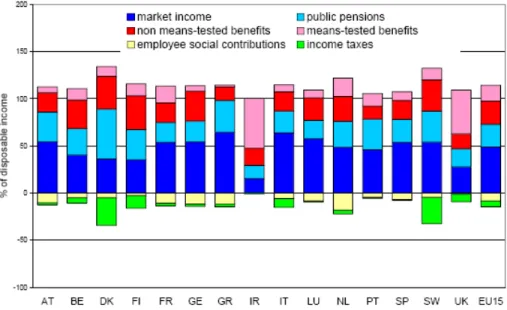
We focus here on direct taxes, contributions and transfers affecting the disposable income of households in Europe10. An overview of the 1998 systems for countries under investigation in this paper is provided in Table 1. It is accompanied by Figure 1 which reports the share of market income, taxes, benefits and replacement incomes, as a proportion of disposable income, on average and for bottom and top quintiles.
Benefits provide financial support to various groups and have different underlying policy objectives. Means-tested benefits correspond primarily to social transfers, i.e. social assistance and housing benefits, and clearly aim to alleviate poverty. Figure 1 shows that those are indeed well targeted to the poorest. However, minimum income schemes are often held responsible for work disincentives as withdrawal are high, most often imposing a 100% tapering which discourages participation of low-wage workers. This is especially the case in countries with generous income support levels (e.g. Nordic countries, France, Germany), characterized by high marginal effective tax rates for lower income groups11.
Southern countries are characterized by the absence of minimum income schemes, and families are regular substitutes to the state in supporting unemployed or low-income workers. Housing benefits sometimes play an important role in complementing social assistance to support low-income families (e.g. in France and, to a lesser extent, in Finland), but are less subject to high withdrawal rates.
Non means-tested benefits have other objectives than pure redistribution, related for instance to demographic or employment motives (e.g. child benefits, childcare subsidies). They are consequently less targeted to the poor, as illustrated in Figure 1. They rather target specific groups such as families with children, disabled individuals (invalidity pensions), and people temporarily out of work (maternity and family pensions) or involuntarily out of work (unemployment benefits). Child benefit is often universal, even though some components may be means-tested (e.g. in France, Germany or Spain). Non means-tested benefits include contributory benefits, such as unemployment benefits. The importance of unemployment benefits in total expenditures explains the prevailing role of the non means-tested benefit category in Figure 1. This is especially true in countries where means-tested benefits are limited (e.g. Spain). The inverse is true in the UK, where income support and in-work transfers play an important role compared to unemployment insurance; social expenditures then appear much more targeted in this country.
Taxes display a progressive tax rate structure, with tax allowance (e.g. in Germany and Finland) or tax free brackets (e.g. in France) to exempt lowest incomes from tax. These exemptions may be important. For instance, in France in 1998, all households are subject to the 8% social security flat-rate tax but only half of the population is subject to the progressive income taxation. The redistributive effect of the income tax scheme is function of the tax level and the progressivity of the tax schedule. Couples are jointly (income) taxed in France and Germany, causing high marginal tax rates on secondary earners.
Social security contributions (SSC) (not reported in table 1) are levied on earnings and sometimes on benefits. Often shared between employers and employees, they are generally designed as a flat-rate structure aimed to finance pensions, health and unemployment insurance. They are not neutral, however, as zero payments below a threshold and a cap on
10
Indirect taxes are an important source of public spending financing. Their proportional (to consumption) character jointly with the existence of a very small number of different rates, gives them a marginal weight as redistributive device. This is the reason why we decided to skip them from the following analysis. For a detailed discussion on indirect taxes, notably VAT and excise taxes on specific goods, see Immervoll et al. (2005).
11
Social assistance (minimum income or minimum pension) is often more generous for certain groups such as single parent families (e.g. in France) or pensioners (e.g. in Finland).
the contribution base above an upper limit generate some discontinuities and necessarily have distributive effects. SSC are substantial - sometimes exceeding income tax rates - especially in countries with large public pensions and health insurance systems. This is for instance the case for Germany and France, as shown in Figure 1.
2.2 Redistributive and Incentive Effects
European systems provide a rich ground to implement the optimal tax framework and the inverse approach used in this paper. Firstly, a substantial redistributive system exists even for single individuals in several European systems, which we can exploit for vertical equity analysis. The variety of transfers is larger when looking at families (or, more generally, to other demographic groups than working age single individuals), and potentially allows interpreting social preferences for both vertical and horizontal equity.
Secondly, we can exploit differences across countries to analyze significant divergences in social preferences, from a system without social assistance (Spain) to one with highly generous income support (Denmark).
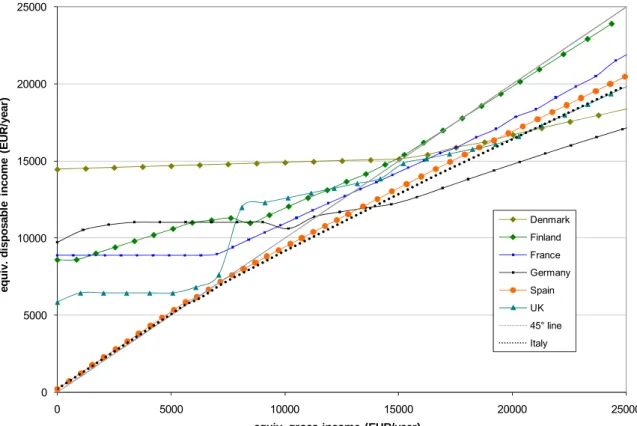
Budget constraints for hypothetical single individuals, as represented in Figure 2, provide early intuitions and show nuances across countries. Within the Nordic group, both Denmark and Finland are characterized by generous social assistance but the marginal tax rates are higher in the former country and Denmark seems more similar to Germany on both accounts. All countries with minimum income schemes (all except southern countries) are characterized by a relatively flat budget constraint at low income level, due to the high taper rates responsible for very high effective marginal tax rates, as previously noticed. Despite very different systems, the combination of the different tax-benefit instruments in France and the UK lead to very similar budget constraints in the two countries, a fact already noticed by Atkinson, Chiappori and Bourguignon (1988).
Naturally, the effect of national systems can only be partially rendered trough the use of a representative agent. A more comprehensive characterization of the redistributive and incentive effects requires applying national systems to representative datasets, as it is done here by using the EUROMOD pan-European tax-benefit simulator and national micro data (see description in the following sections). On the redistributive side, the redistributive effect of the different instruments could be analyzed and decomposed12.
We assess the overall redistributive effect of benefits and taxes, using Gini coefficient as a summary of total inequality. Figure 3 reports the decrease in the Gini coefficient on market income due to benefits, public pensions and unemployment benefits13.
There is a clear contrast between Nordic and Corporatist regimes on the one hand, with large redistributive effects due to both contributory and non-contributory benefits, and Southern countries plus the UK on the other hand14.
Smaller effects in this second group are due to small social benefits in Spain and Italy and small replacement income in the UK. Figure 3 also reports the decrease in the Gini coefficient on market income due to the whole set of tax-benefit instruments, i.e. previously mentioned benefits plus taxes and social security contributions. This corresponds simply to the move from the Gini on market incomes to the Gini on disposable incomes. The same contrast between the two groups of countries remains after inclusion of income tax and social contributions. As expected, there are cross-country differences in the relative role of the two
12
For instance, Wagstaff et al. (1999) carefully decompose the redistributive effect of income taxation into tax levels and progressivity effects for several OECD countries. Important differences across countries emerge, showing for instance high (low) average tax but lower (higher) progressivity in Nordic countries (France).
13
Market income corresponds to wage salary, self employment income, capital income, alimony and other private transfers.
14
In the first group of countries, benefits achieve the most inequality reduction mainly due to contributory benefits and public pensions; means-testing plays a small role (see Immervoll et al., 2007).
groups of instruments. In particular, benefits and replacement incomes achieve more redistribution in France (reduction in the market income Gini of 37%, versus 35% in Denmark) while the overall redistributive effect is largest in Denmark (49% versus 46% in France) because of the relatively larger effect of taxes in this country.
We now turn to the effects of tax-benefit systems on work incentives. We characterize these effects using effective marginal tax rates (EMTR), i.e. the implicit taxation (reduction in disposable income) of an additional Euro of market income. Thus the distribution of average EMTR per deciles, reported in Figure 4, gives some insight on the (dis)incentive potential of tax-benefit systems15. The shape of these patterns has been discussed in several studies (see Bourguignon, 1997, and Immervoll et al., 2006, among others). We group EMTR distributions according to the following classification: Social Democratic (Denmark), Corporativist (Finland, France and Germany), Liberal (UK) and Southern European (Italy and Spain). As expected, the overall tax level if highest in Nordic countries. EMTR are high for lower deciles in all countries with means-tested social assistance, due to aforementioned phasing out at high taper rate. Institutional disincentives to work must be combined with participation elasticities, which capture other country-specific aspects (e.g. costs of work), to explain outcomes in terms of participation. Figure 5 reports employment rates for the selected countries. It appears that male participation is high in all countries and relatively less sensitive to tax-benefit incentives than female labor supply. For the latter, participation is very high in Nordic countries despite large EMTRs, which is partly explained by other institutional features, in particular a set of pro-family policies which decrease cost of work for women and encourage female activity. Participation is lower in France and Germany, a fact often explained by the combination of less pro-family policies, social norms (in Germany) and high taxation on secondary earners due to joint taxation. Female employment is even lower in Southern countries, despite lower tax rates, and explanations are to be found in different family arrangements and lower female wages. While average tax rates are smaller than EMTRs for low incomes, they are getting closer as income increases. For high incomes, then, both effective marginal and average tax rates are high in Nordic countries and could generate disincentives at the intensive margin; the same is true in France or Germany for the very top of the distribution (not visible in the average for the last decile).
3 The Inverse Optimal Tax Approach
3.1 The Model of Saez (2002)
The starting point of Saez (2002) is the standard optimal income tax model à la Mirrlees (1971). The government is assumed to maximize a social welfare function subject to an aggregate budget constraint. The social welfare function aggregates individual utility levels, which themselves depend on disposable household income (equivalent to consumption in a static framework) and leisure. The form of the social welfare function characterizes the government's taste for redistribution, ranging from rawlsian preferences (maximization of the welfare of the poorest person) to utilitarian preferences (equal weights on all individuals). Actual productivities are not observed so that governments can only rely on second-best taxation based on incomes. Consequently, they must account for the efficiency constraint: agents modify their taxable income in function of effective taxation. Responses operate both at the extensive margin (participation decisions) and the intensive margin (effort or hours of
15
EMTR are computed numerically by incrementing marginally the labor income of the main earner in the household. Clearly, more accurate characterization of the participation incentives should rely on replacement rate, or financial gains to work, or participation tax (Immervoll 2002). These three concepts are somewhat equivalent and reflect the differential between standards of living when inactive (on welfare) and in work. EMTR give some indications but do not give the full picture of such (non-marginal) transitions.
work). In particular, high implicit taxes on the most (least) productive ones may reduce their effort (participation), thereby reducing the tax base16.
Only the intensive margin is considered in the original model of Mirrlees (1971), while empirical evidence points towards an important effect of participation decisions (see Heckman, 1993).
Saez (2002) sets up an optimal tax problem where there are I+1 discrete groups in the labor market: I groups of individuals who do work, ranked by increasing gross income levels Yi
indexed i=1,...I, and a group consisting of those who do not work (group i=0).
Individuals choose whether or not to participate (extensive margin) and which group to choose (intensive margin). Formally, individuals are indexed by m ∈ M being a set of measure one. The measure of individuals on M is denoted by dv(m). Individual m ∈ M has a utility function um(Ci,i) defined on after-tax income Ci ≥ 0 and job choice i = 0, . . . , I. Each
individual chooses i to maximize um(Ci,i), where Ci = Yi - Ti is the after-tax reward in
occupation i. The labour supply decision of individual m is denoted by i*∈{0, 1, . . . , I}. For a given tax and transfer schedule (C0, . . . , CI), the set M is partitioned into I +1 subsets, M0, . . . , MI, defining the sets of individuals choosing, respectively, each of the occupations 0, . . . , I. The fraction of individuals choosing occupation i, denoted by hi(C0, . . . , CI) is simply the
measure of set Mi. It is assumed that the tastes for work embodied in the individual utilities
are regularly distributed so that the aggregate functions hi are differentiable17.
The government chooses (T0, . . . , TI) so as to maximize welfare:
) ( ) , ( * * * T i dv m Y u W M i i m m
∫
− = μsubject to the budget constraint
∑
≥ = Φ I j j jT h 0 (b.c.)where μm is the weight the government assigns to agent m. Φ is the exogenous government
financial constraint.
In this framework, the optimal set of Ti is determined by a system of I+1 first order conditions
of the following form (see Saez, 2002, for a formal derivation):
∑
≥ − − ⎥ ⎥ ⎦ ⎤ ⎢ ⎢ ⎣ ⎡ − − − − = − − I i j j j j j j i i i i i i C C T T g h h C C T T 0 0 1 1 1 1 ης for i=1,...I, (1a)
jointly with the constraint (b.c.)
The term on the left-hand side of (1a) is the extra tax paid when moving from group i-1 to i divided by the gain in net income. Non-workers receive benefits -T0, by definition identical to C0. The social welfare function is summarized by gi, the marginal weight the government
assigns to group i. This weight represents the value (expressed in terms of public funds) of giving an additional euro to an individual in group i. It is defined as follows:
i M i i m m i ph m dv C i C u g i ) ( ) , ( * *
∫
∂ ∂ = μ (1b) 16At the top of the skill distribution, high implicit tax rates are due to high marginal income tax rates. At the bottom, they are caused by high withdrawal (phase-out) rates of means-tested social assistance schemes.
17
Note that optimal income schedules must verify the property of agent monotonicity, according to which gross income increases with productivity (which is not necessarily the case of labor supply, as the labor supply curve may be backward bending). This is sometimes expressed as the Spence-Mirrlees (or single crossing) condition that a more productive agent will choose a higher consumption-income allocation, so that second best taxation manages to separate types and guarantees incentive-compatibility. Here, the implicit assumption is that types 0 to
Where p is the multiplier of the government budget constraint. An alternative interpretation of
gi is that the government is indifferent between giving one more Euro to an individual in
occupation i and gi more Euros of public funds.
The intensive elasticity, ςi, is defined as:
)
(
1 1 − −−
−
=
i i i i i i iC
C
d
dh
h
C
C
ς
(2)This mobility elasticity captures the percentage increase in supply of group i when Ci-Ci-1 is
increased by 1%, and is defined under the assumption that individuals are restricted to adjust their labor supply to the neighboring choice18.
Finally, ηi is a measure of the extensive elasticity, and is defined as the percentage of
individuals in group i who stops working when the difference between the net household income out of work and at earnings point i is reduced by 1%:
) ( 0 0 C C d dh h C C i i i i i − − = η (3)
The main implication of the optimal tax rule above is that the optimal tax system depends heavily on whether labor supply responses are concentrated at the intensive or extensive margin. When the extensive elasticity is assumed to be zero, the model of Saez is a discrete version of that of Mirrlees and gives identical results. It can be demonstrated (Saez 2002) that, in the case where income effects are ruled out, hi(C0+R, . . . , CI +R) = hi(C0, . . . , CI).
Thus,
∑
=∂
=
∂
I j i jc
h
00
, and therefore, an additional constraint normalizes weights as follows: 1 0 =∑
= I i i ig h (4)3.2 Inversion of the Model
The inversion of the preceding optimal tax problem is a very simple idea. It consists in recovering, starting from the observed distribution of income before (Yi) and after
redistribution (Ci) and corresponding tax rates (Ti), the social welfare function that would
make the observed tax rate schedule optimal. In other words, the issue of the optimality of an existing tax-benefit system is transformed into the issue of the shape of the social welfare function associated with that system.
A formal definition of the optimal inverse problem (as in Bourguignon and Spadaro 2008) is the following:
Find the set of gi satisfying simultaneously (1a) and (4) 19
Simple algebra makes possible to obtain the following analytical expressions:
1 1 0 0 1 − − − − − − − − = I I I I I I I I I C C T T C C T T g
η
ς
18Note that this hypothesis can appear as restrictive given that, in principle, individuals can move outside their neighbor choice. Empirical evidence shows that the eventual error made is very small.
19
Note that this definition builds on the first order conditions of the social planner maximization problem. As Bourguignon and Spadaro (2008) show, it holds only if the maximization problem to be inverted is concave. In Bourguignon and Spadaro (2008) the set of “concavity tests” for an optimal inverse tax problem is given. These tests basically consist in checking that the revealed social welfare function is concave in their arguments. As we will show later, our empirical results are compatible with the hypothesis of concavity of the whole problem.
∑
+ = − − ⎥ ⎦ ⎤ ⎢ ⎣ ⎡ − − − − + − − − − − − = I i j j j j j j i i i i i i i i i i C C T T g h h C C T T C C T T g 1 0 0 1 1 0 0 1 1 1η
ς
η
and∑
=−
=
I i i ig
h
g
1 01
which allows us to compute recursively the weights gi using observed incomes Yi, net taxes Ti,
disposable incomes Ci and a set of values for participation and intensive elasticities.
Weights gi correspond to the marginal social welfare function in the continuous model à la
Mirrlees.
4 Data and Implementation
4.1 Data
Simulations for all countries are performed using the tax-benefit calculator EUROMOD. This model has been designed to simulate the tax-benefit systems of the EU-15 countries. For each country, it computes all direct taxes and monetary transfers, and hence disposable income, for all the households of a representative dataset (see Sutherland, 2001 and Immervoll et al. 2005). The choice of the initial system (1998) is made available for all 15 countries and updates for years 2001 and 2003 become available. However, we have opted for the year 1998 as it has been proof-checked through a variety of exercises and it is the most reliable (see Bargain, 2006). Table 2 reports the different national household data used to simulate tax-benefit systems. These datasets are all representative of each population.
The treatment of the family composition in the optimal tax framework is a difficult task. We therefore focus on a sample of single men and women20.
We select potential salary workers in the age range 18-65 (i.e. excluding pensioners, students, farmers and self-employed). To keep up with the logic of the optimal tax model, we exclude all households where capital income represents more than 10% of total gross income21. Unemployment benefit is treated as a replacement income from work and unemployed are thus considered in the same way as actual workers; this leaves nonetheless the option to treat unemployment benefit as pure redistribution or as pure insurance in the implementation of the model, as discussed below. Sample sizes are reported in Table 2.
4.2 The Treatment of Social Contribution and Replacement Incomes
Replacement incomes, which include social retirement benefits and unemployment benefits, deserve special attention. These are part of the public sector transfers but also comprise a redistributive component, at least in some countries. Thus, a simple treatment of these incomes would be to put them beside purely redistributive transfers. The opposite stance consists in focusing on the social insurance roots of replacement incomes, as done by some authors like Bourguignon (1997). Since in most countries public pensions and unemployment benefits are linked to workers' past earnings through social security contributions when active,
20
Immervoll et al. (2007) choose to include all working-age individuals in the population but this implies ignoring the joint decision in couple households. Bourguignon and Spadaro (2008) also ignore this dimension by treating families as providers of a common labor supply function and characterized by a household productivity.
21
Empirical evidence seems to show that there is a positive correlation among labor supply elasticity and level of capital (see Carbonnier for France, 2007). Thus, excluding “capitalists” implies a reduction of the labor supply elasticity for higher incomes. Nevertheless, the overall effects in term of social marginal weights are difficult to anticipate. It would be better to use a completely different optimal tax model.
they can be viewed as delayed salaries22. A careful sensitivity analysis requires checking results with both options23. In the same line of reasoning, one may consider the redistributive effects of social security contributions (cf. Rochet 1996 on health contributions in France). Alternatively, one may see this instrument as pure contributions to personal insurance in case of sickness, unemployment or old age24.
In the baseline above, the former case is used, with gross income as the starting point to evaluate the redistributive effect of the tax-benefit system including the effect of SSC25.
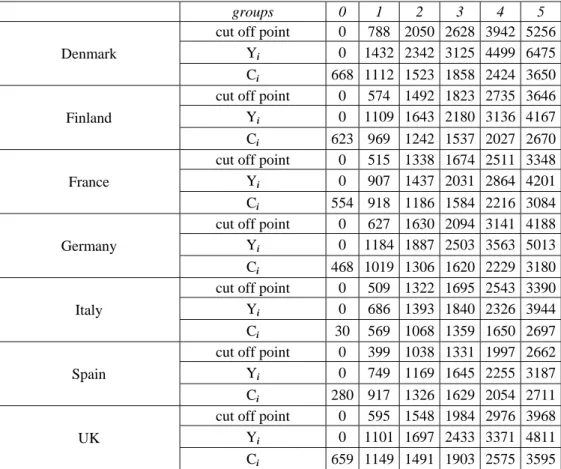
4.3 Defining Groups
The definition of the I+1 groups necessarily bears some arbitrariness in the way we partition the population. A large number of groups would probably be detrimental to the cross-country comparison. Keeping this constraint in mind, we opt for a small number of groups (I=5) that are made somewhat comparable. Group 0 is identified as the population of `idle poor', with zero market income, while group 1 is going to be the “working poor” population. The following groups are defined consistently in reference to the median income of each country. Cut-off points (lower bounds), gross income and disposable income for each income group are reported in Table 3. The corresponding proportion of the selected population in each group is reported in Table 4. Precisely, group 0 gather those with no labor income or very small amounts, the upper limit being the level corresponding to a part-time job paid at minimum wage. The number of observations between zero and this upper bound is very small in most countries, essentially due to the presence of fixed costs of working. For the next group (1), the population of working poor, the upper income limit is fixed as 1.3 times the minimum wage (or 1.3 time 60% of the median for countries without minimum wage). Group 2 is upper bounded by the median income, group 3 by 1.5 times the median income and group 4 by twice the median.
4.4 Labor Supply Elasticities
The magnitude of disincentive effects due to effective taxation depends crucially on the size of elasticities. However, the relative consensus which has emerged from the large literature on labor supply has not proved to be extremely precise. It establishes that income-elasticity is usually negative while own wage-elasticity are positive, below one and larger for married women due to larger responsiveness at the extensive margin (cf. Blundell and MaCurdy, 1999, Heckman, 1993). Some authors have dealt with this issue by relying on the latest econometric techniques to estimate as accurately as possible elasticities of countries under investigation (cf. Laroque, 2005, using empirical results of Laroque and Salanié, 2001). Other
22
The differences in the extent of social security programs among developed countries, along with the substitution between public and private assurance has driven the literature to limit the redistributive analysis to non-contributive social benefits and taxes.
23
Since we focus on working age households, we can leave aside the problem of public pensions. Yet, all countries operate unemployment insurance benefits. Those generally expire after some maximum duration and/or are conditional on participating in some type of active labor market program. By definition, these schemes are meant to replace lost earnings due to job loss. By narrowing the difference in disposable income when working and when not working, they substantially reduce gains to work, at least temporarily. Yet, except where they are affected by the spouse's earnings, they generally have no effect on the marginal tax rate of those in work. As a result, in the presence of positive labor supply participation elasticities, unemployment benefits certainly contribute to making in-work benefits more desirable. In the baseline, we therefore combine unemployment benefits to market income.
24
For instance, see Borsch-Supan and Reil-Held (2001) for a decomposition of the (public) pay-as-you-go pension systems between its role as insurance against longevity-related old-age poverty (and related risks) and its redistributive role.
25
Given the objectives of our research, choosing a particular criterion of definition of income assumes a strong normative character. This is the reason why we put a lot of emphasis in the description of the data selection procedure.
authors acknowledge both the limits of our empirical knowledge and the fact that responses in terms of hours and participation may not summarize all the possible effects -- high incomes, in particular, may response via changes in effort or via tax evasion. These authors, in particular Saez (2002) for the US and Spadaro (2005), Bourguignon and Spadaro (2008) and Immervoll et al. (2007) for EU countries, then analyze results of the Mirrlees model in the light of several hypothesis (upper and lower bounds) on the elasticity level.
While there is a wide empirical literature on the labor supply of married women (see Blundell and MaCurdy, 1999), evidence about singles, and in particular childless singles, is limited. Table 5 summarizes some of the relevant studies.
It appears that, for singles, there is no evidence of participation elasticity larger than 0.5 (in contrast to married women). Moreover, the formula describing participation elasticity, i.e. expression (3), is slightly different from the elasticity usually measured in the literature. The latter is obtained by 1% increase in Yi rather than in Ci-C0=Yi-(Ti+C0). In most cases, Ti+C0>0 so that Ci-C0 increases by more than 1% and ηi is therefore overstated by usual
estimates. The inverse is true only when Ti<-C0, i.e. when transfers to working poor are very
large.
For the intensive margin, evidence for singles is also limited and points out towards modest sized elasticities (cf Table 5). Yet, the classical labor supply elasticity (as in Mirrlees, 1971) is defined as the change in labor supply L in response to a marginal change in productivity:
w L L w w w L L wL wL Y Y ∂ ∂ = − ∂ − ∂ − ∂ ∂ ∂ ∂ − = − ∂ ∂ − = ) 1 ( ) 1 ( ) 1 ( 1 ) 1 ( 1 ττ τ τ τ τ ε
With present notations, it is written
) 1 ( 1 i i i i i Y Y τ τ ε − ∂ ∂ −
= with the effective marginal tax rate 1 1 − − − − = i i i i i Y Y T T τ .
As shown in Saez (2002), the classical labor supply elasticity, εi, is then related to the
intensive elasticity previously defined, ςi by the expression:
i i i i i
Y
Y
ε
Y
ς
(
−
−1)
=
In the present case, we could not estimate labor supply models for 7 countries and also rely on estimates drawn from the literature (see Table 5), emphasizing the importance of differentiating between intensive and extensive margins.
5 Empirical Results
The first type of findings we are looking for is a characterization of the redistributive tastes of each country using the inverse optimal tax approach. In particular, we want to check if marginal social weights are decreasing, as expected from a social planner with aversion for inequalities. The assumption of optimality of actual system is interesting per se. What matters is not the dynamic process leading to a given system but the fact that different systems in neighbor countries may reflect, among other things, differences in social preferences.
We also want to check if weights are placed on the idle poor (group 0) or rather on the working poor (group 1), reflecting value judgments regarding the role of personal responsibility in financial conditions and the way this affects institutional redistribution. Standard assumptions, as described previously, lead to results for the baseline scenario, as reported in Figure 6. Alternative assumptions on the elasticity levels provide a sensitivity analysis for each country, as summarized in Figure 7.
About the “optimality concerns” we recover here the same qualitative results obtained in Bourguignon and Spadaro (2000): Figure 6 shows `flat' redistributive tastes in Southern Europe and, to some extent, in the UK. In contrast, generous social assistance translates into high weights on group 0 in Nordic countries, Germany and France. For those countries,
however, weights in other groups are relatively flat. In general, marginal social welfare is both positive and flat or decreasing throughout the range of individual incomes classes, which convey that these systems are not far from Rawlsian preferences. This result suggests that the redistribution systems in these countries are consistent with the hypothesis of an optimizing
redistribution authority. Clearly, the basic optimization problem would not make sense if the
objective function were not concave. This is an interesting result, which was certainly not guaranteed by the inversion methodology used in this paper. Moreover it acquires a strong relevance given the heterogeneity of the redistribution systems and the socio-demographic characteristics of the countries analyzed.
The results also show the importance of including in the whole analysis the efficiency concerns: Figure 6 shows that, in most of the cases the weight on group 1, representing the working poor, is smaller than the weight on group 0. This result rationalizes the fact that working poor are subject to very high distortions corresponding to the high phase-out rate of social assistance (especially in Nordic countries), as previously documented by the distribution of effective marginal tax rates. As can be seen in Figure 7, the gap between weights on groups 0 and 1 is even larger when participation elasticity is large, which reinforces previous interpretation. In other words, higher responses at the extensive margin should motivate higher in-work transfers (and lower withdrawal rate) for the working poor; it does not occur, which can only be justified by even smaller weights on this group. Another important result from Figure 7 is the fact that the weight patterns do not vary too much with alternative assumptions, apart from the absolute level of weights on group 026.
Concerning the main objective of our analysis (i.e. looking at the social value judgments regarding the role of personal responsibility in financial conditions and the way this affects institutional redistribution), results from Figure 6 are in line with the standard classification of the welfare regimes (Esping Andersen, 1999, Pestieau 2006). Recall that our basic work hypothesis is that a high social marginal weight of group 0 is assimilated to a strong level of decommodification. It implies that on the y-axis of Figure 6 we can read a metrics of the level of the “willingness to decommodify citizens” of each social planner.
There appears to be a clear coincidence of high willingness and high Rawlsianism in the Scandinavian, social-democratically influenced welfare states (Denmark). There is an equally clear coincidence of low willingness and utilitarianism in the Anglo–Saxon liberal model (UK) and in the Southern European welfare states (Italy and Spain). Finally, the Continental European countries (Finland, Germany and France) group closely together in the middle of the scale, as corporatist and etatist.
The rank obtained inverting our optimal tax model supports the standard classification made by several authors (Esping Andersen 1999, Pestieau 2006). This is the most relevant and striking result (which, again, was certainly not guaranteed by the methodology used in this paper).
An important comment must be made here. The budget constraints represented in Figure 2 certainly provide a first idea on the “willingness to decommodify citizens” of each national system. The higher is the guaranteed minimum income (i.e. the intercept of each line) the higher will be the decommodification. Unfortunately, looking at Figure 2 is not enough to reveal the preferences of the social planner: it is extremely important to include efficiency (i.e. taking into account different behavioral responses) and socio-demographic aspects (i.e. taking into account differences in the income / wages distributions of each national population).
The cases of Denmark and Germany are illustrative: both are characterized by generous social assistance (the guaranteed minimum income is the same) but the low incomes marginal tax
26
As expected, the tighter the efficiency constraint at the extensive margin, i.e. the larger participation elasticities, the less generous transfers to the idle poor must be. The fact that this does not happen is rationalized by all the larger weights on this group.
rates are higher in the former country (see Figure 2: the derivative of the Danish budget constraint for low incomes is flatter. See also Figure 4). The results of the inversion of the optimal problem in the two countries give very different pictures (as shown in Figure 6): skipping the efficiency concerns can lead to misleading conclusions.
The results obtained with the inversion methodology are in line with the “decommodification ranking” computed by Esping Andersen (1990 and 1999) and also with other attempts, based on aggregate indicators, to compute some decommodification index for European countries (see Menahem 2007).
6 Conclusions
The aim of this paper has been to contribute to the debate regarding the typology of welfare states by offering a formal theorizing drawing from the optimal taxation literature (Mirrlees 1971) and allowing for comparative research on the structure of the Welfare State taking explicitly into account the efficiency concerns of the redistribution policies.
In order to assess the degree of decommodification of seven European welfare systems (Esping-Andersen, 1990), we have derived the shape of their social welfare functions by inverting the optimal tax model of Saez (2002) on actual average tax rate, under the (work) assumption that existing system are optimal for the government. Actual distributions of incomes before and after redistribution are obtained using a pan-European tax-benefit microsimulation model.
The discussion of the results in the light of standard classifications of welfare regimes in Europe had shown that there is a robust coincidence of high decommodification and high Rawlsianism in the Scandinavian, social-democratically influenced welfare states (Denmark). There is an equally clear coincidence of low decommodification and utilitarianism in the
Anglo–Saxon liberal model (UK) and in the Southern European welfare states (Italy and
Spain). Finally, the Continental European countries (Finland, Germany and France) group closely together in the middle of the scale, as corporatist and etatist.
We have shown the potential usefulness of this approach: by using it, it is possible to build a metrics that allows measuring the degree of (dis)similarity of the redistribution systems analyzed. It means that we are able to compare, in a consistent way, social preferences across countries with different welfare regimes and possibly different efficiency constraints.
The analysis performed highlighted the importance of taking seriously into account the agent behavioral reactions in this type of analysis. About this issue, it is important to emphasize that the economic empirical literature has pointed out towards larger elasticities at the extensive margin. If participation’ elasticities are large, then targeting the working poor through in-work transfers is preferable than generous social assistance schemes. This rationalizes the choice of a generous EITC in the US, as discussed by Saez (2002).
All European regimes investigated, with the exception of Southern countries, are, on the contrary, characterized by important redistribution towards the idle poor and the absence of in-work transfer to childless singles (implemented in the UK only in 2003), which must be justified by either small participation elasticity and/or large redistributive tastes for this group. Our work purely explores the cross-country dimension but extensions to account for changes over time are desirable. In particular, recent trend towards EITC schemes in Europe may translate a change in social preferences, or the recognition of the disincentive effects.
This may be the case in particular for some groups, i.e. single mothers, for whom participation elasticity is larger. Interestingly, even stronger differences across countries exist for this group, as illustrated by the budget curves of Figure 8. In particular, large transfers to unemployed (Nordic and corporatist models) contrast with large transfers to working poor singles with children (UK). As suggested above, divergences may come from differences in efficiency constraints or from significantly differences in social preferences. In the limit of our exercise on (childless) single individuals, cross-country differences are fairly robust to
different assumptions on elasticity and clearly distinguish welfare regimes in terms of social preferences. Future work must check the validity of these results and exploit the (even larger) heterogeneity across EU countries when it comes to single mothers (see Blundell et al. 2006 for a focus on this group in the case of the UK and Germany)27. Also, more attention must be paid to the role of unemployment benefits and social contributions, as extensively discussed in the text.
Another interesting line of research is to treat social preferences as endogenously determined. In particular, it would be interesting to question how social preferences are shaped by society's belief about fairness and luck (Alesina and Angeletos, 2005) or how they translate into the political process. Yet, this work could possibly be extended to account for the link between the design of redistributive policies and social choice28. Coggins and Perali (2002) suggest an exciting first attempt in this direction, revealing social preferences by connecting a social welfare function to a voting mechanism.
Future work should be also directed to include in the analysis the dynamic dimension of the construction of the welfare state (that in our paper is missing). Given the importance of the issue of intergenerational solidarity and the role of welfare state in his enhancement (Masson 2007, 2004a, 2004b, 2002), it would be interesting, for example, to try to fix a link between the ideal typology proposed in the comparative welfare state literature (Esping Andersen 1999 and Pestieau 2006) and the theoretical literature on the optimal design of pensions system (see Cremer, Lozachmeur and Pestieau 2007).
Our last remarks concern the limits of the suggested exercise (that we have already discussed all along the text). First and most important: we are aware that income taxes and benefits are only a very small part of the welfare state. In this sense, our contribution must be seen as a step towards the construction of formal theorizing allowing for better understanding the nature of welfare system and, eventually, to better define (if possible) ideal-typical models starting from the analysis of real welfare state.
Second: it is natural to think that real world tax-benefit schedules result more from political economy forces than from the pursuit of some well defined social objective. Even though, deriving and comparing social welfare functions implicit in each national system provide a new way to compare countries’ tastes for redistribution as embodied in tax-benefit systems. Third, the differences between countries are computed on the basis of the inversion of the tax model on single individuals. The family dimension is completely missing in our analysis. This is an important shortcoming given that the role of the family, and in particular, the substitutability between state and families in providing protection against decommodification risks, is one of the pillars of the standard debate.
While it is customary to compare systems in terms of (effective) average and marginal tax rates, degree of progressivity or degree redistribution (e.g. change in Gini due to the impact of tax-benefit systems), the present approach allows reading actual tax-benefit systems, and their recent evolutions, through the social preferences that they reveal.
27
One of the questions is: are negative EMTR generated by the WFTC, as can be observed on Figure 8, due to larger participation elasticity for single mums in the UK or to higher weight g1? See Laroque (2005) on the
justification of negative EMTR in the optimal tax framework.
28
Systems in force may reflect to some extent the redistributive concern of the party or coalition in power, hence of only part of the electorate. This is fairly evident in periods following a change of majority; Oliver and Spadaro (2004) show for instance that the arrival of the right-wing Aznar government in Spain has been followed by a tax reform that can be interpreted in terms of changes in the redistributive concern of the State. Therefore, we should remain cautious with the term `social' preference -- the reconciling political economy process is beyond our scope. Note, however, that the whole system does not change at each election and the alternance of majorities in Europe -- even if leading to some reshaping of redistributive systems -- may still leave room for significant differences `on average' between countries. In particular, political spectrums in different countries are not perfectly overlapping. Overall, then, we argue that cross-country differences in underlying social preferences may be important and deserve characterization.
References
Aaberge R., U. Colombino, S. Strøm and T. Wennemo, (1998), “Evaluating Alternative Tax Reforms in Italy with a Model of Joint Labor Supply of Married Couples”, Structural Modeling and Economic Dynamics, 9, 415-433, 1998.
Ackert, L.F., J. Martinez-Vazquez and M. Rider (2007): "Social preferences and tax policy design: some experimental evidence", Economic Inquiry, 45 (3), 487--501.
Ahmad, E. and N. Stern (1984): "The theory of reform and Indian indirect taxes", Journal of Public Economics, 25, 259-298.
Alesina, A. and G.M. Angeletos (2005): "Fairness and redistribution: US vs. Europe", American Economic Review, 95, 913-935.
Amiel, Y., J. Creedy, and S. Hurn (1999): "Measuring attitudes towards inequality", Scandinavian Journal of Economics, 101: 83-96.
Arts, W. A. and Gelissen, J. (2002) ‘Three worlds of welfare capitalism or more? A state-of-the-art report’ Journal of European Social Policy 12 (2): 137–158.
Atkinson A.B, Bourguignon F., Chiappori P.A., (1988): "What Do We Learn About Tax Reforms from International Comparisons? France and Britain", European Economic Review, 32.
Baldwin, P. (1996) ‘Can We Define a EuropeanWelfare State Model?’, in B. Greve (ed.) Comparative Welfare Systems: the Scandinavian Model in a Period of Change, pp. 29– 44. London: Macmillan.
Bargain, O. (2006, ed.), Microsimulation in action: policy analysis in Europe using EUROMOD, Research in Labor Economics, 25, Elsevier, North-Holland."
Bargain O, Orsini K, (2006), “In-work policies in Europe: Killing two birds with one stone?” Labour Economics, vol. 13, no. 6, pp. 667 - 697.
Blundell, R.W. and T. MaCurdy (1999): "Labor Supply: A Review of Alternative Approaches", in Ashenfelter and Card (eds), Handbook of Labor Economics , Elsevier North-Holland.
Blundell, R.W., M. Brewer, P. Haan and A. Shephard, (2006): "Optimal income taxation of lone mothers: an empirical comparison for Germany and the UK", mimeo.
Blundell R.W I. Walker, (1986), “Unemployment, Search and Labour Supply”, Cambridge University Press.
Boje, T. (1996) ‘Welfare State Models in Comparative Research: Do the Models Describe the Reality?’, in B. Greve (ed.) Comparative Welfare Systems: the Scandinavian Model in a Period of Change, pp. 13–27. London: Macmillan Press.
Bonoli, G. (1997) ‘Classifying Welfare States: a Two-dimension Approach’, Journal of Social Policy 26 (3): 351–72.
Borsch-Supan, A. and A. Reil-Held (2001): "How Much is Transfer and How Much is Insurance in a Pay-as-you-go System? The German Case", Scandinavian Journal of Economics 103 (3), 505--524.
Bourguignon F. (1997), Fiscalité et redistribution, Conseil d'Analyse Economique report, La Documentation Française.
Bourguignon, F. and A. Spadaro (2000): "Social Preferences Revealed through Effective Marginal Tax Rates". DELTA Working Paper nº 2000-29.
Bourguignon, F. and A. Spadaro (2005): "Tax-Benefit Revealed Social Preferences", PSE Working Paper nº 2005-22.
Bourguignon, F. and A. Spadaro (2008): "Tax-benefit reveal social preferences", mimeo. Carbonnier C. (2007) “L’impact de la fiscalité sur la participation des conjoints au marché du
travail”. DGTPE Working Paper nº 2007/05 - Paris
Choné, P. and G. Laroque (2005): "Optimal incentives for labor force participation", Journal of Public Economics, 89 (2-3), p. 395-425