HAL Id: hal-01714169
https://hal.archives-ouvertes.fr/hal-01714169
Submitted on 27 Apr 2018
HAL is a multi-disciplinary open access
archive for the deposit and dissemination of
sci-entific research documents, whether they are
pub-lished or not. The documents may come from
teaching and research institutions in France or
abroad, or from public or private research centers.
L’archive ouverte pluridisciplinaire HAL, est
destinée au dépôt et à la diffusion de documents
scientifiques de niveau recherche, publiés ou non,
émanant des établissements d’enseignement et de
recherche français ou étrangers, des laboratoires
publics ou privés.
The VIMOS Public Extragalactic Redshift Survey
(VIPERS). Full spectroscopic data and auxiliary
information release (PDR-2)
M. Scodeggio, L. Guzzo, B. Garilli, B.R. Granett, M. Bolzonella, S. de la
Torre, U. Abbas, C. Adami, S. Arnouts, D. Bottini, et al.
To cite this version:
M. Scodeggio, L. Guzzo, B. Garilli, B.R. Granett, M. Bolzonella, et al.. The VIMOS Public
Extra-galactic Redshift Survey (VIPERS). Full spectroscopic data and auxiliary information release (PDR-2).
Astron.Astrophys., 2018, 609, pp.A84. �10.1051/0004-6361/201630114�. �hal-01714169�
November 23, 2016
The VIMOS Public Extragalactic Redshift Survey (VIPERS)
?
Full spectroscopic data and auxiliary information release (PDR-2)
M. Scodeggio
1, L. Guzzo
2, 3, B. Garilli
1, B. R. Granett
2, 3, M. Bolzonella
4, S. de la Torre
5, U. Abbas
6, C. Adami
5,
S. Arnouts
5, D. Bottini
1, A. Cappi
4, 7, J. Coupon
8, O. Cucciati
9, 4, I. Davidzon
5, 4, P. Franzetti
1, A. Fritz
1, A. Iovino
2,
J. Krywult
10, V. Le Brun
5, O. Le Fèvre
5, D. Maccagni
1, K. Małek
11, A. Marchetti
1, F. Marulli
9, 12, 4, M. Polletta
1, 13, 14,
A. Pollo
11, 15, L.A.M. Tasca
5, R. Tojeiro
16, D. Vergani
17, A. Zanichelli
18, J. Bel
19, E. Branchini
20, 21, 22, G. De Lucia
23,
O. Ilbert
5, H. J. McCracken
24, T. Moutard
25, 5, J. A. Peacock
26, G. Zamorani
4, A. Burden
27, M. Fumana
1, E. Jullo
5,
C. Marinoni
19, 28, Y. Mellier
24, L. Moscardini
9, 12, 4, and W. J. Percival
27(Affiliations can be found after the references) November 23, 2016
ABSTRACT
We present the full public data release (PDR-2) of the VIMOS Public Extragalactic Redshift Survey (VIPERS), performed at the ESO VLT. We release redshifts, spectra, CFHTLS magnitudes and ancillary information (as masks and weights) for a complete sample of 86,775 galaxies (plus 4,732 other objects, including stars and serendipitous galaxies); we also include their full photometrically-selected parent catalogue. The sample is magnitude limited to iAB≤ 22.5, with an additional colour-colour pre-selection devised as to exclude galaxies at z < 0.5. This practically doubles the effective sampling of the VIMOS spectrograph over the range 0.5 < z < 1.2 (reaching 47% on average), yielding a final median local galaxy density close to 5 × 10⁻³h3Mpc−3. The total area spanned by the final data set is ' 23.5 deg2, corresponding to 288 VIMOS fields with marginal overlaps, split over two regions within the CFHTLS-Wide W1 and W4 equatorial fields (at R.A.' 2 and ' 22 hours, respectively). Spectra were observed at a resolution R= 220, covering a wavelength range 5500-9500 Å. Data reduction and redshift measurements were performed through a fully automated pipeline; all redshift determinations were then visually validated and assigned a quality flag. Measurements with a quality flag ≥ 2 are shown to have a confidence level of 96% or larger and make up 88% of all measured galaxy redshifts (76,552 out of 86,775), constituting the VIPERS prime catalogue for statistical investigations. For this sample the rms redshift error, estimated using repeated measurements of about 3,000 galaxies, is found to be σz = 0.00054(1 + z). All data are available at http://vipers.inaf.it and on the ESO Archive.
Key words. Cosmology: observations – Cosmology: large scale structure of Universe – Galaxies: distances and redshifts – Galaxies:
statistics
1. Introduction
Large photometric and spectroscopic galaxy surveys have played a key role in building our current understanding of the Universe. At z ≤ 0.2, the 2dFGRS (Colless et al. 2003) and SDSS (York et al. 2000; Abazajian et al. 2009) redshift surveys have assem-bled samples of over a million objects, precisely characterising large-scale structure and galaxy properties in the nearby Uni-verse on scales ranging from 0.1 to 100 h−1Mpc. The SDSS has then extended its reach, first by using luminous red
galax-Send offprint requests to: Marco Scodeggio e-mail: [email protected]
?
based on observations collected at the European Southern Observa-tory, Cerro Paranal, Chile, using the Very Large Telescope under pro-grammes 182.A-0886 and partly 070.A-9007. Also based on obser-vations obtained with MegaPrime/MegaCam, a joint project of CFHT and CEA/DAPNIA, at the Canada-France-Hawaii Telescope (CFHT), which is operated by the National Research Council (NRC) of Canada, the Institut National des Sciences de l’Univers of the Centre National de la Recherche Scientifique (CNRS) of France, and the University of Hawaii. This work is based in part on data products produced at TER-APIX and the Canadian Astronomy Data Centre as part of the Canada-France-Hawaii Telescope Legacy Survey, a collaborative project of NRC and CNRS. The VIPERS web site is http://www.vipers.inaf.it/.
ies (LRG) to push to z ' 0.35 (SDSS-II: Eisenstein et al. 2011; Ahn et al. 2012), and more recently (to z ' 0.5) by using a more heterogeneous set of colour-selected objects to trace large vol-umes of the Universe in a highly effective way, notwithstanding a rather dilute sampling of the total galaxy population (SDSS-III BOSS: Alam et al. 2015). [A more complete account of the de-velopment of galaxy redshift surveys over the past two decades was given in Guzzo et al. 2014].
The VIMOS Public Extragalactic Redshift Survey (VIPERS) adopted the original broad approach of SDSS-I, transposed to the redshift range 0.5 < z < 1.2, essentially extending to a much larger volume of the Universe the exploration initiated with smaller-area VIMOS precursors, i.e. VVDS (Le Fèvre et al. 2013; Garilli et al. 2008) and zCOSMOS (Lilly et al. 2009). In practice, VIPERS was conceived to obtain a large-volume, dense sample of the general galaxy population, characterised by a simple, broad selection function, complete to a given flux limit within a well-defined redshift range and complemented by ex-tended photometric information.
This paper accompanies the Public Data Release 2 (PDR-2) of the complete VIPERS data set and is organised as follows: in Sect. 2.1 we summarise the survey design and scope, which we
discussed in detail in the papers by Guzzo et al. (2014) and Gar-illi et al. (2014), which accompanied the first data release (PDR-1); in Sect. 3 we present the final survey mask and complete-ness estimates, while redshift measurements are summarised in Sect. 4, and the overall properties of the PDR-2 sample are pre-sented in Sect. 5.
2. Summary of survey design and execution
2.1. Survey design
VIPERS was designed to sample, at a median redshift z ' 0.7, a volume comparable to the one covered by redshift surveys map-ping the local Universe (2dFGRS and SDSS), with a similarly high sampling density of the galaxy population. To achieve use-ful spectral quality in a limited exposure time using the VIMOS spectrograph (Le Fèvre et al. 2003), a relatively bright limit of iAB ≤ 22.5 was adopted, and this generated two main issues for
efficient sample selection. At this depth, many galaxies will lie below the redshift range of interest, i.e. 0.5 < z < 1.2 (see for ex-ample Le Fèvre et al. 2005, 2013; Lilly et al. 2009); also, it was known from previous similar studies such as the VVDS-Wide (Garilli et al. 2008) that such a purely magnitude-limited sam-ple would suffer from approximately 30% stellar contamination. Here we give a brief summary of the steps taken to overcome these difficulties (see Guzzo et al. 2014 and Garilli et al. 2014 for fuller details).
The VIPERS target selection was derived from the ‘T0005’ release of the CFHTLS Wide photometric survey, completed and improved using the subsequent T0006 release. A prelimi-nary multi-band catalogue, including all objects with extinction-corrected apparent magnitude iAB≤ 22.5, was built starting from
the individual CFHTLS 1-deg2tiles. Particular care was taken to verify the homogeneity of these original single-tile catalogues: by analyzing the colour-colour stellar locus within each such cat-alogue, we were able to identify significant tile-to-tile offsets in the photometric zero-points for different photometric bands. To ensure that the final VIPERS parent photometric catalogue was as spatially homogeneous as possible, a tile-to-tile offset cor-rection to the observed colours was estimated and applied. As discussed extensively by Guzzo et al. (2014), this offset was ob-tained by comparing the position in colour space of the (well-defined) stellar locus with that of a reference tile (the one over-lapping the VVDS F02 survey field, Le Fèvre et al. 2013).
This homogenisation of galaxy colours over the full area was particularly crucial for the subsequent removal of low-redshift galaxies (nominally z < 0.5), which was implemented via a ro-bust colour-colour selection in the (r − i) vs (u − g) plane, tuned using the VVDS complete redshift data. Details can be found in Guzzo et al. (2014). Finally, stellar objects were removed using a combination of two methods: for objects brighter than iAB = 21.0, stars were identified on the basis of their half-flux
radius, as measured on the i-band CFHTLS images; for fainter objects, a combination of image size and SED fitting of the 5-band CFHTLS photometry was used (see Appendix A of Guzzo et al. 2014, and Section 2.1 of Garilli et al. 2014).
Overall, some 21% of the objects in the total photometric cat-alogue have been removed because they were classified as stars, 32% were removed because they were classified as low redshift galaxies, and the remaining 47% became the VIPERS parent photometric sample, which was then supplemented with a small additional sample of AGN candidates, chosen from objects that were initially classified as stars on the basis of a colour-colour criterion (see Section 2.2 of Garilli et al. 2014). This sample
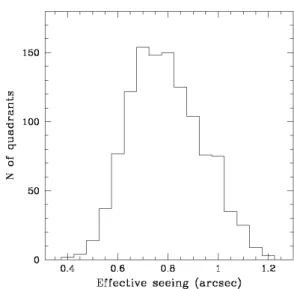
Fig. 1. The effective seeing distribution for the VIPERS observations. The seeing value is obtained from the measurement of the FWHM size of the spectral traces for bright objects in the spectroscopic exposures.
contributes on average 2-5 objects per VIMOS quadrant (against about 90 galaxy targets) with negligible impact on the galaxy selection function. In the PDR-2 catalogue these additional ob-jects can be easily identified and separated from the main galaxy sample through an appropriate keyword, as described in Sect. 5.
2.2. Improvements in CFHTLS photometry during the construction of VIPERS
The tile-to-tile colour shifts in the T0005 data discussed in the previous section were a clear evidence that the initial global pho-tometric calibration could be significantly improved. Such a step forward was provided by the CFHTLS T0007 revision (Hudelot et al. 2012). For VIPERS, the most important feature of T0007 compared to previous releases is that each tile in the CFHTLS was rescaled to an absolute calibration provided by a new dedi-cated survey of calibrators carried out at the CFHT. In addition, in order to ensure that seeing variations between tiles and filters were correctly accounted for, aperture fluxes were rescaled to al-low for the seeing of each individual tile. These aperture fluxes have then become the basis of the new photometric catalogue for VIPERS, since it has been shown that Kron (mag auto) flux esti-mates provide less accurate colour estiesti-mates, which lead, among other things, to worse photo-z’s (Moutard et al. 2016a; Hilde-brandt et al. 2012). A new photometric catalogue was therefore created, based on Terapix T0007 isophotal aperture magnitudes, with the addition of UV photometry from GALEX (Martin et al. 2005), and NIR Ks-band photometry from WIRCam (Puget et al.
2004) or from VISTA (Emerson et al. 2004), obtained as part of the VIPERS Multi-Lambda Survey (VIPERS-MLS, Moutard et al. 2016a) or the VISTA Deep Extragalactic Observations (VIDEO, Jarvis et al. 2013), respectively. The isophotal magni-tudes were then corrected to pseudo-total ones using an aperture correction for each individual object, obtained as the average of the aperture corrections obtained for the g, r, i, and Ks bands.
Details can be found in Moutard et al. (2016a).
This new photometric catalogue became available after VIPERS was well under way, and it was therefore decided not
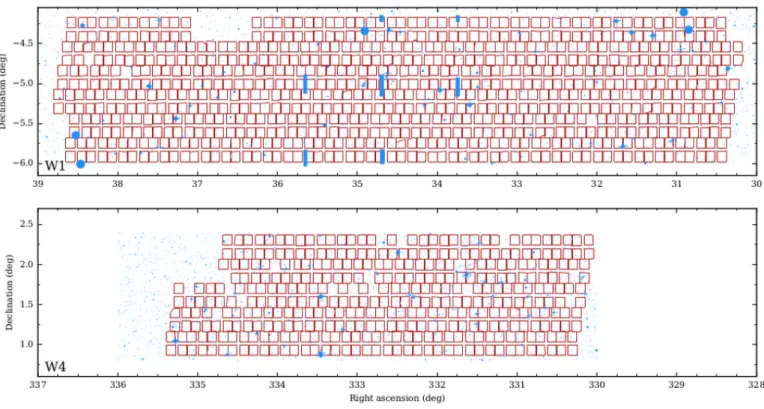
Fig. 2. The layout on the sky of all pointings that contribute to the PDR-2 final release, for the two fields W1 and W4, superimposed on the photometric survey mask. The contours of each of the four quadrants that comprise all VIMOS pointings are shown in red. The blue (grey) areas in the background correspond to areas where the parent photometry is corrupted or observations are not possible due to the presence of foreground objects, particularly bright stars and their diffraction spikes. Note that in this plot failed quadrants and other features introduced by the ‘spectroscopic mask’ are not indicated (see Section 3.2 and Figs 3 and 5).
to replace the original parent VIPERS catalogue, because such a substitution would have turned the original well-defined mag-nitude limit into a somewhat fuzzy limit, resulting from the ap-proximately 0.05 mags scatter in the magnitude comparison be-tween the T0005 and T0007 photometry (at the 22.5 magnitude limit of the catalogue). A choice was therefore made to match the two catalogues, and to provide T0007 photometry for all the objects in the original T0005-based catalogue. The matching was carried out using a match circle of 0.6 arcsec, which ensures a 97% matching success rate, with an almost null incidence of multiple object matches. Although the original VIPERS cata-logue is limited to iAB≤ 22.5, the matching was carried out
lim-iting both the old and the new catalogue to iAB≤ 23.0, to avoid
the scatter at the catalogue limit to affect the resulting match. For the small fraction of objects that could not be satisfacto-rily matched (mostly due to small differences in the source de-blending procedure), we computed pseudo-T0007 magnitudes: we estimated the median offset between the T0005 and T0007 catalogues for each photometric band and each CFHTLS parent tile using objects with iAB ≤ 21.0, and added this offset to the
original T0005 magnitudes (the magnitude uncertainty was kept equal to the T0005 value).
Areas in the photometric catalogue with poor quality, cor-rupted source extraction, or bright stars are described by a binary mask, as discussed in Sect. 3.
2.3. Spectroscopic observations
All VIPERS observations were carried out using VIMOS (ESO VIsible Multi-Object Spectrograph), on ‘Melipal’, Unit 3 of the ESO Very Large Telescope (VLT) – see Le Fèvre et al. (2003).
VIMOS is a 4-channel imaging spectrograph; each channel (a ‘quadrant’) covers ∼ 7 × 8 arcmin2 for a total field of view (a
‘pointing’) of ∼ 224 arcmin2. Each channel is a complete spec-trograph with the possibility of inserting 30×30 cm2slit masks at
the entrance focal plane, as well as broad-band filters or grisms. The precise sizes of the quadrants are in principle all slightly different from each other: the four channels of VIMOS all dif-fer slightly, and they also changed with time during the survey development, when the VIMOS CCDs were refurbished (see be-low). There is also variation from one pointing to another, e.g. due to vignetting by the guide star probe. All these pieces of information are quantified accurately by the mask files associ-ated with the PDR-2 release, which we discuss in the following section.
The pixel scale on the CCD detectors is 0.205 arcsec/pixel, providing excellent sampling of the Paranal mean image quality and Nyquist sampling for a slit 0.5 arcsec in width. For VIPERS, we used a slit width of 1 arcsec, together with the ‘low-resolution red’ (LR-Red) grism, resulting in a spectral resolution R ' 220 at the centre of the wavelength range covered by this grism (i.e. ∼ 5500 − 9500 Å). In summer 2010, VIMOS was upgraded with new red-sensitive CCDs in each of the four channels, as well as with a new active flexure compensation system. The reliability of the mask exchange system was also improved (Hammersley et al. 2010). The original thinned E2V detectors were replaced by twice-thicker E2V devices, considerably lowering the fring-ing and increasfring-ing the global instrument efficiency by up to a factor 2.5 (one magnitude) in the redder part of the wavelength range. This upgrade significantly improved the average quality of VIPERS spectra, resulting in a significantly higher redshift measurement success rate.
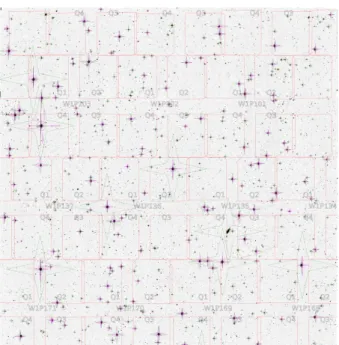
Fig. 3. A 1 deg2detail of the masks developed for VIPERS. The re-vised photometric mask built for VIPERS corresponds to the magenta circles and cross patterns; for comparison, the original, more conserva-tive mask distributed by Terapix is shown in green. The quadrants that make up the VIPERS pointings are plotted in red. In the background is the CFHTLS T0006 χ2image of the field 020631−050800 produced by Terapix. Note the significant gain in usable sky obtained with the new VIPERS-specific mask.
The complete VIPERS survey consists of 288 VIMOS point-ings, 192 over the W1 area, and 96 over the W4 area of the CFHTLS, overlapping a total sky area of about 23.5 square de-grees. Due to the specific footprint of VIMOS, failed quadrants and masked regions, this corresponds to an effectively covered area of 16.3 square degrees. The number of slits in the spectro-scopic masks ranged from 60 to 121 per VIMOS quadrant, with a median value of 87, for a total of 96,929 slits over the whole survey. For nine pointings, observations were repeated because the original observation was carried out under sub-optimal see-ing and/or atmospheric conditions, while four pointings already observed before the VIMOS 2010 upgrade were re-observed as part of the related re-commissioning. Overall, observations were carried out starting in November 2008, and were completed by December 2014. For 23 pointings (6 in the W1 area, and 17 in the W4 one) some mask insertion problem prevented the ac-quisition of useful spectroscopic data in one of the four VIMOS quadrants, leaving some small “holes” in the survey sky cover-age (see Fig. 2). These are termed "failed" quadrants. Airmass during the observations ranged from 1.06 to 1.44, with a median value of 1.14, while the effective seeing (measured directly from the observed size of the reference objects used to align the VI-MOS masks) ranged from 0.41 to 1.21 arcsec, with a median value of 0.78 arcsec. Fig. 1 shows the distribution of these e ffec-tive seeing values.
3. Sky coverage, angular selection functions and completeness
The VIPERS angular selection function is the result of the com-bination of several different angular completeness functions. Two of these are binary masks (i.e. describing areas that are fully used or fully lost). The first mask (that we call the
photo-Fig. 4. Estimate of the Colour Sampling Rate (CSR) of VIPERS The plot shows the fraction of galaxies that are selected by the VIPERS colour-colour criteria as a function of redshift, when applied to a sample of galaxies from the VVDS-Deep and VVDS-Wide surveys (Le Fèvre et al. 2013). This is a highly significant test, given that the original colour-colour boundaries to select VIPERS targets were calibrated on the same VVDS data. Both W1 and W4 fields provide consistent se-lection functions, yielding a colour sese-lection function that is essentially unity above z= 0.6 and can be consistently modelled in the transition region 0.4 < z < 0.6.
metric mask) is related to defects in the parent photometric sam-ple (mostly areas masked by bright stars) and the other (that we call the spectroscopic mask) to the specific footprint of VIMOS and how the different pointings are tailored together to mosaic the VIPERS area. The other completeness functions are pro-vided instead on a per-galaxy basis: 1) within each of the four VIMOS quadrants on average only 47% of the available targets satisfying the selection criteria are actually placed behind a slit and observed, defining what we call the Target Sampling Rate; 2) since the set of available targets is defined based on the ob-served colour, as discussed in Sect. 2.1, a Colour Sampling Rate is needed to keep this selection effect into consideration; 3) vary-ing observvary-ing conditions and technical issues determine a varia-tion from quadrant to quadrant of the actual number of redshifts measured with respect to the number of targeted galaxies, while our capability to measure the redshift depends on intrinsic galaxy parameters, as we shall discuss in Sect. 3.5 when introducing the Spectroscopic Success Rate.
Detailed knowledge of all these contributions is a crucial in-gredient for computing any quantitative statistics of the galaxy distribution, as e.g. its first and second moments (i.e. luminos-ity/ stellar mass functions and two-point correlation functions, respectively).
3.1. CFHTLS-VIPERS photometric mask
The photometric quality across the CFHTLS images is tracked with a set of masks that account for imaging artefacts and non-uniform coverage. We use the masks to exclude regions from the survey area with corrupted source extraction or degraded photo-metric quality. The masks consist primarily of patches around
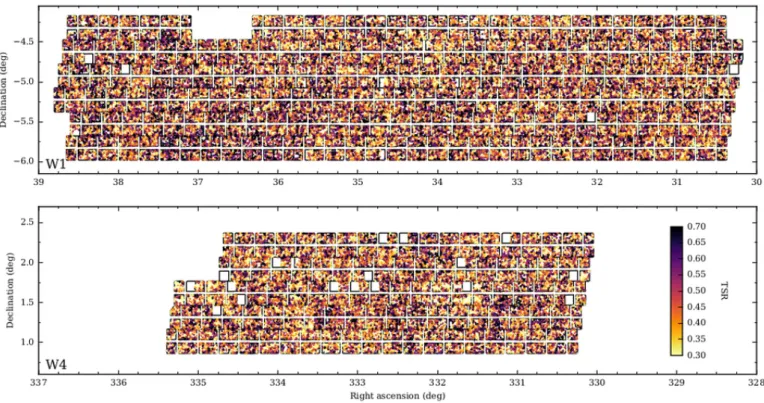
Fig. 5. The angular distribution over the survey areas of the Target Sampling Rate (TSR, colour scale), estimated locally for each galaxy as described in the text. In this plot, each value has been smoothed on a scale of 2 arcmin to enhance the (inverse) relationship of the TSR with the projected large-scale structure in the galaxy distribution.
bright stars (BVega< 17.5) owing to the broad diffraction pattern
and internal reflections in the telescope optics. At the core of a saturated stellar halo there are no reliable detections, leaving a hole in the source catalogue, while in the halo and di ffrac-tion spikes spurious sources may appear in the catalogue due to false detections. We also add to the mask extended extra-galactic sources that may be fragmented into multiple detections or that may obscure potential VIPERS sources. The details of the revised photometric mask construction were given in Guzzo et al. (2014) and a visual rendition of the two W1 and W4 masks is given in Fig. 2, while Fig. 3 provides a zoom into a smaller area, in particular showing the details of the custom-developed VIPERS photometric mask, compared to the original CFHTLS mask.
It is important to stress here that a small fraction of spec-troscopically observed galaxies actually fall within regions for-bidden by the photometric mask. These are objects for which, typically, one of the photometric bands had too large an error to be acceptable, but were nevertheless observed as fillers. As such, in any computation of spatial statistics the photometric and spectroscopic masks must be applied not only to any aux-iliary random sample (as typically needed for two-point cluster-ing measurements), but also re-applied to the observed spectro-scopic catalogue itself. This is required in order to trim these little ‘leakages’ within a few specific areas.
3.2. VIPERS spectroscopic masks
The general layout of VIMOS is well known, but the precise ge-ometry of each quadrant has to be specified carefully for each ob-servation, in order to perform precise clustering measurements with the VIPERS data. For example, although it rarely
hap-pens, a quadrant may be partly vignetted by the VLT guide probe arm; in addition, the size and geometry of each quadrant changed slightly between the pre- and post-refurbishment data (i.e. from mid-2010 on), due to the dismounting of the instrument and the technical features of the new CCDs. We therefore had to build our own extra mask for the spectroscopic data, accounting for all these aspects at any given point on the sky covered by the survey. The masks for the W1 and W4 data were constructed from the pre-imaging observations by running an image analysis rou-tine that identifies ‘good’ regions within those images. First, a polygon is defined that traces the edge of the image. The mean and variance of the pixels are computed in small patches at the vertices of the polygon, and these measurements are compared to the statistics at the centre of the image. The vertices of the poly-gon are then iteratively moved inward toward the centre until the statistics along the boundary are within an acceptable range of those measured at the centre. The boundary that results from this algorithm is used as the basis for the field geometry. The polygon is next simplified to reduce the vertex count: short seg-ments that are nearly co-linear are replaced by long segseg-ments. The World Coordinate System information in the fits header is used to convert from pixel coordinates to sky coordinates. Each mask was then examined by eye. Features due to stars at the edge of an image were removed, wiggly segments were straight-ened and artefacts due to moon reflections were corrected. The red lines in Fig. 3 show the detailed borders of the VIMOS quad-rants, describing the spectroscopic mask.
3.3. Colour Sampling Rate
The completeness of the colour-colour pre-selection applied to ideally isolate z > 0.5 galaxies using the CFHTLS corrected
20 22 i 0.0 0.2 0.4 0.6 0.8 1.0 1.2 Success rate Completeness Weighted Distribution 0.8 1.6 Photometric redshift 21MB 18 0.8 1.6 MU−MV 2 4 MNUV−Mr 0 1 Mr−MK 0.6 0.8 1.0 Q Trends: i 20 22 i 0.0 0.2 0.4 0.6 0.8 1.0 1.2 Success rate Completeness Weighted Distribution 0.8 1.6 Photometric redshift 21MB 18 0.8 1.6 MU−MV 2 4 MNUV−Mr 0 1 Mr−MK 0.6 0.8 1.0 Q Trends: i, MB, MU−MV, Q
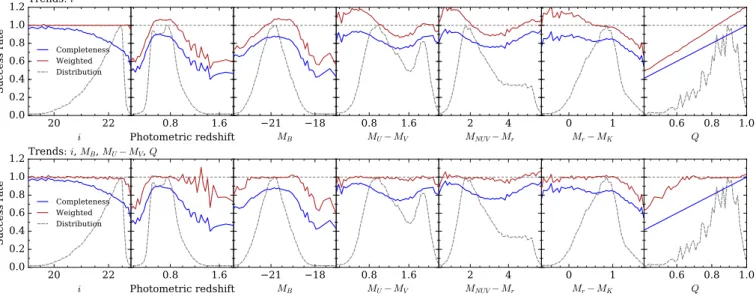
Fig. 6. The spectroscopic success rate (SSR) as a function of different observed photometric properties (blue solid curve), compared to the result of applying the weight to correct incompleteness (red solid curve). The two rows of plots show how the completeness correction changes when one only considers a simple SSR dependence on the selection i-band magnitude (top), or rather includes the more subtle dependencies on observed colours and, in particular, quality of the specific VIMOS quadrant (‘Q’ parameter, quantified via the mean SSR for all galaxies in that quadrant). The differential distribution of each parameter is also plotted in each panel (dashed curve).
photometry, has been quantified and discussed in Guzzo et al. (2014). Using the data from the VVDS survey, the Colour Sam-pling Rate (CSR) was estimated as a function of redshift. This is shown in Fig. 4 [originally from Guzzo et al. (2014)], which we reproduce here for completeness: from this figure it is quite clear how the VIPERS catalogue is virtually 100% complete above z = 0.6, when compared to a corresponding purely magnitude-limited sample.
3.4. Target Sampling Rate
A Multi-Object Spectrograph (MOS) survey inevitably has to deal with the limitation of MOS slits creating a shadow effect in the targeting of potential sources that is strongly density-dependent. In practice the high-density peaks of the projected galaxy density field are under-sampled with respect to the low-density regions, because the MOS slit length imposes a mini-mum angular pair separation in the spectroscopic target selec-tion. In VIPERS, this was performed using the SPOC algorithm (Bottini et al. 2005, within the VMMPS software distributed by ESO), which maximises the number of slits observed in each quadrant. As a result, (a) very close pairs below a certain scale are practically unobservable; (b) the angular distribution of slits is more uniform than the underlying galaxy distribution. In VIPERS, the first effect suppresses angular clustering below a scale of 5 arcsec, producing a scale-dependent damping of the observed clustering below ' 1 h−1Mpc; the second is instead responsible for a nearly scale-independent reduction of the two-point correlation function amplitude above this scale. These ef-fects and their correction are discussed in detail in the parallel paper by Pezzotta et al. (2016). The method builds upon the original approach of (de la Torre et al. 2013), by up-weighting galaxies on the basis of the Target Sampling Rate (TSR), namely
wi=
1 TSRi
. (1)
In de la Torre et al. (2013), however, the TSR was evaluated only on a quadrant to quadrant basis so that all the targeted galaxies falling in the same quadrant are up-weighted by the same factor. This procedure does not recover the total missing power, since it does not account for the above effects on sub-quadrant scales. The new corrective approach is similar, but uses a local TSR that accounts much more effectively for the angular inhomogeneity of the selection function. This is estimated for each galaxy as the ratio of the local surface densities of target and parent galaxies (i.e. before and after applying the target selection), properly esti-mated and then averaged within an aperture of appropriate shape and size. If we call these quantities δpi and δsi, then the TSRiis
defined as TSRi= δs i δp i . (2)
A continuous δ field is obtained, starting from the discrete sur-face distribution, by first using a classical Delaunay tessellation to get the density at the position of each galaxy, and then lin-early interpolating. This is finally integrated around the position of each observed galaxy within a rectangular aperture with size 60 × 100 arcsec2to obtain the local values of δs
i and δ p i. It can
be shown (Pezzotta et al. 2016) that a rectangular aperture more efficiently accounts for the angular anisotropy in the distribution of targets within a quadrant introduced by the shadowing effect of the MOS slits.
The resulting distribution of the TSR values over the survey regions is shown in Fig. 5. Thanks to the adopted strategy (i.e. having discarded through the colour selection almost half of the magnitude-limited sample lying at z < 0.5), the average TSR of VIPERS is ' 47%, a high value that represents one of the specific important features of VIPERS. For a comparison, with the VVDS-Wide sample, selected to the same magnitude limit, but without colour pre-selection and star rejection, the sampling rate was about 23% (Garilli et al. 2008), i.e. half of what we have achieved here. We remark how the TSR essentially mirrors the intrinsic fluctuations in the number density of galaxies as a
0.4
0.6
0.8
1.0
1.2
Photometric redshift
0.5
1.0
1.5
2.0
M
U −M
V20
21
22
i
22
21
20
19
M
B0.4
0.5
0.6
0.7
0.8
0.9
1.0
Success rate
Fig. 7. 2D plots of the SSR in the photometric parameter space. We show the dependence on the rest-frame U − V colour jointly with three photometric parameters: photometric redshift (left), apparent i-band magnitude (centre), and rest-frame B-band magnitude (right). The solid contours contain 10, 50, 90 and 99% of the sample.
function of position on the sky, and how single quadrants some-times have a strong internal inhomogeneity in the sampling of galaxies.
3.5. Spectroscopic Success Rate
We quantify the VIPERS redshift measurement success via the Spectroscopic Success Rate (SSR), which is defined as the ratio between the number of objects for which we have successfully measured a redshift Nsuccess and the number of objects targeted
by the spectroscopic observations Ntarget. We define the success
of a redshift measurement on the basis of the redshift quality flag discussed in detail in Sect. 4.1; generally we adopt the 95% mea-surement confidence threshold (see Sect. 4.2) and accept flags 2, 3, 4 and 9 as markers of a successful measurement. Targeted objects for which the spectral extraction completely failed (of-ten these are spurious objects in the photometric catalogue) are not counted among the targets. Additionally, we correct for the stellar contamination by subtracting the number of spectroscopi-cally confirmed stars Nstarfrom the numerator and denominator.
The SSR estimator is therefore:
SSR= Nsuccess− Nstar
Ntarget− Nstar
. (3)
The ability to measure a redshift with confidence depends on a number of factors, starting from the observing conditions for a given survey pointing, and the apparent flux of a given galaxy, but also including intrinsic galaxy properties, such as its spec-tral type and redshift. The top part of Fig. 6 shows that, if we use just the galaxy apparent i-band magnitude to parametrize the SSR, we cannot successfully reproduce the SSR dependence on other parameters, such as the galaxy rest-frame colour. When instead we use multiple parameters, including the apparent mag-nitude, the rest-frame colour, the galaxy B-band luminosity, and the overall quality of the specific VIMOS quadrant (quantified via the mean SSR for all galaxies in that quadrant), we obtain a significant improvement on the SSR capability of describing the VIPERS sample, as shown in the bottom part of Fig. 6. In both rows of plots in that figure we show the SSR as a function of different observed photometric properties (blue solid curve), compared to the result of applying the SSR weight to correct for
incompleteness (red solid curve) the total VIPERS sample. Rest-frame properties (galaxy luminosity and colour) in this case are computed on the basis of the galaxy photometric redshift, in or-der to enable their computation also for galaxies without a spec-troscopic redshift measurement (that enter into the denominator of eq. 3). Photometric redshift estimates are taken from Moutard et al. (2016a), and have a typical accuracy of σz ≤ 0.04, with a
fraction of catastrophic failures smaller than 2%.
The SSR is computed adaptively using a nearest-neighbour algorithm. Depending on which parameters we want to use to parametrize the SSR, we build an N-dimensional dataset (with N = 1 when we use only the apparent magnitude, and N = 4 when we add also the rest-frame colour, the luminosity, and the quadrant quality); then, for each object in this N-dimensional space, we determine the distance RKto its Kthnearest neighbour
(we use K = 100). We then count the number of sources in the successfully measured sample that are contained within the radius RK: Nsuccess(≤ RK). The SSR at the specified point is
given by the fraction S S R = Nsuccess(≤ RK)/K. Distances in
this N-dimensional space are computed using the rank distance measure (i.e. the ranks of each parameter in the sample are used when computing separations).
Fig. 7 shows the bivariate distribution of SSR values as a function of rest-frame colour and redshift, apparent i-band mag-nitude, and rest-frame B-band luminosity, respectively. The mean SSR is about 83%, but it is clear from this figure that com-plex SSR variations exist as a function of galaxy properties. An obvious apparent magnitude trend is clearly visible in the fig-ure’s middle panel, but all panels quite clearly show how the lowest SSR values are characteristic of galaxies with intermedi-ate rest-frame colour. These are objects whose spectra contain neither strong emission lines (as would be seen in the bluest part of the sample) nor a strong 4000 Å break (as would be seen in the reddest part of the sample). This general feature was already observed for the zCOMOS bright survey (Lilly et al. 2009, see their Fig.2).
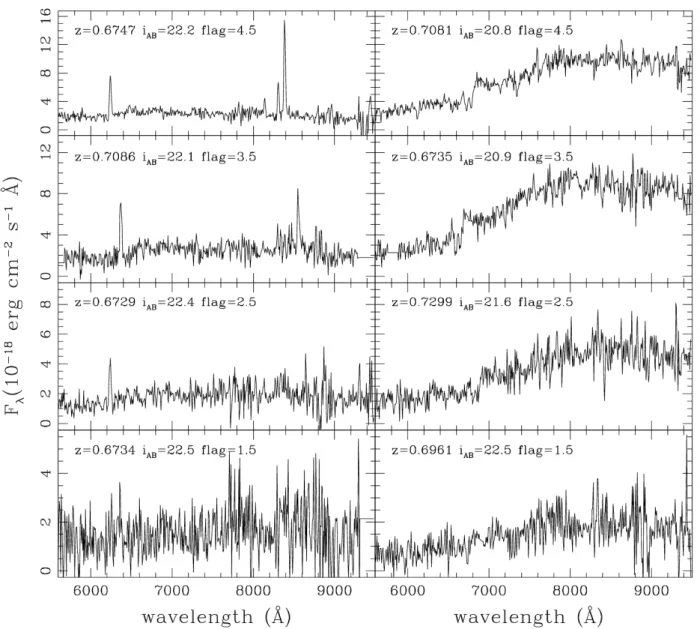
Fig. 8. Examples of VIPERS spectra: one late-type and one early-type galaxy spectrum is shown for the different redshift measurement quality flags. The measured redshift for all objects is close to z= 0.7, the peak of the VIPERS redshift distribution
4. Redshift measurements, confidence flags and statistical uncertainties
Fig. 8 shows a representative set of spectra of different quality, as available at the end of the automatic data reduction pipeline of VIPERS. This, together with the procedure for redshift vali-dation, have been extensively described in Garilli et al. (2010), Garilli et al. (2012), Guzzo et al. (2014) and Garilli et al. (2014). Here we briefly summarize the last part of this process, i.e. how redshifts are measured and their quality evaluated.
As the final step of the VIPERS automated data-reduction pipeline developed at INAF–IASF Milano (Garilli et al. 2014), redshifts were estimated using the EZ code (Garilli et al. 2010). These measurements are then reviewed and confirmed or modi-fied by two team members independently, using EZ in interactive mode through a user-friendly dedicated interface. The results of the two reviews are eventually matched, and differences recon-ciled, to produce the final redshift estimate and its associated quality flag.
All redshift measurements presented in the PDR-2 catalogue are as observed and have not been corrected to a heliocentric
or Local-Group reference frame. Information to perform these corrections is nevertheless contained in the FITS header of the spectra.
4.1. Redshift quality flags
The quality flag system adopted by the VIPERS survey has been inspired by and is in fact very close to those of other precursor surveys (e.g. Le Fèvre et al. 2005; Lilly et al. 2009). The mean-ing of the various flags has been described in detail in Garilli et al. (2014) and Guzzo et al. (2014); here we repeat the mean-ing of the flags for those objects released with PDR-2:
– Flags 4.X and 3.X: highly secure redshift, with confidence > 99%
– Flag 2.X: still fairly secure, > 95% confidence level – Flag 1.X: tentative redshift measurement, with ∼ 50%
chance to be wrong
– Flag 9.X: redshift based a single emission feature, usually [OII]3727 Å. With the PDR-1 data we showed that the con-fidence level of this class is ∼ 90%
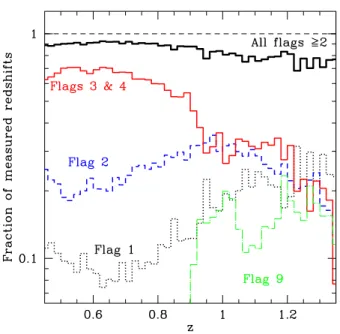
Fig. 9. Quality of the VIPERS redshift measurements for different redshifts. Specifically, the plot shows how the fraction of measurements for different quality flags changes as a function of redshift. Note how the "reliable sample", i.e. that with quality flag ≥ 2, to be used for statistical analyses, shows a stable measured fraction out to the limit of the survey.
After the human validation procedure has produced the inte-ger part of the redshift quality flag, a decimal fraction is added to it, with possible values 0.2, 0.4, 0.5, to indicate respectively no, marginal or good agreement of the spectroscopic measurement with the object photometric redshift (see Guzzo et al. 2014 for the specific criteria defining this agreement). If no photometric redshift exists for that object, the decimal part is set to 0.1.
A "1" in front of the above flags indicates a broad lines AGN spectrum, while a "2" indicates a second object serendipitously observed within the slit of a VIPERS target.
In all VIPERS papers, objects with a redshift flag between 2.X and 9.X are referred to as reliable (or secure) redshifts and are the only ones normally used in the science analyses. In Gar-illi et al. (2014) we discussed in detail the reliability of flag 9.X objects. In Fig. 9 the fraction of redshift measurements with a given quality flag is shown as a function of redshift, limited to the main redshift range covered by the VIPERS sample. Notice how the highest quality subset of redshift measurements is always the largest one in the survey, up to z ' 1.2 and also how, very impor-tantly, the fraction of measured redshifts with flag 2.X or larger (i.e. the reliable sample to be used for science investigations) is essentially constant out to at least z= 1.2.
4.2. Updated estimate of redshift reliability
As was done for PDR-1, we estimate redshift errors by compar-ing independent redshift measurements that are available for a subset of galaxies. Some VIPERS targets were observed more than once within the survey, or are in common with other sur-veys. This also gives us a way to quantify the confidence level of our quality flags.
At the end of the survey, the total number of targets with re-peated observations is 3,556, compared to 1,941 that were
avail-able at the time of PDR-1. For 3114 of these, two redshift mea-surements are available, including any value for the quality flag (see Table 1).
Considering the distribution of the differences between the two redshift measurements∆z, we define matching pairs as those that satisfy the condition |∆z| < 0.005. This threshold has been set on the basis of the first visible gap in the∆z distribution. This identifies 2,626 matching pairs (i.e. a matching fraction of 84%). This sample still includes some redshifts with quality flag 1, i.e. redshifts with confidence level ∼ 50 − 60% (see Guzzo et al. 2014), which are in general not reliable for statistical analyses and have been excluded from all VIPERS investigations so far. Restricting consideration to pairs with both flag 2.X or above (i.e the reliable measurements), the matching fraction rises to 92.3% (2,275 out of 2,466). Even further, if we consider only flags either 3.X or 4.X, i.e. the highest quality spectra, the matching reaches 99.1% (1,238 out of 1,249). Using eq. (7) in Garilli et al. (2014), we can employ these figures to estimate the average confidence level of single measurements in the reliable redshift sample
Cflag≥2=
√
0.923= 96.1% , (4)
and the one of the high-quality redshifts
Cflag3,4=
√
0.991= 99.54% , (5)
which agrees very well with the value obtained in Guzzo et al. (2014) and Garilli et al. (2014) using the PDR-1 data.
Comparable results are obtained when comparing the VIPERS measurements to external data. The VIPERS sky areas have a non negligible overlap with the VVDS Wide F22 sample Garilli et al. (2008, 844 galaxies) and the BOSS sample (Daw-son et al. 2013, 751 galaxies). The results of these compari(Daw-sons are shown in Table 1. Note the significantly higher matching fraction in the case of BOSS. This is easily understood when considering that BOSS CMASS galaxies have a magnitude limit brighter than i ' 20 and so all matches must correspond to bright VIPERS galaxies. Not surprisingly, then, the matching fraction in this case is comparable to that of the highest quality VIPERS class.
4.3. Updated estimate of redshift errors
An accurate knowledge of the typical redshift measurement un-certainty is clearly important for the scientific analysis of the VIPERS sample, in particular when modelling the observed shape of the power spectrum or the effect of Redshift Space Distortions (see the parallel papers by Rota et al. 2016; de la Torre et al. 2016; Pezzotta et al. 2016; Wilson et al. 2016). It is also important to probe the possible redshift dependence of this uncertainty. We have used the repeated redshift measure-ments discussed in the previous section to update the estimate originally presented in Guzzo et al. (2014) and Garilli et al. (2014). To obtain a robust estimate of the measurement er-ror we used the matching pairs of measurements (as defined in the previous section), computed the median absolute deviation (MAD) of the ∆z values, and scaled it to the standard devia-tion equivalent, which for a Gaussian distribudevia-tion is given by σ = 1.4826 × MAD. The resulting scatter, when we consider only reliable redshift measurements (quality flag 2.X and above, 2,275 pairs), is σ∆z = 0.0013. A very similar result is obtained by fitting a Gaussian to the distribution of∆z values.
With the current large set of duplicate measurements, we can also re-consider the overall approach used to characterise
Table 1. Statistics of double redshift measurements, both internal to the VIPERS sample and against external data.
Sample Ngal Nagree Matching σ2(∆z/(1 + z)) σz= σ2/
√ 2 σv= cσz Mean∆v (%) (km s−1) (km s−1) Internal Comparison All measurements 3,114 2,626 84.3% 0.00079 0.00056 166 – Both flags ≥ 2 2,466 2,275 92.3% 0.00077 0.00054 163 – Both flags 3,4 1,249 1,238 99.1% 0.00075 0.00053 159 –
Both flags ≥ 2; faint – 1,099 – 0.00077 0.00055 164 –
Both flags ≥ 2; bright – 336 – 0.00071 0.00050 150 –
Both flags ≥ 2; weak EL – 1,153 – 0.00079 0.00056 167 –
Both flags ≥ 2; strong EL – 508 – 0.00066 0.00046 139 –
External Comparison with VVDS
All measurements 737 629 85.3% 0.00093 0.00066 198 26
Both flags 3,4 358 350 97.8% 0.00083 0.00059 177 40
External Comparison with BOSS
All measurements 747 736 98.5% 0.00064 0.00045* 136* −108 VIPERS flags 3,4 690 684 99.1% 0.00061 0.00043* 130* −113 * This is probably an underestimate of the uncertainty on the VIPERS side, because the assumption of uncertainty equipartition does not fully apply in the BOSS comparison
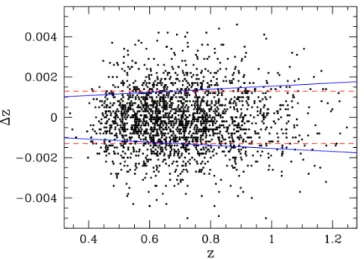
Fig. 10. Redshift measurement differences between two indepen-dent observations of the same object, obtained from a set of 2,466 VIPERS galaxies with quality flag ≥ 2, plotted as a function of the ob-ject redshift. Non-matching measurements (defined as being discrepant by more than |∆z| = 0.005) have been excluded from the plot. The dashed red and continuous blue lines show the 1-sigma scatter estimates obtained assuming the scatter to be independent from z, or scaling as (1+ z), respectively.
the redshift measurement uncertainty. For PDR-1 we adopted the common assumption that redshift uncertainties scale with the redshift itself as (1+z). This assumption would apply in the sim-ple case of a spectrograph that yields spectra with a resolution and sensitivity that are constant and independent of wavelength, but neither of these criteria are satisfied by VIMOS spectra. The spectrum signal-to-noise ratio is influenced by the observing conditions, but is nevertheless mostly driven by the galaxy ap-parent magnitude. This in turn depends (albeit with a significant scatter) on the galaxy redshift, and therefore must induce some increase of the redshift measurement error with redshift. Also, when redshifts are measured through cross-correlation with
tem-Fig. 11. The scatter in the∆z values (red circles) and in the ∆z/(1 + z) values (blue triangles) for objects in a narrow redshift bin, as a function of the median redshift for the bin. The bins are built to contain a fixed number of objects (500), and they are not statistically independent since they partly overlap each other. The blue line shows the mean scatter derived from the blue points, with the (1+ z) scaling applied to it.
plates, as in the case of VIPERS, some scaling of the uncertainty with redshift could be expected because of the (1+ z) shrinking of the available rest-frame wavelength range (although when the redshift measurement is dominated by a few key features in the spectrum, which remain observable over most of the survey red-shift range – e.g. the [OII]λ3727 line and 4000Å break region – this effect should be negligible). In short, a redshift dependence of the measurement error can be expected, but not necessarily with a linear dependence on (1+ z).
The observed distribution of ∆z values as a function of galaxy redshift is shown in Fig. 10, limited to the matching pairs of measurements. Using these data points, we have determined the scatter in both the∆z and the ∆z/(1 + z) values within
sepa-rate redshift bins, still using the MAD estimator as for the whole sample. The results of this estimate are shown in Fig. 11, where it is clearly seen that the observed scatter of the∆z/(1 + z) dif-ferences is substantially constant, whereas the scatter of the∆z differences increases with the median redshift of the bin, with a scaling that is roughly proportional to (1+ z). We therefore conclude that this simple scaling does after all provide an ad-equate description of the effective uncertainty of the VIPERS redshift measurements. We do not extend this exercise to red-shifts above 1.1, because of the limited number of repeated mea-surements available at those redshifts. The final estimate we ob-tain for the single redshift measurement uncerob-tainty is therefore σz = 0.00054 × (1 + z), which we can compare with the figure
of σz= 0.00047 × (1 + z) given in the PDR-1 paper (on the basis
of 1,235 measurement pairs). Notice that this is the estimate for the single measurement uncertainty, which we derive from the scatter measurement listed in Table 1 by assuming an equal con-tribution from the two measurements to the overall uncertainty, and therefore the single measurement uncertainty is obtained as the scatter value divided by a factor of
√ 2.
Using the sample of 2,275 reliable pairs of measurements (flags 2, 3, 4, 9), it is interesting to further explore how this scat-ter varies with the galaxy apparent magnitude or when strong emission lines are present in the spectrum. We isolate bright and faint subsets (galaxies with iAB≤ 20.75 and iAB≥ 21.75,
respec-tively), and subsets with strong or weak emission-line spectra (galaxies with flux([OII]) ≥ 1.5 × 10⁻¹⁶and between 2.0 × 10⁻¹⁷
and 1.5 × 10⁻¹⁶erg cm−2s−1A−1, respectively). As expected, sig-nificant differences are observed between these subsets. Table 1 shows that galaxies which are brighter or have strong emission lines in their spectra provide on average significantly more accu-rate redshift measurements, respectively by about 10 and 20%.
As in the case of the confidence level estimates, the com-parison with independent surveys further confirms the accuracy of the VIPERS redshift measurements. The scatter between VIPERS and the VVDS is only marginally larger than that ob-served in the internal comparison. The scatter against BOSS is instead significantly smaller, because the higher spectral resolu-tion of the BOSS spectra and the brighter magnitude limit of the BOSS sample both contribute to a higher redshift measurement accuracy for the BOSS galaxies, and therefore in this case we do not have equal contributions to the observed scatter, with the result that this is somewhat reduced in its observed value.
5. The PDR-2 dataset
5.1. The PDR-2 sample
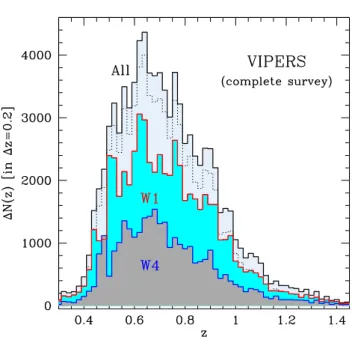
In total we have obtained spectra for 97,414 objects: 94,335 main survey targets (i.e. the objects selected on the basis of the colour-colour selection criterion discussed in Sect. 2.1), 1,478 serendipitous targets in the slits, and 1,601 AGN candidates, originally selected on the basis of their colour. The total num-ber of measured redshifts is 91,507 (quality flags 1 and above); of these, 86,775 make up the main galaxy survey, with the re-maining ones belonging to stars and colour selected AGN. The galaxy sample with reliable redshift measurements (quality flag from 2.X to 9.X), contains 76,552 objects, with a median redshift of 0.69, and with 90% of the objects located within the redshift range (0.43, 1.04).
Fig. 12 shows the redshift distribution of the final data set, providing also the two separate distributions for the two survey areas W1 and W4. This gives a visual impression of the level of sample variance still present in the redshift distribution
av-Table 2. The VIPERS PDR-2 spectroscopic sample
Sample Number
Spectroscopically observed 97,414 — Main survey targets 94,335 — Serendipitous targets 1,478 — AGN candidates (not part 1,601 of main survey)
Measured redshifts Number
All measured 91,507
Main survey, all targets 89,022
— galaxies 86,775
— stars 2,247
Flag ≥ 2 main survey, all targets 78,586 Flag ≥ 2 main survey, galaxies 76,552
Fig. 12. The galaxy redshift distribution in the final VIPERS PDR-2 catalogue (black solid line), and separately within the W1 and W4 fields (red and blue solid lines, respectively). These include all mea-sured redshifts, with flag 1 or larger. The dotted line shows the result of plotting only the flag ≥ 2 galaxies, i.e. those that can be used reliably in statistical analyses.
eraged over areas of this size. The two panels of Fig. 13 show instead the distribution of B-band luminosity and of stellar mass for the reliable redshift sample, to give a quantitative idea of the distribution of these two important galaxy properties within the VIPERS sample. Luminosities and stellar masses have been es-timated through SED fitting of the available photometry (from UV to K) as described in Moutard et al. (2016b). It is clear from these figures that the colour-colour selection used to select the VIPERS parent sample (see Sect. 2.1) has been highly effective in selecting a well defined galaxy sample at z > 0.5, which in-cludes a sizeable set of very massive and bright galaxies.
Some detail about the large-scale distribution of the VIPERS galaxies is instead provided by the cone diagrams of Fig. 14, which show quite clearly the abundance of structures sampled
Fig. 13. The distribution of B-band luminosities (left) and stellar masses (right) computed for all objects with reliable redshift (flag > 2.0) in the PDR-2 catalogue. These are estimated through SED fitting of all available photometry (from UV to K) as described in Moutard et al. (2016b). Note that an explicit value of H0= 70 km s−1Mpc−1for the Hubble constant is used here.
02h00m 02h15m 02h30m 1300 1400 1500 1600 1700 1800 1900 2000 2100 2200 2300 2400 2500 Comoving distance [h−1Mpc] 02h00m 02h15m 02h30m 1300 1400 1500 1600 1700 1800 1900 2000 2100 2200 2300 2400 2500 Comoving distance [h−1Mpc] 0.6 0.55 0.85 0.65 1.05 1.0 0.7 0.8 0.75 0.95 0.9 0.5 Redshift 0.6 0.55 0.85 0.65 1.05 1.0 0.7 0.8 0.75 0.95 0.9 0.5 Redshift 22h00m 22h15m 1300 1400 1500 1600 1700 1800 1900 2000 2100 2200 2300 2400 2500 Comoving distance [h−1Mpc] 22h00m 22h15m 1300 1400 1500 1600 1700 1800 1900 2000 2100 2200 2300 2400 2500 Comoving distance [h−1Mpc] 0.6 0.55 0.85 0.65 1.05 1.0 0.7 0.75 0.8 0.95 0.9 0.5 Redshift 0.6 0.55 0.85 0.65 1.05 1.0 0.7 0.75 0.8 0.95 0.9 0.5 Redshift
Fig. 14. The distribution of galaxies at 0.45 < z < 1.1 as shown by the final VIPERS PDR-2 catalogue in the W1 and W4 fields (top and bottom cone diagram, respectively). Galaxy positions are projected along declination (1.5 degrees for W4, about 1.8 degrees for W1). Each galaxy is represented by a filled circle of size proportional to its B-band luminosity and coloured according to its rest-frame U − V colour.
by VIPERS, and the amount of segregation of the overall galaxy population as a function of the local galaxy density.
5.2. Access to publicly released data The PDR-2 data release includes:
– the total reference photometric catalogue, including both the VIPERS parent photometric sample, the objects excluded from this sample on the basis of the colour-colour criterion
described in Sect. 2.1, and the objects classified as stars; the parameter classFlag is used in the catalogue to identify these categories (objects in the VIPERS parent photometric sample have classFlag=1). The catalogue contains both the CFHTLS release T0005 photometry used for the VIPERS sample selection (see Sect. 2.1), and the VIPERS Multi-Lambda photometry (CFHTLS release T0007 supplemented with UV and K-band data), described in Sect. 2.2.
– the photometric and spectroscopic masks described in Sect. 3.1 and 3.2, in the form of DS9 region files.
– the redshift catalogue with the parameters described in Sect. 4, and which includes the estimates of the Target Sam-pling Rate and Spectroscopic Success Rate described in Sect. 3.4 and 3.5. This catalogue includes all the available redshift measurements (quality flag ≥ 1), and not only those in the reliable redshift sample. Also in this catalogue the pa-rameter classFlag can be used to identify the objects that be-long to the main survey sample (objects in this sample have classFlag=1).
– the wavelength- and flux-calibrated one-dimensional spec-tra for the objects included in the redshift catalog; these are provided as FITS tables containing the following columns: 1) wavelength (in Angstrom); 2) cleaned-spectrum flux (in erg cm−2s−1A−1); the spectral cleaning procedure, based on
a PCA reconstruction of the observed spectra to remove the strongest residuals from the sky subtraction, is described in detail in Marchetti et al. (2016); fluxes are also corrected for atmospheric absorption effects; 3) flux uncertainty estimate (same units as the flux); 4) the sky intensity estimate for the slit (in counts); 5) original spectrum flux (same units as the flux), with only the correction for atmospheric absorption ap-plied; 6) the cleaned-spectrum mask (digital mask to identify the pixels edited by the cleaning procedure).
– optionally, also the two-dimensional spectra are available; these are wavelength calibrated, but without the flux calibra-tion nor the correccalibra-tion for atmospheric absorpcalibra-tion applied. The complete data release of VIPERS is avail-able at http://vipers.inaf.it, while the spectro-scopic part is also available via the ESO archive at http://eso.org/rm/publicAccess#/dataReleases.
Acknowledgements. We acknowledge the crucial contribution of the ESO staff for the management of service observations. In particular, we are deeply grateful to M. Hilker for his constant help and support of this program. Italian participa-tion to VIPERS has been funded by INAF through PRIN 2008, 2010, and 2014 programs. LG, JB and BRG acknowledge support from the European Research Council through grant n. 291521. OLF acknowledges support from the Euro-pean Research Council through grant n. 268107. JAP acknowledges support of the European Research Council through grant n. 67093. WJP and RT ac-knowledge financial support from the European Research Council through grant n. 202686. AP, KM, and JK have been supported by the National Science Centre (grants UMO-2012/07/B/ST9/04425 and UMO-2013/09/D/ST9/04030). WJP is also grateful for support from the UK Science and Technology Facilities Coun-cil through the grant ST/I001204/1. EB, FM and LM acknowledge the support from grants ASI-INAF I/023/12/0 and PRIN MIUR 2010-2011. LM also ac-knowledges financial support from PRIN INAF 2012. YM acac-knowledges sup-port from CNRS/INSU (Institut National des Sciences de l’Univers). TM and SA acknowledge financial support from the ANR Spin(e) through the french grant ANR-13-BS05-0005. CM is grateful for support from specific project funding of the Institut Universitaire de France. SDLT and CM acknowledge the support of the OCEVU Labex 11-LABX-0060) and the A*MIDEX project (ANR-11-IDEX-0001-02) funded by the "Investissements d’Avenir" French govern-ment program managed by the ANR. and the Programme National Galaxies et Cosmologie (PNCG). Research conducted within the scope of the HECOLS In-ternational Associated Laboratory, supported in part by the Polish NCN grant DEC-2013/08/M/ST9/00664.
References
Abazajian, K. N., Adelman-McCarthy, J. K., Agüeros, M. A., et al. 2009, ApJS, 182, 543
Ahn, C. P., Alexandroff, R., Allende Prieto, C., et al. 2012, ApJS, 203, 21 Alam, S., Albareti, F. D., Allende Prieto, C., et al. 2015, ApJS, 219, 12 Bottini, D., Garilli, B., Maccagni, D., et al. 2005, PASP, 117, 996
Colless, M., Peterson, B. A., Jackson, C., et al. 2003, ArXiv e-print, astro-ph/0306581
Dawson, K. S., Schlegel, D. J., Ahn, C. P., et al. 2013, AJ, 145, 10
de la Torre, S., Guzzo, L., Peacock, J. A., et al. 2013, A&A, 557, A54 de la Torre, S. et al. 2016, A&A submitted, ArXiv e-print XXXX.YYYY Eisenstein, D. J., Weinberg, D. H., Agol, E., et al. 2011, AJ, 142, 72
Emerson, J. P., Sutherland, W. J., McPherson, A. M., et al. 2004, The Messenger, 117, 27
Garilli, B., Fumana, M., Franzetti, P., et al. 2010, PASP, 122, 827 Garilli, B., Guzzo, L., Scodeggio, M., et al. 2014, A&A, 562, A23 Garilli, B., Le Fèvre, O., Guzzo, L., et al. 2008, A&A, 486, 683 Garilli, B., Paioro, L., Scodeggio, M., et al. 2012, PASP, 124, 1232 Guzzo, L., Scodeggio, M., Garilli, B., et al. 2014, A&A, 566, A108
Hammersley, P., Christensen, L., Dekker, H., et al. 2010, The Messenger, 142, 8 Hildebrandt, H., Erben, T., Kuijken, K., et al. 2012, MNRAS, 421, 2355 Hudelot, P., Cuillandre, J.-C., Withington, K., et al. 2012, VizieR Online Data
Catalog, 2317
Jarvis, M. J., Bonfield, D. G., Bruce, V. A., et al. 2013, MNRAS, 428, 1281 Le Fèvre, O., Cassata, P., Cucciati, O., et al. 2013, A&A, 559, A14
Le Fèvre, O., Saisse, M., Mancini, D., et al. 2003, in Proc. SPIE, ed. M. Iye & A. F. M. Moorwood, Vol. 4841, 1670–1681
Le Fèvre, O., Vettolani, G., Garilli, B., et al. 2005, A&A, 439, 845 Lilly, S. J., Le Brun, V., Maier, C., et al. 2009, ApJS, 184, 218 Marchetti, A. et al. 2016, A&A submitted, arXiv:XXXX.YYYY Martin, D. C., Fanson, J., Schiminovich, D., et al. 2005, ApJ, 619, L1 Moutard, T., Arnouts, S., Ilbert, O., et al. 2016b, A&A, 590, A103 Moutard, T., Arnouts, S., Ilbert, O., et al. 2016a, A&A, 590, A102 Pezzotta, A. et al. 2016, A&A submitted, ArXiv e-print XXXX.YYYY Puget, P., Stadler, E., Doyon, R., et al. 2004, in Proc. SPIE, Vol. 5492,
Ground-based Instrumentation for Astronomy, ed. A. F. M. Moorwood & M. Iye, 978–987
Rota, S. et al. 2016, A&A in press, arxiv:XXXX.YYYY Wilson, M. et al. 2016, A&A submitted, arXiv:XXXX.YYYY York, D. G., Adelman, J., Anderson, Jr., J. E., et al. 2000, AJ, 120, 1579
1 INAF - Istituto di Astrofisica Spaziale e Fisica Cosmica Milano, via Bassini 15, 20133 Milano, Italy
2 INAF - Osservatorio Astronomico di Brera, Via Brera 28, 20122 Milano – via E. Bianchi 46, 23807 Merate, Italy
3 Università degli Studi di Milano, via G. Celoria 16, 20133 Milano, Italy
4 INAF - Osservatorio Astronomico di Bologna, via Ranzani 1, I-40127, Bologna, Italy
5 Aix Marseille Univ, CNRS, LAM, Laboratoire d’Astrophysique de Marseille, Marseille, France
6 INAF - Osservatorio Astrofisico di Torino, 10025 Pino Torinese, Italy
7 Laboratoire Lagrange, UMR7293, Université de Nice Sophia An-tipolis, CNRS, Observatoire de la Côte d’Azur, 06300 Nice, France 8 Department of Astronomy, University of Geneva, ch. d’Ecogia 16,
1290 Versoix, Switzerland
9 Dipartimento di Fisica e Astronomia - Alma Mater Studiorum Uni-versità di Bologna, viale Berti Pichat 6/2, I-40127 Bologna, Italy 10 Institute of Physics, Jan Kochanowski University, ul. Swietokrzyska
15, 25-406 Kielce, Poland
11 National Centre for Nuclear Research, ul. Hoza 69, 00-681 Warszawa, Poland
12 INFN, Sezione di Bologna, viale Berti Pichat 6/2, I-40127 Bologna, Italy
13 Aix-Marseille Université, Jardin du Pharo, 58 bd Charles Livon, F-13284 Marseille cedex 7, France
14 IRAP, 9 av. du colonel Roche, BP 44346, F-31028 Toulouse cedex 4, France
15 Astronomical Observatory of the Jagiellonian University, Orla 171, 30-001 Cracow, Poland
16 School of Physics and Astronomy, University of St Andrews, St An-drews KY16 9SS, UK
17 INAF - Istituto di Astrofisica Spaziale e Fisica Cosmica Bologna, via Gobetti 101, I-40129 Bologna, Italy
18 INAF - Istituto di Radioastronomia, via Gobetti 101, I-40129, Bologna, Italy
19 Aix Marseille Univ, Univ Toulon, CNRS, CPT, Marseille, France 20 Dipartimento di Matematica e Fisica, Università degli Studi Roma
Tre, via della Vasca Navale 84, 00146 Roma, Italy
21 INFN, Sezione di Roma Tre, via della Vasca Navale 84, I-00146 Roma, Italy
22 INAF - Osservatorio Astronomico di Roma, via Frascati 33, I-00040 Monte Porzio Catone (RM), Italy
23 INAF - Osservatorio Astronomico di Trieste, via G. B. Tiepolo 11, 34143 Trieste, Italy
24 Institute d’Astrophysique de Paris, UMR7095 CNRS, Université Pierre et Marie Curie, 98 bis Boulevard Arago, 75014 Paris, France 25 Department of Astronomy & Physics, Saint Mary’s University, 923
Robie Street, Halifax, Nova Scotia, B3H 3C3, Canada
26 Institute for Astronomy, University of Edinburgh, Royal Observa-tory, Blackford Hill, Edinburgh EH9 3HJ, UK
27 Institute of Cosmology and Gravitation, Dennis Sciama Building, University of Portsmouth, Burnaby Road, Portsmouth, PO13FX 28 Institut Universitaire de France